

Abstract
High-resolution, multi-electrode mapping is providing valuable new insights into the origin, propagation, and abnormalities of gastrointestinal (GI) slow wave activity. Construction of high-resolution mapping arrays has previously been a costly and time-consuming endeavor, and existing arrays are not well suited for human research as they cannot be reliably and repeatedly sterilized. The design and fabrication of a new flexible printed circuit board (PCB) multi-electrode array that is suitable for GI mapping is presented, together with its in vivo validation in a porcine model. A modified methodology for characterizing slow waves and forming spatiotemporal activation maps showing slow waves propagation is also demonstrated. The validation study found that flexible PCB electrode arrays are able to reliably record gastric slow wave activity with signal quality near that achieved by traditional epoxy resin-embedded silver electrode arrays. Flexible PCB electrode arrays provide a clinically viable alternative to previously published devices for the high-resolution mapping of GI slow wave activity. PCBs may be mass-produced at low cost, and are easily sterilized and potentially disposable, making them ideally suited to intra-operative human use.
Keywords: PCB, Gastric electrical activity, Smooth muscle, Activation map, Velocity
INTRODUCTION
The use of multi-electrode recording arrays is a key research tool in modern electrophysiology.30 The technique involves placing a spatially dense array of electrodes over an electrically active tissue surface, and simultaneously recording the resultant signals across multiple sites. Activation maps (graphic and quantitative characterizations of electrical propagation) can be generated from these recordings, eliciting detailed information on the spatiotemporal patterns of electrical propagation.29,32 High-resolution (HR) mapping has been widely employed in cardiac electrophysiology, providing information that has been critical to an improved understanding of the initiation and maintenance of both normal and dysrhythmic cardiac electrical behavior. A number of basic dysrhythmic mechanisms have been defined using cardiac HR mapping, including re-entrant spiral waves,19 rotors,28 and multiple wavelet propagations.17,28 Like the heart, the stomach and small intestine also have a propagating electrical activity that initiates and coordinates motility, known as the slow wave.11,12,15 However, the potential for gastrointestinal (GI) HR mapping has only been realized in the last decade, as shown by Lammers et al. in their work describing the precise origin and propagation of slow waves in the small intestine.20,22 Recently, HR mapping has also been employed to examine the events underlying gastric slow wave dysrhythmias, revealing complex focal activities and waveform re-entry patterns not apparent in earlier studies employing fewer electrodes.23 Detailed characterization of slow wave dysrhythmias is a research priority, as they are widely thought to underlie common clinical conditions such as gastroparesis, 7,13,14,34 functional dyspepsia,6,26 and postoperative ileus.3,16
To the authors’ knowledge, all GI HR mapping studies to date have been performed in animal models, using custom-built unipolar electrode assemblies. Construction of these assemblies has required considerable skill and time as it requires individually embedding up to 240 silver-tipped wires into dense regular arrays (typically with an inter-electrode distance 1–3 mm) within a base plate, followed by soldering, shield installation, and encasement in silicone and/or epoxy glue.2 The manual assembly may also increase the chance of imprecise inter-electrode spacing. While these electrode assemblies have generated high-quality signals, such platforms have some important limitations. Other than the time and expense involved in their construction, they are relatively inflexible, and therefore do not readily conform to the curvature of GI organs required to achieve good electrical contact. Most significantly, these platforms are not well suited to HR mapping in human subjects, because they are vulnerable to heat or water damage during the sterilization process. There is also potential for trapping of contaminated matter in the depressions on the base plates of these assemblies, increasing the risk of transmitting infectious diseases. Printed circuit board (PCB) electrode arrays have been used for HR mapping of cardiac electrical activity. 10,35–37 These arrays can be mass produced with relative ease and low cost. However, existing cardiac PCBs are not useful for recording GI slow wave activity, due to the inappropriate size of their recording tips, their small size, and their high electrode density, all of which have been customized to suit the substantially higher propagation velocity and amplitude of cardiac electrical activity. We present a new unipolar PCB electrode design that is suitable for the HR mapping of GI slow wave activity. This new electrode array allows gastrointestinal HR mapping in human subjects, and permits optimum surface area to electrode array contact during mapping of curved organ surfaces. We also present the validation of this platform in a porcine model, together with the methodology used for characterizing slow wave activity used in this validation.
PCB DESIGN AND FABRICATION
A single-layer flexible PCB template was designed using Protel (version 99SE) software (Altium, Australia). The manufacturer specifications were measured in mil (1 mil = 0.0254 mm), the measurements in this article are given to the closest mm. The electrode design (Fig. 1) consisted of: (i) a head section (30 × 61 mm), which contained an array of 32 electrodes; (ii) a midsection (28 × 339 mm), which contained connecting tracks to the electrodes; and (iii) a plug section (50 × 25 mm), which contained the foot-prints (pinholes) for a standard 68 straight-pin SCSI (Small Computer System Interface) plug. The conduction tracks of the midsection were routed to meet 32 of the 68 foot-prints in the plug section. The 32 electrode layout was chosen to accommodate our chosen recording system (see below).
Figure 1.

Schematic of PCB (printed circuit board) electrode; (a) shows the full electrode; (b) shows the plug end of the PCB electrode. There are 68 foot-prints (solid dots) for a standard 68 straight-pin PCB plug. (c) Shows an enlarged view of the recording head with 32 electrode pads on each platform.
The electrodes in the head section were arranged in a 4 × 8 configuration (Fig. 1c). An inter-electrode distance of 7.62 mm was chosen. The reason for choosing this distance was to optimally fit the tracks connecting the electrodes to the SCSI plug. The track width was 0.20 mm, and 14 tracks were fitted in the middle row of the electrode array (Fig. 1), necessitating a minimal width of approximately 7 mm between the electrodes. The specified track width was chosen to lower the cost of production. Halving the track width to 0.1 mm, which is required for cardiac PCBs with their much finer arrays, would increase the cost significantly and there are a limited number of manufacturers with capability of printing PCBs at this finer resolution. Circular pads of diameter 0.28 mm were used as electrode contacts, based on previous experience regarding the optimal size for slow wave recording. 21 Drills holes (0.20 mm drill size), enclosed by annular rings (0.25 mm) were plated in the plug section to generate foot-prints to the SCSI plug (Fig. 1b). The board material thickness was 0.08 mm and the entire length of the electrode assembly was designed to be flexible. The edges of the head section were extended by half an inter-electrode distance (i.e., 3.81 mm), so that adjacently placed platforms could be tessellated while maintaining an equal inter-electrodes distance across separate platforms.
The base material was Polymide (PI). The inlaid tracks and connectors were manufactured in copper (Type RA Cu 14.79 mL), and the connectors were surfaced plated with gold. Standard solder mark color was applied to the board. The manufacture cost was USD $215.60 for tooling, and $7.46 per unit for per 100 units. Larger quantities can be ordered and results in a decrease in the per-unit price. The manufacture lead-time was 15 days. A 32 straight-pin female SCSI plug was soldered to each PCB electrode, requiring an average assembly time per PCB of less than 15 min. The PCBs were tested to be suitable for sterilization by ethylene oxide, for single or repeated use in a human intra-operative setting.
METHODS OF VALIDATION
Ethical approval for porcine experiments was obtained from the local institutional committee (The University of Auckland Animal Ethics Committee). The International Guiding Principles for Biomedical Research Involving Animals and Human Beings were followed. Validation was performed in two female weaner cross-breed pigs of mean weight 37.3 kg. Induction anesthesia was achieved with Zoletil (Tiletamine HCl 50 mg mL−1 and Zolazepam HCl 50 mg mL−1), followed by intubation and maintenance anesthesia with isoflurane (2.5–5%, with oxygen flow of 400 mL within a closed-circuit anesthetic system). Pigs were placed supine on a heating pad, with continuous monitoring undertaken to ensure that arterial blood pressure, temperature and oxygen saturations were maintained within normal physiological ranges. The pigs were euthanized at the completion of the experiments by a bolus intravenous injection of 50 mL magnesium sulfate, while they were still under anesthesia. A bilateral subcostal laparotomy was performed, and the anterior gastric serosal surface exposed with minimal gastric handling. Three PCBs were positioned on the anterior porcine gastric corpus as shown in Fig. 2a. Three PCBs were used in order to cover a similar area to that covered by the standard reference electrode array described below (~48 vs. ~39 cm2). The PCBs were held together using 3M Tegaderm on the non-recording surface. PCB orientation and serosal contact was maintained with gentle overlying pressure using warm saline-soaked gauze. The wound edges were approximated, and a 10 min period of stabilization was allowed prior to a 15 min recording period. The PCBs were then removed, and replaced by a 48-electrode (48E) array (inter-electrode distance 9 mm; 4 × 12 array), of the epoxy-embedded design that has typically been used for the in vivo mapping of GI smooth muscle to date.2,20,21 The arrays were placed in the same orientation for each animal, and between animals (Fig. 2b). This was achieved by registering the arrays in the longitudinal axis of the organ at approximately 30 mm (one PCB height) above the ‘fundal line’, which runs transversely from the upper border of the gastro-oesophageal junction to the greater curvature. The arrays were registered in the transverse axis of the organ by placing their upper-left corner against the ‘mid-curvature line,’ which runs from the tip of the fundus to the pylorus at the midpoint between the curvatures. The two pigs had stomachs of similar size, allowing consistent placement of the arrays between animals. A further 10 min period of stabilization was allowed prior to a 15 min recording period using the 48E array.
Figure 2.

Position of electrode platforms as used during validation; (a) three PCB arrays were aligned along the anterior gastric serosal surface (covering a total surface area of 55.74 cm2); (b) 48 channel (48E) silver wire (silicone-embedded) platform on gastric corpus. Validation electrograms from gastric serosa are shown for: (c) selected electrograms from the top PCB (highlighted channels in (a)), obtained from position shown in (a); (d) selected electrograms from 48E platform (highlighted channels in (b))—only those channels corresponding to the approximate position of the top PCB are shown.
All recordings were acquired using the ActiveTwo System (Biosemi, Amsterdam).1 The common mode sense (reference) electrode was placed on the body surface of lower abdomen, 5 cm below the incision for all recording sessions. The right-leg drive electrode was placed on the lower right leg. Each PCB electrode was connected to the acquisition box via a 1.5 m 68-way ribbon cable. The acquisition box was in turn connected to a Dell M1450 notebook computer via a fiberoptic cable. The acquisition software was written in Labview 8.2 (National Instruments, Texas). The recording frequency was set to 512 Hz.
Characterizing Slow Wave Activity
Raw slow wave recordings were filtered using a second order Bessel low-pass filter of 4 Hz, and filtered serosal slow waves were characterized by amplitude and frequency. Recorded noise was quantified by the amplitude of the highest frequency component in a power spectrum of a 20 s window. The signal-to-noise ratio (SNR) is expressed in dB.
The activation times of slow waves were identified by the point of maximum negative derivative of each slow wave event (Fig. 3), and normalized across the PCB electrograms by subtracting the specified event times by the minimum time. After marking slow waves in all channels for a given event, the amplitude of each slow wave was measured. The average amplitude (mean ± standard error of the mean; SEM) from all sites was also computed.
Figure 3.
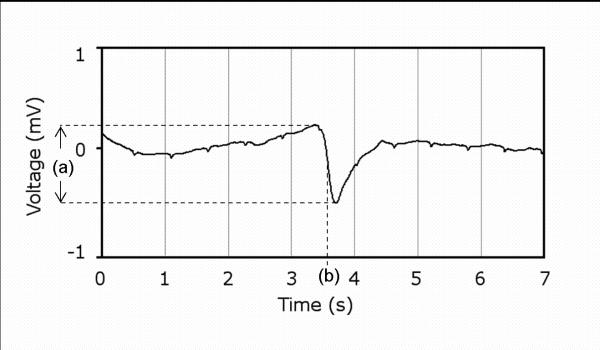
A single slow wave event recorded showing: (a) amplitude; and (b) activation time (measured from the point of most negative deflection (derivative).
The normalized activation times were plotted in the same spatial arrangement as the PCB electrodes. Interpolation of electrodes that had not adequately recorded the slow wave activation was performed using the linear interpolation scheme that is programmed in the ‘linear’ method in the griddata function in Matlab (version 2006b). However, interpolation was avoided wherever possible. Three further iterations of uniform linear interpolations were performed on the activation times to smooth the isochrones of activation times. Isochrones were then calculated from the activation times, showing the timing and direction of slow wave propagation.
Velocities were calculated based on the approach previously reported by Lammers et al.22 The local conduction velocity was calculated based on the gradient of averaged activation times in the X and Y directions, from the four neighboring sites as shown in Fig. 4. This procedure is repeated for all other sites throughout the activation map. The averages (mean ± SEM) of velocity in the X and Y direction, and in the direction of propagation were also computed for comparison purpose.
Figure 4.

Activation times are mapped in accordance to (a) the PCB electrode configuration. Local velocity is calculated based on (b) the activation times at the immediate four neighboring electrodes. An example calculation is provided alongside the formula.
Statistical Method
Amplitude, net velocity, and slow wave propagation direction are compared from averages taken over 10 consecutive slow wave events from each pig, via the student t-test. A p-value of <0.05 was considered significant.
RESULTS
Gastric serosal slow waves were immediately and continuously recorded with both the PCB arrays (in a minimum of 82% of contacts for the two pig studies) and the 48E brush platform, indicating good contact with the serosal surface for both types of electrode arrays. Sample electrograms from the PCB and 48E brush on the porcine gastric corpus are presented in Fig. 2 panel (c) and (d). An activation map was constructed from the first slow wave event from the electrograms obtained from the PCBs and 48E as described by the methodology above. Slow waves were found to propagate in the normal aboral direction toward the gastric pylorus (Fig. 5). In Fig. 5, data for 17 out of the 96 electrodes were interpolated (3 in PCB A; 8 in PCB B; 6 in PCB C).
Figure 5.
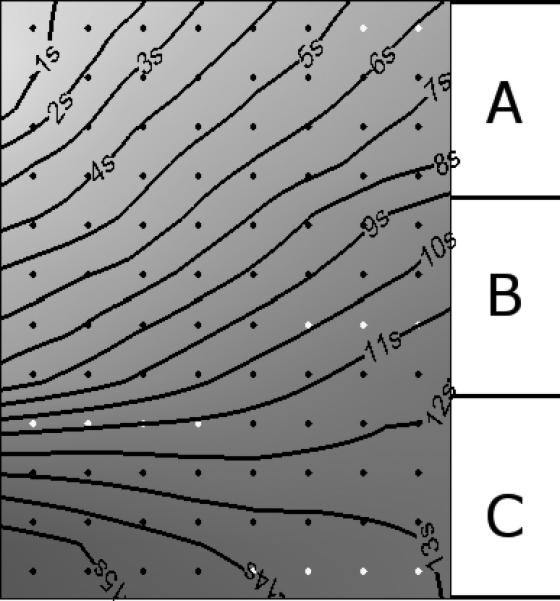
Activation map showing the spatiotemporal propagation sequence of a gastric slow wave, constructed from 3 PCB electrodes placed in the position shown in Fig. 2a. Diamonds represent electrode positions, and are colored gray when a channel value has been interpolated.
The recorded results from each platform (when analyzed separately) were not significantly different between the two pigs, and were therefore deemed suitable to be averaged together for comparison. The comparison between PCB and E48 is tabulated below (Table 1). In terms of recording quality, the 48E demonstrated a stronger SNR of 18.67 dB, compared to 9.71 dB registered by the PCB. The amplitude of slow waves recorded by the PCB was on average 0.17 ± 0.01 mV, which was smaller than the amplitude (0.52 ± 0.04 mV) recorded by the 48E over 10 cycles from each pig. PCBs recorded an average propagation velocity of 12.18 ± 0.84 mm s−1 in the X-direction, 8.19 ± 0.46 mm s−1 in the Y-direction, and 15.98 ± 0.34 mm s−1 in the direction of propagation (62.95 ± 2.10 degrees). The 48E recorded an average propagation velocity of 11.13 ± 3.8 mm s-1 in the X-direction, 7.69 ± 1.48 mm s−1 the Y-direction, and 13.81 ± 2.85 mm s−1 in the direction of propagation (60.61 ± 4.05 degrees). Slow wave characteristics recorded form the 48E platform (maximum of 48 sites per slow event) generally showed greater variability than those recorded by the PCBs (maximum of 96 sites per slow wave event).
Table 1.
Comparison of slow wave characteristics.
| PCB | E48 | p-value | |
|---|---|---|---|
| SNR (dB) | 9.71 | 18.67 | N/A |
| Amplitude (mV) | 0.17 ± 0.01 | 0.52 ± 0.04 | 1.0489 × 10⁻⁷ |
| X-Velocity (mm s−1) | 12.18 ± 0.84 | 11.13 ± 3.8 | 0.0648 |
| Y-Velocity (mm s−1) | 8.19 ± 0.46 | 7.69 ± 1.48 | 0.4250 |
| Net-Velocity (mm s−1) | 15.98 ± 0.34 | 13.81 ± 2.85 | 0.1473 |
| Direction (degrees) | 62.95 ± 2.10 | 60.61 ± 4.05 | 0.3060 |
DISCUSSION
We have designed a novel flexible printed circuit board (PCB) electrode array for high resolution (HR) mapping of gastrointestinal (GI) slow wave activity. Our flexible PCB arrays (gold contacts, copper tracks) were found to perform adequately compared to a traditional silicone-embedded electrode platform (silver contacts and wiring) in a porcine model. The main difference in performance between the two types of electrode array was in the recorded slow wave amplitude, which was approximately three times lower in the PCB array, and in the signal to noise ratio (SNR), which was approximately two times lower in the PCB array. Nevertheless, the slow waves recorded via the PCBs were readily characterized by the methods described in this article, and activation maps could be generated. PCB electrode arrays therefore provide an alternative to previously described electrode platforms for the HR mapping of GI slow wave activity.21,22
Flexible PCBs have a number of specific advantages over traditional epoxy-resin or silicone-embedded platforms. Once the design has been finalized, machine fabrication may be readily contracted to industrial suppliers, with only minimal further assembly required. Production is therefore rapid and economical in comparison to the many hours of specialized labor required to construct the previously used electrode platforms.2 Moreover, machine fabrication of the PCB electrode arrays conveys precise knowledge of the spatial distribution of repeatable recordings, whereas the precision of hand-built electrodes is highly dependent on the skill of the individual undertaking their manufacture. The advantage of highly reproducible arrays is particularly important when multiple electrode platforms are used simultaneously to map a large area. As shown in our validation study, this can be readily achieved using PCBs (>18 cm2 per PCB) by adjacent tessellation via Tegaderm of multiple recording heads while maintaining the same inter-electrode distance.
The greatest benefit of PCB platforms is their potential for use in the HR mapping of slow wave activity in human subjects which has not previously been attempted. Previously described platforms are suitable for work on animal models, 20,21 but are prone to retaining contaminated matter such as dried blood and tissue fluid in small depressions in the recording head, or recesses around joints. Trapped contaminated matter is a significant safety concern, as it can lead to transmission of infected diseases, even despite conscientious attention to sterilization practices.25 The materials used to construct and bond these traditional platforms are also prone to heat or moisture damage from the potentially harsh sterilization process. By contrast, the recording heads of PCBs are without depressions or manufacturing defects. Repeat sterilization and usage in pigs have shown that with careful attention to cleaning, they may be safely repeatedly sterilized by standard methods. PCB electrodes are also a potentially disposable option because they are economically mass-produced, with little additional time required for assembly.
High resolution mapping provides a highly detailed description of the initiation and propagation of slow wave activity.21,23 For example, HR mapping can reveal the complex mechanisms underlying slow wave dysrhythmias, such as re-entrant circuits, which previous sparse electrode measurements had failed to detect.23 However, HR mapping is an invasive investigation, requiring direct contact between electrodes and the serosal surface of target organs, and its application in the clinical setting is therefore limited. Research is ongoing into methods that can noninvasively describe GI electropathophysiology, namely electrograstrography (EGG),24,27 and magnetogastrography (MGG),4,33 which would have greater clinical utility. However, EGG and MGG presently lack the sensitivity required to adequately describe slow wave electropathophysiology, and the correlation between serosal slow wave activity and EGG and MGG recordings remains incompletely defined.9 HR mapping, using the methods described here, could help bridge the gap in understanding between non-invasive recordings and serosal slow wave behavior.
The validation study presented here has demonstrated an efficient method of characterizing GI slow wave activity. Porcine slow waves were quantified by amplitude and velocity, and the detailed spatiotemporal sequence of slow wave activation was characterized in the isochrones of the activation maps (Fig. 5). Results here suggest that slow wave propagation was in a broad wavefront, predominantly following the longitudinal axis of the stomach. There appears to be a directional difference in the velocity of slow waves also, as suggested in a previous study on guinea-stomach.31 Detailed slow wave characterization is essential for accurately describing normal and dysrhythmic slow wave behaviors.23 Accurately quantified slow wave parameters are also invaluable for aiding development and validation of computational models of GI electrical activity, an important tool for improving understanding in gastrointestinal electrophysiology. 5,8,9,18
The major disadvantage of the new PCB design is the lower SNR compared to the traditional electrode array. However, in practice this is not a critical issue, because the signals are still found to be of sufficient quality to readily characterize all of the desired attributes of slow wave activity. The lower SNR may be due to the different contact material (gold) that was used compared to the traditional silver-wire electrode arrays, and also may be because of the inferior shielding of the PCB and its connecting wires. Future work to improve the quality of slow wave signals recorded via PCB electrodes may include experimentation with different contact materials, including silver, and enhanced methods of shielding the electrode connections.
In conclusion, we have presented a validated methodology for recording, processing, and characterization of GI slow wave via PCB electrode arrays. We anticipate that in future PCB electrode arrays will be exploited to map steeply curved anatomical areas of interest, such as across the greater curvature of the stomach, which are not easily accessible to traditional stiff electrode platforms. They will also be an invaluable tool for the HR mapping of GI slow waves in human subjects.
ACKNOWLEDGMENT
This work is partially supported by Grants from the NIH (R01 DK64775), NZ Society of Gastroenterology, the NZ Health Research Council and the Auckland Medical Research Foundation. We thank Linley Nisbett for her assistance with the validation studies in this report.
REFERENCES
- 1. http://www.biosemi.com.
- 2. http://www.smoothmap.org.
- 3.Behm B, Stollman N. Postoperative ileus: etiologies and interventions. Clin. Gastroenterol. Hepatol. 2003;1:71–80. doi: 10.1053/cgh.2003.50012. doi:10.1053/cgh.2003.50012. [DOI] [PubMed] [Google Scholar]
- 4.Bradshaw LA, Irimia A, Sims JA, Gallucci MR, Palmer RL, Richards WO. Biomagnetic characterization of spatiotemporal parameters of the gastric slow wave. Neurogastroenterol Motil. 2006 Aug;18(8):619–31. doi: 10.1111/j.1365-2982.2006.00794.x. [DOI] [PubMed] [Google Scholar]
- 5.Buist ML, Cheng LK, Yassi R, Bradshaw LA, Richards WO, Pullan AJ. An anatomical model of the gastric system for producing bioelectric and biomagnetic fields. Physiol. Meas. 2004;25:849–861. doi: 10.1088/0967-3334/25/4/006. doi:10.1088/0967-3334/25/4/006. [DOI] [PubMed] [Google Scholar]
- 6.Chen CL, Lin HH, Huang LC, Huang SC, Liu TT. Electrogastrography differentiates reflux disease with or without dyspeptic symptoms. Dig. Dis. Sci. 2004;49:715–719. doi: 10.1023/b:ddas.0000030079.20501.62. doi:10.1023/B:DDAS.0000030079.20501.62. [DOI] [PubMed] [Google Scholar]
- 7.Chen JD, Lin Z, Pan J, McCallum RW. Abnormal gastric myoelectrical activity and delayed gastric emptying in patients with symptoms suggestive of gastroparesis. Dig. Dis. Sci. 1996;41:1538–1545. doi: 10.1007/BF02087897. doi:10.1007/BF02087897. [DOI] [PubMed] [Google Scholar]
- 8.Cheng LK, Buist ML, Pullan AJ. Anatomically realistic torso model for studying the relative decay of gastric electrical and magnetic fields. Conf. Proc. IEEE Eng. Med. Biol. Soc. 2006;1:3158–3161. doi: 10.1109/IEMBS.2006.260201. [DOI] [PubMed] [Google Scholar]
- 9.Cheng LK, O'Grady G, Du P, Egbuji JU, Windsor JA, Pullan AJ. Gastrointestinal system. Wiley Interdiscip Rev Syst Biol Med. 2010 Jan-Feb;2(1):65–79. doi: 10.1002/wsbm.19. [DOI] [PMC free article] [PubMed] [Google Scholar]
- 10.Chou CC, Zhou S, Tan AY, Hayashi H, Nihei M, Chen PS. High-density mapping of pulmonary veins and left atrium during ibutilide administration in a canine model of sustained atrial fibrillation. Am. J. Physiol. Heart Circ. Physiol. 2005;289:H2704–H2713. doi: 10.1152/ajpheart.00537.2005. doi:10.1152/ajpheart.00537.2005. [DOI] [PubMed] [Google Scholar]
- 11.Christensen J, Schedl HP, Clifton JA. The small intestinal basic electrical rhythm (slow wave) frequency gradient in normal men and in patients with variety of diseases. Gastroenterology. 1966;50:309–315. [PubMed] [Google Scholar]
- 12.Code CF, Szurszewski JH. The effect of duodenal and mid small bowel transection on the frequency gradient of the pacesetter potential in the canine small intestine. J. Physiol. 1970;207:281–289. doi: 10.1113/jphysiol.1970.sp009061. [DOI] [PMC free article] [PubMed] [Google Scholar]
- 13.Cucchiara S, Franzese A, Salvia G, Alfonsi L, Iula VD, Montisci A, Moreira FL. Gastric emptying delay and gastric electrical derangement in IDDM. Diabetes Care. 1998;21:438–443. doi: 10.2337/diacare.21.3.438. doi:10.2337/diacare.21.3.438. [DOI] [PubMed] [Google Scholar]
- 14.Farrugia G. Interstitial cells of Cajal in health and disease. Neurogastroenterol. Motil. 2008;20:54–63. doi: 10.1111/j.1365-2982.2008.01109.x. doi:10.1111/j.1365-2982.2008.01109.x. [DOI] [PubMed] [Google Scholar]
- 15.Hinder RA, Kelly KA. Human gastric pacesetter potential. Site of origin, spread, and response to gastric transection and proximal gastric vagotomy. Am. J. Surg. 1977;133:29–33. doi: 10.1016/0002-9610(77)90187-8. doi:10.1016/0002-9610(77)90187-8. [DOI] [PubMed] [Google Scholar]
- 16.Hocking MP, Vogel SB, Sninsky CA. Human gastric myoelectric activity and gastric emptying following gastric surgery and with pacing. Gastroenterology. 1992;103:1811–1816. doi: 10.1016/0016-5085(92)91439-b. [DOI] [PubMed] [Google Scholar]
- 17.Jalife J. Rotors and spiral waves in atrial fibrillation. J. Cardiovasc. Electrophysiol. 2003;14:776–780. doi: 10.1046/j.1540-8167.2003.03136.x. [DOI] [PubMed] [Google Scholar]
- 18.Komuro R, Cheng LK, Pullan AJ. Comparison and analysis of inter-subject variability of simulated magnetic activity generated from gastric electrical activity. Ann. Biomed. Eng. 2008;36:1049–1059. doi: 10.1007/s10439-008-9480-5. doi:10.1007/s10439-008-9480-5. [DOI] [PMC free article] [PubMed] [Google Scholar]
- 19.Konings KT, Kirchhof CJ, Smeets JR, Wellens HJ, Penn OC, Allessie MA. High-density mapping of electrically induced atrial fibrillation in humans. Circulation. 1994;89:1665–1680. doi: 10.1161/01.cir.89.4.1665. [DOI] [PubMed] [Google Scholar]
- 20.Lammers WJ, Stephen B. Origin and propagation of individual slow waves along the intact feline small intestine. Exp. Physiol. 2008;93:334–346. doi: 10.1113/expphysiol.2007.039180. doi:10.1113/expphysiol.2007.039180. [DOI] [PubMed] [Google Scholar]
- 21.Lammers WJ, Stephen B, Arafat K, Manefield GW. High resolution electrical mapping in the gastrointestinal system: initial results. Neurogastroenterol. Motil. 1996;8:207–216. doi: 10.1111/j.1365-2982.1996.tb00259.x. [DOI] [PubMed] [Google Scholar]
- 22.Lammers WJ, Ver Donck L, Schuurkes JA, Stephen B. Peripheral pacemakers and patterns of slow wave propagation in the canine small intestine in vivo. Can. J. Physiol. Pharmacol. 2005;83:1031–1043. doi: 10.1139/y05-084. doi:10.1139/y05-084. [DOI] [PubMed] [Google Scholar]
- 23.Lammers WJ, Ver Donck L, Stephen B, Smets D, Schuurkes JA. Focal activities and re-entrant propagations as mechanisms of gastric tachyarrhythmias. Gastroenterology. 2008;135:1601–1611. doi: 10.1053/j.gastro.2008.07.020. [DOI] [PubMed] [Google Scholar]
- 24.Levanon D, Chen JZ. Electrogastrography: its role in managing gastric disorders. J. Pediatr. Gastroenterol. Nutr. 1998;27:431–443. doi: 10.1097/00005176-199810000-00014. doi:10.1097/00005176-199810000-00014. [DOI] [PubMed] [Google Scholar]
- 25.Lewis S, McIndoe AK. Cleaning, disinfection and sterilization of equipment. Anaesth. Intens. Care Med. 2004;5:360–363. doi:10.1383/anes.5.11.360.53403. [Google Scholar]
- 26.Lin X, Chen JZ. Abnormal gastric slow waves in patients with functional dyspepsia assessed by multichannel electrogastrography. Am. J. Physiol. Gastrointest. Liver Physiol. 2001;280:G1370–G1375. doi: 10.1152/ajpgi.2001.280.6.G1370. [DOI] [PubMed] [Google Scholar]
- 27.McNearney T, Lin X, Shrestha J, Lisse J, Chen JD. Characterization of gastric myoelectrical rhythms in patients with systemic sclerosis using multichannel surface electrogastrography. Dig. Dis. Sci. 2002;47:690–698. doi: 10.1023/a:1014759109982. doi: 10.1023/A:1014759109982. [DOI] [PubMed] [Google Scholar]
- 28.Nash MP, Mourad A, Clayton RH, Sutton PM, Bradley CP, Hayward M, Paterson DJ, Taggart P. Evidence for multiple mechanisms in human ventricular fibrillation. Circulation. 2006;114:536–542. doi: 10.1161/CIRCULATIONAHA.105.602870. doi:10.1161/CIRCULATIONAHA.105.602870. [DOI] [PubMed] [Google Scholar]
- 29.Ordog T, Redelman D, Horvath VJ, Miller LJ, Horowitz B, Sanders KM. Quantitative analysis by flow cytometry of interstitial cells of Cajal, pacemakers, and mediators of neurotransmission in the gastrointestinal tract. Cytometry A. 2004;62:139–149. doi: 10.1002/cyto.a.20078. doi:10.1002/cyto.a.20078. [DOI] [PubMed] [Google Scholar]
- 30.Shenasa M, Borggrefe M, Breithardt G. Cardiac Mapping. Futura Press; New York: 2003. [Google Scholar]
- 31.Nakayama S, Shimono K, Liu H-N, Jiko H, Katayama N, Tomita T, Goto K. Pacemaker phase shift in the absence of neural activity in guinea-pig stomach: a microelectrode array study. J. Physiol. 2006;576:727–738. doi: 10.1113/jphysiol.2006.118893. doi:10.1113/jphysiol.2006.118893. [DOI] [PMC free article] [PubMed] [Google Scholar]
- 32.Sih HJ, Berbari EJ. Cardiac Mapping. Futura Press; New York: 2003. Chapter 3: Methodology of Cardiac Mapping. [Google Scholar]
- 33.Turnbull GK, Ritcey SP, Stroink G, Brandts B, van Leeuwen P. Spatial and temporal variations in the magnetic fields produced by human gastrointestinal activity. Med Biol Eng Comput. 1999 Sep;37(5):549–54. doi: 10.1007/BF02513347. [DOI] [PubMed] [Google Scholar]
- 34.Vittal H, Farrugia G, Gomez G, Pasricha PJ. Mechanisms of disease: the pathological basis of gastroparesis—a review of experimental and clinical studies. Nat. Clin. Pract. Gastroenterol. Hepatol. 2007;4:336–346. doi: 10.1038/ncpgasthep0838. doi: 10.1038/ncpgasthep0838. [DOI] [PubMed] [Google Scholar]
- 35.Yang C, Fang Z, Wu X, Lou A, Lu J. World Congress on Medical Physics and Biomedical Engineering. Springer; Berlin, Heidelberg: 2007. Dynamic 3D epicardial mapping of whole-atrium. pp. 894–897. [Google Scholar]
- 36.Zhou S, Chang CM, Wu TJ, Miyauchi Y, Okuyama Y, Park AM, Hamabe A, Omichi C, Hayashi H, Brodsky LA, Mandel WJ, Ting CT, Fishbein MC, Karagueuzian HS, Chen PS. Nonreentrant focal activations in pulmonary veins in canine model of sustained atrial fibrillation. Am. J. Physiol. Heart Circ. Physiol. 2002;283:H1244–H1252. doi: 10.1152/ajpheart.01109.2001. [DOI] [PubMed] [Google Scholar]
- 37.Zhou T, Lu W, Yang C, Fang Z. A visual expression to show epicardial electrical activity comprehensively. In: Bioinformatics and Biomedical Engineering, 2008.. ICBBE 2008. The 2nd International Conference on 16–18 May 2008.pp. 808–811. [Google Scholar]