

Abstract
High-fat diet (HFD) and inflammation are key contributors to insulin resistance and type 2 diabetes (T2D). Interleukin (IL)-1β plays a role in insulin resistance; yet, how IL-1β is induced by fatty acid with HFD, and how this alters insulin signaling is unclear. We show that the saturated fatty acid, palmitate, but not unsaturated oleate, induces the activation of NLRP3-PYCARD inflammasome, causing caspase-1, IL-1β, and IL-18 production. This involves mitochondrial reactive oxygen species and the AMP-activated protein kinase and ULK1 autophagy signaling cascade. Inflammasome activation in hematopoietic cells impairs insulin signaling in several target tissues to reduce glucose tolerance and insulin sensitivity. Furthermore, IL-1β affects insulin sensitivity via TNF-independent and dependent pathways. These findings provide insights into the association of inflammation, diet and T2D.
The incidence of type 2 diabetes (T2D) worldwide has increased dramatically and constitutes one of the major threats to global health. Insulin resistance, a hallmark of T2D, is associated with low-grade systemic inflammation characterized by upregulated cytokine production and activated inflammatory signaling pathways 1. Interleukin (IL)-1β is one of the major inflammatory cytokines implicated in both type 1 diabetes (T1D) and T2D. IL-1β mediates β-cell destruction leading to T1D 2 and is a risk factor for T2D 3 by inducing insulin resistance in insulin-sensitive cells 4, 5. Two recent clinical studies reported protective roles of either IL-1 receptor antagonist (IL-1ra) or IL-1β antibody in treating T2D 6, 7.
Despite evidence for the role of inflammatory mediators in insulin resistance, less is known about how these inflammatory mediators are generated. Recent studies implicate high levels of glucose 8 and islet amyloid polypeptide (IAPP) 9 as key inducers of IL-1β generation and NLRP3 (NLR pyrin domain containing 3) 10 inflammasome activation within the pancreas. However, IL-1β-induced islet β-cell dysfunction and apoptosis result after disease has already progressed from an initial insulin resistance condition to T2D 11. Therefore, these studies cannot explain how IL-1β is generated during the early insulin resistance phase before T2D occurs.
The consumption of a high-fat diet (HFD) is an important contributing factor to T2D. Since free fatty acids (FFAs) in plasma are elevated in T2D patients as well as diabetic animals 12, FFAs have been proposed to promote inflammatory responses by directly engaging toll-like receptors (TLR) and inducing NF-κB-dependent production of inflammatory cytokines such as TNF and IL-6 13, 14. In addition to TLRs, members of the NLR family play important roles in both innate and adaptive immunity, but their roles in response to FFAs have not been investigated 15. Several NLR molecules including NLRP3, along with apoptotic speck protein containing a caspase recruitment domain (ASC; also called PYCARD) and procaspase-1, form molecular platforms called the inflammasome, which mediates the catalytic activation of caspase-1, followed by the cleavage and release of proinflammatory cytokines IL-1β and IL-18 16, 17. Inflammasome activators include certain pathogens, endogenous markers of cellular damage (ATP and uric acid), and exogenous stress-inducing reagents (alum, asbestos and silica). In this study, we tested the working model in which FFA activates inflammasome-dependent IL-1β secretion from myeloid cells, and whether this IL-1β release impairs the physiological functions of insulin in multiple insulin target organs.
Results
Palmitate activates the NLRP3-PYCARD inflammasome
The production of mature caspase-1 that is necessary for the processing and production of IL-1β and IL-18 requires two signals: first, the transcription and translation of pro-IL-β and pro-IL-18 can be achieved by priming macrophages with a number of stimuli, including lipopolysaccharide (LPS) (Supplementary Fig. 1). A second signal is required to activate the inflammasome to cause the autocatalytic cleavage of procaspase-1 to caspase-1. Palmitate (PA) is one of the most abundant saturated fatty acids in plasma and is significantly elevated following a HFD 12. We tested if PA could serve as the second signal by exposing cells to LPS and then to PA conjugated with fatty acid-free bovine serum albumin (PA-BSA). This conjugation is needed to increase PA solubility. PA-BSA, but not BSA, induced IL-1β from wild-type (WT) bone marrow-derived macrophages (BMMs) (Fig. 1a). Without LPS, PA-BSA-treated macrophages did not induce IL-1β supporting the two-signal hypothesis of inflammasome activation. PA-BSA-induced IL-1β and IL-18 secretion was also dose-dependent (Fig. 1b, c). In contrast to IL-1β, IL-6 production was not significantly increased by PA-BSA (Fig. 1d), indicating specificity of the PA effect 18. PA-BSA failed to induce IL-1β or IL-18 in Nlrp3 (Nlrp3−/−), Pycard (Pycard−/−) or caspase-1 (Casp1−/−) deficient macrophages, while another NLR gene, Nlrc4, had no effect (Fig. 1e, f). Peritoneal macrophages and bone marrow-derived dendritic cells (BMDC) produced a similar outcome (Supplementary Fig. 2). The pan-caspase inhibitor zVAD or caspase-1 specific inhibitor zYVAD abolished PA-BSA-induced IL-1β release (Fig. 1g) and caspase-1 deficient (Casp1−/−) cells did not produce IL-1β in response to PA-BSA (Fig. 1h). In contrast to IL-1β release upon PA stimulation, TNF production by WT, Nlrp3−/−, Pycard−/− or Casp1−/− macrophages was indistinguishable (Fig. 1i).
Figure 1.
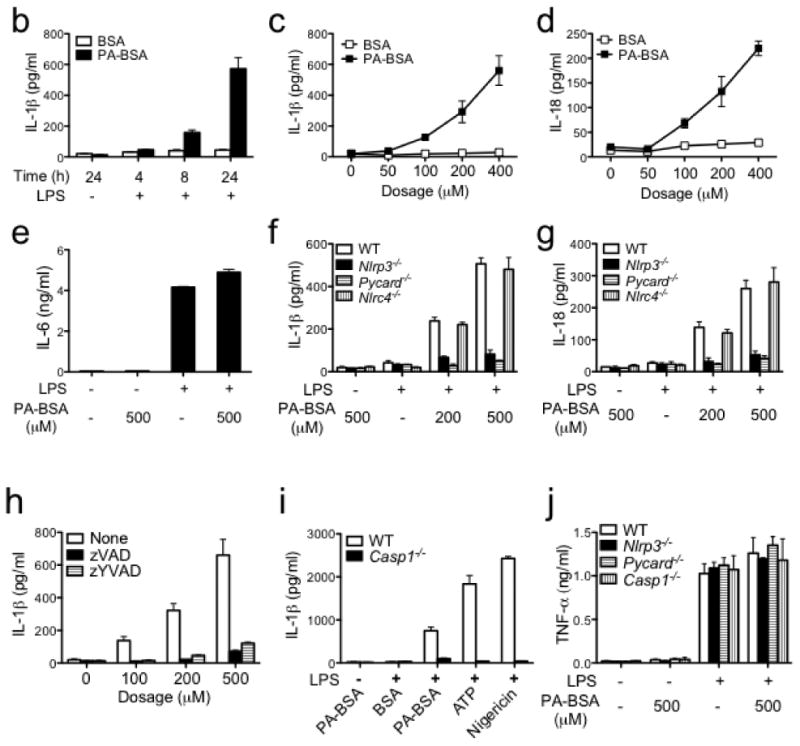
Palmitate activates NLRP3-PYCARD inflammasome. (a-d) Resting or LPS-primed bone marrow-derived macrophages (BMMs) were stimulated with palmitate conjugated with BSA (PA-BSA) or BSA control as indicated. ELISA was performed for IL-1β (b, c), IL-18 (d) and IL-6 (e) in supernatants. (e, f) Resting or LPS-primed BMM generated from WT, Nlrp3−/−, Pycard−/− or Nlrc4−/− mice were stimulated with PA-BSA as indicated. (g) IL-1β ELISA of supernatants from LPS-primed BMM stimulated with PA-BSA in the absence or presence of the pan-caspase inhibitor zVAD (10 μM) or caspase-1 inhibitor zYVAD (10 μM). (h) Resting or LPS-primed BMM generated from WT or Casp1−/− mice were stimulated with PA-BSA, BSA control, ATP (2 mM) or nigericin (5 μM). (i) Resting or LPS-primed BMM generated from WT, Nlrp3−/−, Pycard−/− or Casp1−/− mice were stimulated with PA-BSA as indicated. Values in a-i are expressed as mean ± s.d., and the results are representative of three independent experiments.
To biochemically assess inflammasome activation, the cleavage maturation of pro-IL-1β and procaspase-1 was assayed by immunoblot analysis. LPS or PA-BSA alone did not cause procaspase-1 and pro-IL-1β processing to their mature forms, but the two combined did (Fig. 2a). Mature IL-1β and caspase-1 were not observed in Nlrp3−/− and Pycard−/− BMMs (Fig. 2a), but were observed in Nlrc4−/− cells (Fig. 2b). These results indicate that PA-induced inflammasome is dependent on NLRP3 and PYCARD. To determine the effect of unsaturated fatty acid, WT BMMs were treated with LPS followed by 0.5 mM oleate to match the dosage of PA used. IL-1β, IL-6 and TNF were not enhanced by LPS plus oleate (Supplementary Fig. 3).
Figure 2.
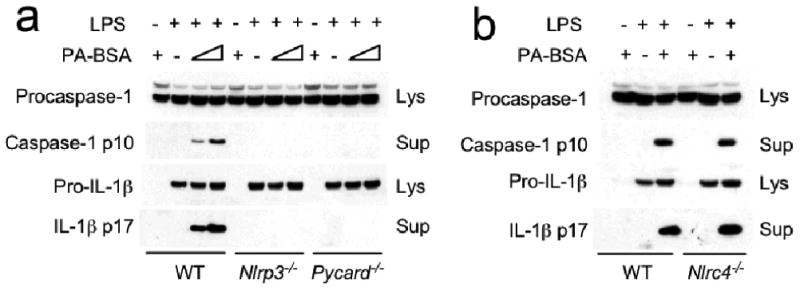
Palmitate induces IL-1β and caspase-1 processing, which is dependent on NLRP3 and PYCARD. Resting or LPS-primed BMM generated from WT, Nlrp3−/−, Pycard−/− (a,) or Nlrc4−/− (b) mice were stimulated with PA-BSA (0.5 mM) as indicated. Immunoblotting for caspase-1 and IL-1β were performed in supernatants (Sup) and cell lysates (Lys) as indicated. Data are representative of two independent experiments.
Inflammasome activation involves AMPK-ROS signaling
Reactive oxygen species (ROS) has an essential role in inflammasome activation 17. Treatment of macrophages with PA-BSA and LPS also induced ROS activation, and this was inhibited by (2R,4R)-4-aminopyrrolidine-2,4-dicarboxylate (APDC), a ROS inhibitor (Fig. 3a). APDC also inhibited PA-BSA induced IL-1β release (Fig. 3b) and caspase or IL-1β cleavage (Fig. 3c) in a dose-dependent manner as assessed by ELISA and immunoblot analysis. Another ROS inhibitor, N-acetyl-cysteine (NAC), and an NAPDH oxidase inhibitor, diphenylene iodonium (DPI), also inhibited IL-1β secretion in response to LPS plus PA-BSA (Fig. 3d).
Figure 3.
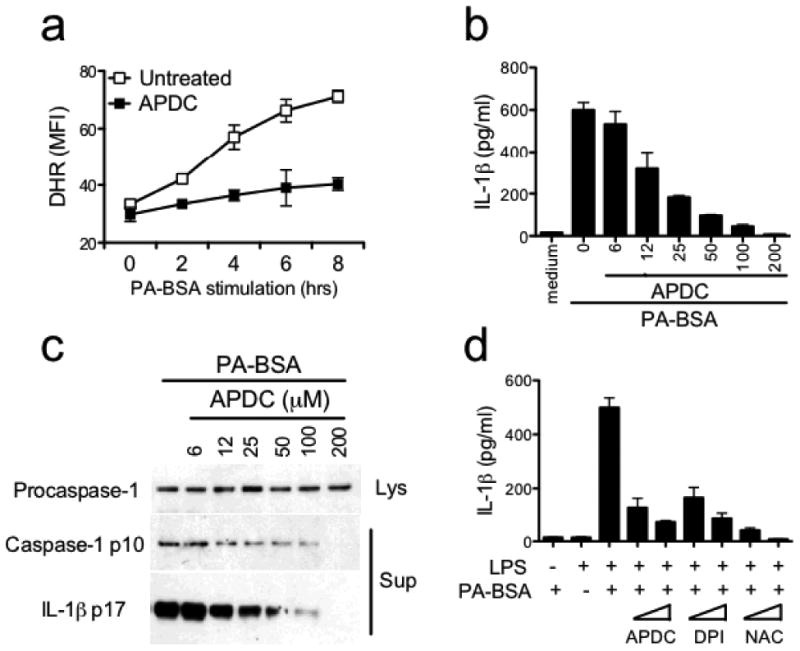
Palmitate-induced inflammasome activation requires ROS. (a) LPS-primed BMMs were stimulated with PA-BSA (0.5 mM) in the absence or presence of ROS inhibitor APDC (50 μM). ROS production was determined by flow cytometry using the fluoroprobe dihydrorhodamine 123 (DHR). (b, c) LPS-primed BMM were stimulated with PA-BSA in the absence or presence of increasing concentrations of APDC as indicated. ELISA for IL-1β (b) and immunoblotting for caspase-1 p10 and IL-1β p17 (c) were performed. (d) Resting or LPS-primed BMM were stimulated with PA-BSA (0.5 mM) in the absence or presence of ROS inhibitors such as APDC (10 or 50 μM) and NAC (5 or 25 mM), or NAPDH oxidase inhibitor DPI (5 or 25 μM). ELISA for IL-1β was performed. In a, one of two independent experiments is shown. In each of b-d, the results are representative of three independent experiments.
The adenosine monophosphate-activated protein kinase (AMPK) has emerged as an essential mediator of fatty acid metabolism 19, and it suppresses ROS production by inhibiting the expression and function of nicotinamide adenine dinucleotide phosphate (NADPH) oxidase 20. AMPK has also been shown to play an anti-inflammatory role in macrophages 21. Thus we tested if AMPK played a role during inflammasome activation by PA. We first assessed AMPK activation upon dual treatment of macrophages with PA-BSA and LPS. PA-BSA or LPS alone had little effect, while the two together decreased phosphorylation of the AMPK α subunit (Fig. 4a). To assess if reduced AMPK activity leads to ROS generation, AMPK activity was enhanced with a widely used pharmacological AMPK activator, 5-aminoimidazole-4-carboxamide ribonucleoside (AICAR) 21. AICAR reduced PA-BSA and LPS-induced ROS generation (Fig. 4b), suggesting that AMPK negatively controls ROS levels downstream of PA-BSA and LPS treatment.
Figure 4.
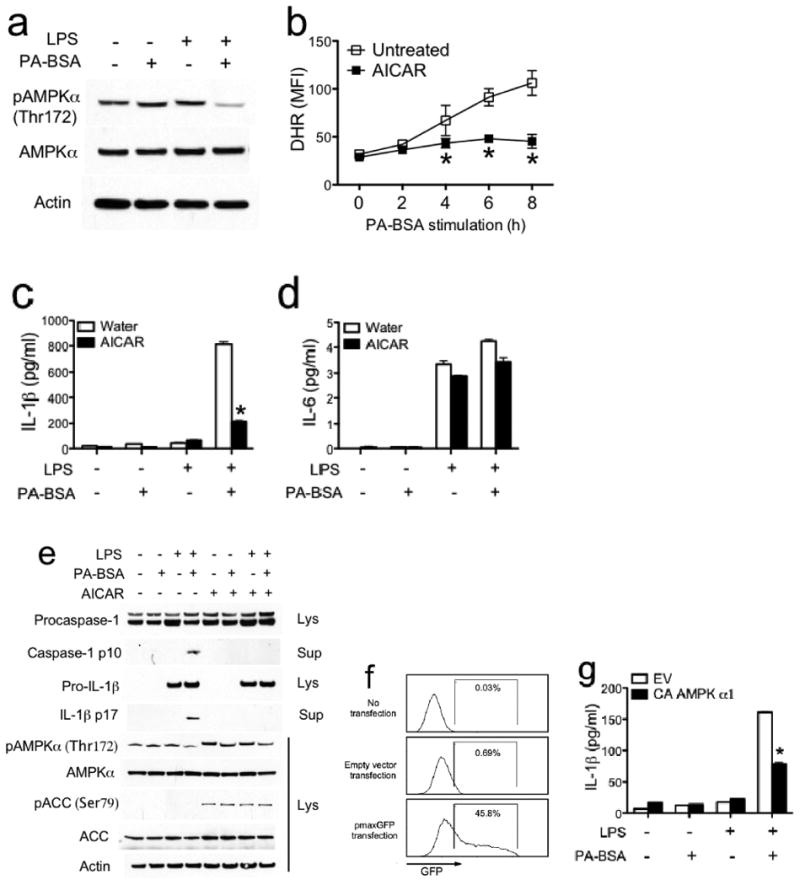
Palmitate-induced inflammasome activation involves AMPK. (a) Resting or LPS-primed BMM were untreated or stimulated with PA-BSA (0.5 mM) for 24 hrs. Phospho- (Thr172) and total AMPK α subunit was determined by immunoblotting. (b-e) LPS-primed BMM were stimulated with PA-BSA (0.5 mM) in the absence or presence of AMPK agonist AICAR (100 μM). ROS production was determined using the fluoroprobe dihydrorhodamine 123 (DHR) (b). IL-1β (c) and IL-6 (d) in supernatants were measured by ELISA. Immunoblotting for caspase-1, IL-1β and AMPK signaling molecules were performed (e). (f, g) BMM were transfected with empty vector (EV), or constitutively active (CA) AMPK α1 subunit. Sixteen hours later, the transfection efficiency was determined by flow cytometric analysis of GFP expression in macrophages cotransfected with CA α1 AMPK and pmaxGFP (f). Cells were stimulated with PA-BSA (0.5 mM) for 24 hrs. ELISA was performed for IL-1β in supernatants (g). In each of a, b and f, one of two independent experiments is shown. In each of c-e and g, the results are representative of three independent experiments. * P < 0.05, versus controls.
Since ROS was required for inflammasome activation by PA (Fig. 3), and AMPK reduced PA-induced ROS generation, we next tested if AMPK played a role in PA-induced inflammasome activation. AICAR significantly decreased PA-induced IL-1β release (Fig. 4c), without affecting the levels of IL-6 (Fig. 4d). In agreement with the latter observation, the concentration of AICAR used did not cause cytotoxicity (not shown). Immunoblot analyses showed that AICAR reduced the processing of pro-caspase-1 and pro-IL-1β (Fig. 4e). Samples treated with AICAR showed enhanced phosphorylation of acetyl CoA carboxylase (ACC), a well-defined substrate of AMPK, at Ser79, indicating that AICAR had the expected effect on the AMPK pathway.
As an alternate to the pharmacological approach to analyze AMPK, macrophages were transfected with a constitutively active (CA) α1 subunit of AMPK 22. In agreement with the observation of others that primary macrophages were difficult to transfect, only 46% of the BMM were transfected as determined by the expression of the green fluorescent protein (GFP) encoded by a plasmid (Fig. 4f). Despite this suboptimal level of transfection efficiency, introduction of CA-AMPK α1 decreased IL-1β secretion by 50% (Fig. 4g). Together, these findings reveal an AMPK-ROS signaling axis that regulates NLRP3-PYCARD-caspase-1 inflammasome activation in response to PA stimulation.
In contrast to a role for AMPK in suppressing PA-BSA-induced IL-1β production, activation of AMPK with AICAR did not affect IL-1β release in the presence of ATP, nigericin or alum, suggesting a specific role of AMPK inactivity in PA-mediated inflammasome activation (Supplementary Fig. 4a). AICAR also did not affect IL-6 production in response to these same activators (Supplementary Fig. 4b). We further tested the role of previously identified factors that activate the NLRP3 inflammasome during PA treatment 17. Potassium (K+) efflux is an important upstream step for NLRP3 inflammasome activation 17. In the presence of high K+ 23, PA-induced IL-1β release was completely abolished, suggesting K+ efflux is needed for PA-induced inflammasome activation (Supplementary Fig. 4c). In contrast, the actin polymerization inhibitor cytochalasin D which affects phagocytosis, abolished IL-1β release stimulated by alum 23, but not by PA (Supplementary Fig. 4d). Lysosome inhibitors (bafilomycin A, chloroquine and ammonium chloride) attenuated IL-1β release induced by the bacterium Francisella tularensis 24, but not by PA (Supplementary Fig. 4e, f). Deficiency in ATP receptor P2X7R abolished ATP-induced IL-1β release, but did not affect PA-induced IL-1β release (Supplementary Fig. 4g). Therefore, PA-induced inflammasome activation involves potassium efflux, but not a cytochalasin D-sensitive, lysosomal pathway or P2X7R.
PA affects autophagy and mitochondrial ROS via AMPK
Our results indicate that PA-induced inflammasome exhibits several features that are distinct from inflammasome activation by pathogens or damage-associated molecular patterns (DAMPs) and uniquely utilizes the AMPK pathway. Thus we further explored the mechanism of inflammasome activation that lies downstream of decreased AMPK phosphorylation and activity during PA plus LPS treatment. Recent studies of the inflammasome in myeloid cells suggest that inhibition of autophagy by pharmacological inhibitor or autophagy-related gene deletion results in mitochondrial ROS generation that activates the NLRP3 inflammasome 25, 26. Studies in fatty acid metabolism in non-immune cells identified AMPK as a positive regulator of autophagy which directly phosphorylates and activates unc-51-like kinase 1 (ULK1), the mammalian homologue of autophagy-related 1 (Atg1) 27, 28, which is essential for autophagosome formation 29. Blockage of autophagy during metabolism can lead to increased ROS. Thus ROS activation and autophagy are similarly evoked in both inflammasome activation in myeloid cells and fatty acid metabolism in non-immune cells. The following experiments assessed if fatty acid affected autophagy and mitochondrial ROS in macrophages, which would be expected to cause inflamamsome activation, and whether AMPK regulated these two events.
We first tested if reduced AMPK activity caused by PA plus LPS treatment led to attenuated autophagy and mitochondrial ROS generation. During autophagy, light chain 3 (LC3) is converted from a cytosolic form (LC3-I) to a lapidated, membrane-associated form (LC3-II) and displays a punctate appearance 30. We measured autophagosome formation by monitoring LC3B conversion by immunoblot, punctate appearance by immunofluoresence staining, and direct observation of autophagosomes by transmission electron microscopy (TEM). LC3B-II was normalized to β-actin as the preferred way of measuring autophagy 30. LPS treatment increased LC3B-II level relative to β-actin (Fig. 5a), promoted endogenous LC3B punctate staining (Fig. 5b), and resulted in more autophagosomes (Fig. 5c), indicating that LPS induced autophagy, in agreement with a previous study 31. In contrast, LPS-enhanced autophagosome formation was reversed by PA treatment (Fig. 5a-c). Chloroquine, a widely used protease inhibitor, could not restore PA-decreased LC3B-II level (Fig. 5a), suggesting that PA-decreased autophagic activity is due to a decreased autophagosome synthesis, but not an increased degradation of autophagic substrates inside the autolysosome 29.
Figure 5.

Palmitate-induced AMPK inactivation leads to defective autophagy and the generation of mitochondrial ROS. (a) BMMs were pretreated with LPS (200 ng/ml) for 3 hrs, followed by PA-BSA (0.5 mM) treatment for 24 hrs in the absence or presence of chloroquine (50 μM). Immunoblotting for AMPK activation (AMPKα pThr172) and LC3B were performed. Densitometric analysis was performed to quantify LC3B-II to actin ratio. (b, c) BMMs were pretreated with LPS for 3 hrs, followed by PA-BSA treatment for 24 hrs in the absence or presence of AICAR (100 μM). Cells were fixed and stained for LC3B (b). Quantitation of autophagosomes was performed by counting LC3B puncta in 100 cells. Cells were fixed and examined by transmission electron microscopy for autophagosmes (c). Quantitation is based on counting autophagosomes in 10 cells per treatment. (d, e) BMMs were stimulated as indicated. Immunoblotting were performed. Densitometric analysis was performed to quantify LC3B-II/actin and ULK1 species (d). Mitochondrial ROS production was determined using the MitoSOX fluorescence indicator (e). In each of a and e, one of three independent experiments is shown. In each of b and d, one of two independent experiments is shown. * P < 0.05, versus controls.
Since reduction of LC3B-II upon LPS plus PA stimulation was accompanied by decreased phosphorylation of AMPK α subunit (Fig. 5a), we determined whether AMPK regulated autophagic activity. AICAR, which enhanced the phosphorylation of AMPK and its downstream target molecule ACC (Fig. 4e, 5d), increased the punctate appearance of LC3B (Fig. 5b), and the number of autophagosomes (Fig. 5c). It also induced the phosphorylation of ULK1 at serine-467 and serine-555 (Fig. 5d), consistent with recent discovery in non-immune cell types 27. Importantly, AICAR restored the amount of LC3B-II protein (Fig. 5d). Therefore, PA-induced AMPK inactivation is associated with decreased autophagic activity marked by decreased LC3B-II levels, reduced LC3B punctation and the number of autophagosomes, and reduced ULK1 phosphorylation, all of which could be rescued by the addition of the AMPK agonist, AICAR.
We next assessed if PA signaling through AMPK leads to the accumulation of mitochondrial ROS, which can activate the NLRP3 inflammasome 25, 26. Treatment of BMMs with LPS plus PA significantly increased mitochondrial ROS as evidenced by MitoSox staining, and this was abolished by the AMPK agonist AICAR (Fig. 5e). These data together suggest that PA+LPS inhibited AMPK, which then blocked autophagy but enhanced mitochondrial ROS, both of which are linked to inflammasome activation.
PA-induced IL-1β impairs insulin signaling in vitro
Clinical studies of T2D suggest that elevated free fatty acids and IL-1β in the plasma promote insulin resistance 32, 33. Therefore, we first sought to determine whether PA-induced NLRP3-PYCARD inflammasome-dependent IL-1β production inhibited insulin signaling in vitro. Since the liver is one of the major target organs of insulin, we used FL38B, a mouse liver cell line 34, to test insulin signaling in vitro as reflected by the phosphorylation of Akt. Both phospho-flow cytometric (Fig. 6a) and immunoblot (Fig. 6b) analyses using an antibody against phorphorylated Akt showed that IL-1β treatment significantly dampened insulin-induced Akt phosphorylation (Fig. 6a, b). TNF is another proinflammatory cytokine that plays an essential role in obesity-associated chronic inflammation and insulin resistance 35, 36. Indeed, TNF treatment decreased insulin-induced Akt phosphorylation to a comparable extent as IL-1β (Fig. 6b). Both TNF and IL-1β significantly enhanced the phosphorylation of insulin receptor substrate-1 (IRS1) at serine 307 (Fig. 6c), a modification that has been shown to inhibit insulin-induced PI3K-Akt activation, resulting in insulin resistance 35. These findings suggest that both TNF and IL-1β inhibit insulin signaling in an in vitro culture system.
Figure 6.
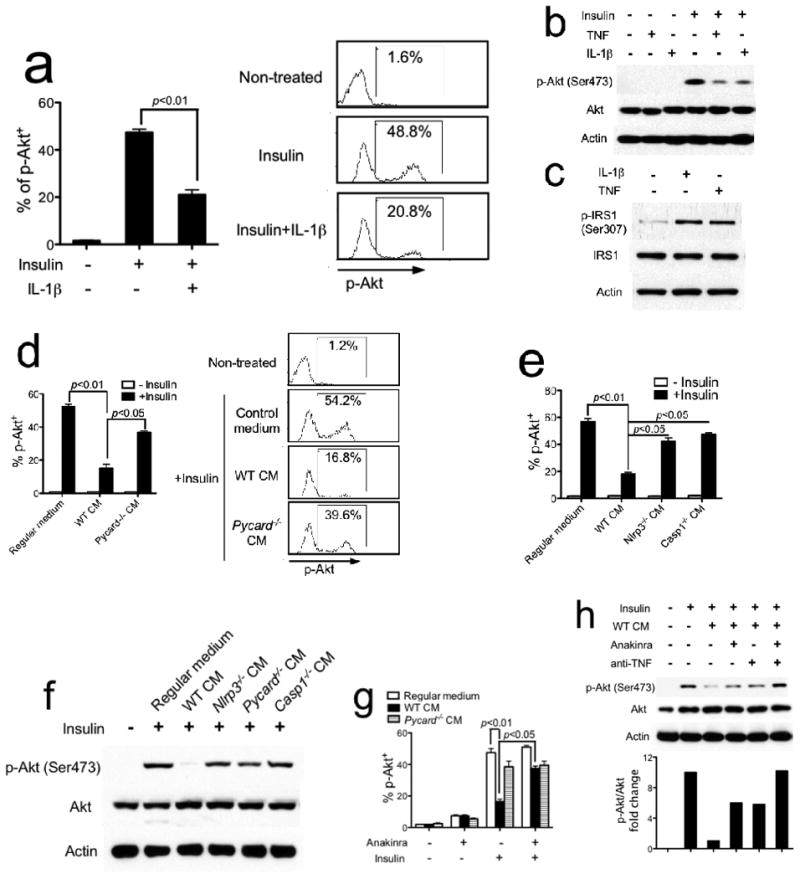
Inflammasome-generated IL-1β inhibits insulin signaling in vitro. (a, b) FL83B mouse liver cells were pretreated with mouse recombinant IL-1β (2 ng/ml) (a) or TNF (2 ng/ml) (b) for 24 hrs, then stimulated with insulin (200 nM) for 10 min. Phospho-Akt (Ser473) was determined by flow cytometry with quantification shown in the graph at left (a). Phospho-Akt (Ser473) was determined by immunoblotting (b). (c) FL83B mouse liver cells were treated with either IL-1β or TNF for 24 hrs. Phospho-IRS1 (Ser307) was determined by immunoblotting. (d-f) FL83B cells (d, e) or WT primary hepatocytes (f) were pretreated with conditioned medium (CM) generated from WT, Pycard−/− (d), Nlrp3−/− or Casp1−/− (e) macrophages for 24 hrs, then stimulated with insulin. (g) FL83B cells were pretreated with WT or Pycard−/− CM in the absence or presence of IL-1R antagonist anakinra (1 μg/ml) for 24 hrs, then stimulated with insulin. (h) FL83B cells were pretreated with WT CM in the absence or presence of either IL-1R antagonist anakinra or neutralizing anti-TNF antibody. Phospho-Akt (Ser473) was analyzed by immunoblotting and quantified by densitometric analysis. The results shown are representative of three independent experiments and are expressed as mean ± s.d..
To assess the link between NLRP3-PYCARD-caspase-1 inflammasome and insulin signaling, we stimulated LPS-primed WT, Nlrp3−/−, Pycard−/− or Casp1−/− BMMs with PA and collected the supernatant (labeled as CM for conditioned medium, Fig. 6d, e). Treatment of FL38B cells with CM generated from WT BMMs significantly inhibited insulin-induced Akt phosphorylation. However, Nlrp3−/−, Pycard−/− or Casp1−/− CM did not significantly affect insulin-induced Akt phosphorylation, suggesting that NLRP3-PYCARD-dependent soluble factor(s) impaired insulin signaling (Fig. 6d, e). We also observed the same effects as described above when primary hepatocytes isolated from WT mice were used as insulin target cells (Fig. 6f). To assess if the soluble factor in WT CM was IL-1β, Anakinra, an IL-1R antagonist of IL-1 function, was added to WT CM. Anakinra restored insulin signaling as measured by Akt phosphorylation, indicating that IL-1β did contribute to the inhibition of insulin signaling (Fig. 6g). Since Nlrp3−/−, Pycard−/− or Casp1−/− CM did not completely restore insulin-induced Akt phosphorylation, we hypothesized that TNF, which is present in Nlrp3−/−, Pycard−/− or Casp1−/− CM (Fig. 1i), also played a role in inhibiting insulin signaling as shown in Fig. 6b, c. Indeed, whereas blocking either IL-1β by anakinra or TNF by a neutralizing antibody partially restored insulin-induced Akt phosphorylation, blocking both IL-1β and TNF completely restored insulin-induced Akt phosphorylation, indicating that both of these cytokines inhibit insulin signaling (Fig. 6h).
IL-1β and TNF cooperatively mediate insulin resistance
To assess the role of IL-1β in vivo, mice were subjected to IL-1β injection, which decreased insulin sensitivity (Fig. 7a). Meanwhile, IL-1β null (Il1b−/−) mice fed with a HFD for 12 weeks did not exhibit insulin resistance (Fig. 7b). These results indicate an important role of IL-1β in the development of insulin resistance in response to HFD. Based on the observation that both IL-1β and TNF impaired insulin signaling in vitro (Fig. 6), it is important to determine the individual effect of these two cytokines in insulin resistance in vivo. Administration of exogenous IL-1β (1 μg/kg body weight) elevated serum concentration of IL-1β as expected, and this was comparable between WT and Tnfa−/− mice (Fig. 7d, left). Administration of IL-1β also elevated serum TNF level in WT mice, in agreement with the known induction of TNF by IL-1β, but it did not elevate TNF in Tnfa−/− mice as expected (Fig. 7d, right). In parallel, IL-1β administration induced more severe insulin resistance in WT mice than in similarly treated Tnfa−/− mice (Fig. 7c). These results suggest that the absence of elevated TNF in Tnfa−/− mice partially improved insulin sensitivity during IL-1β administration. However IL-1β also exerts TNF-independent effects to promote insulin resistance.
Figure 7.

IL-1β and TNF cooperatively mediate insulin resistance in vivo. (a) Eight-week old male C57BL/6 mice were intraperitoneally injected with saline or mouse recombinant IL-1β (1 μg/kg). Insulin tolerance test (ITT) was performed at 2 hrs after IL-1β injection. (b) ITT in WT mice on regular diet (RD) or high-fat diet (HFD) for 12 weeks, or Il1b−/− mice on HFD for 12 weeks. (c, d) Recombinant mouse IL-1β was administrated into WT and Tnfa−/− mice (n=5 for each group). ITT was performed at 2 hrs after IL-1β injection (c). Serum levels of IL-1β (d, left) and TNF (d, right) at 2 hrs after IL-1β injection were determined by ELISA. One of two independent experiments is shown (mean ± s.d.). * P < 0.05, versus controls.
NLRP3 Inflammasome promotes insulin resistance in vivo
As an ultimate test, we determined whether the NLRP3-PYCARD-dependent IL-1β production contributed to insulin resistance in vivo. Blood glucose and insulin levels were measured after HFD feeding for 12 weeks. In the fed state, blood glucose (Fig. 8a, left panel) and insulin levels (Fig. 8a, right panel) were significantly lower in Nlrp3−/− or Pycard−/− mice than WT mice, suggesting that the absence of inflammasome components led to improved maintenance of glucose homeostasis and increased insulin sensitivity, respectively. Glucose tolerance tests (GTT) and insulin tolerance tests (ITT) revealed that after regular diet (RD) feeding, glucose metabolism and insulin sensitivity were similar in WT, Nlrp3−/− and Pycard−/− mice (Supplementary Fig. 5). However, after HFD feeding for 12 weeks, a significant improvement in glucose metabolism and insulin sensitivity was observed in Nlrp3−/− (Fig. 8b, c) and Pycard−/− mice (Fig. 8d, e). To assess if the insulin resistance effect of the inflammasome was attributed to the bone marrow or stromal compartment, bone marrow chimera experiments were conducted. These results showed that lethally irradiated WT or Pycard−/− hosts receiving Pycard−/− bone marrow cells exhibited more insulin sensitivity compared to those receiving WT bone marrow cells after HFD feeding for 12 weeks (Fig. 8f). Together, these findings support the initial working model shown in Supplementary Fig. 1 that inflammasome activation in the hematopoietic compartment impairs insulin signaling in insulin target cells through NLRP3-PYCARD.
Figure 8.

The NLRP3-PYCARD inflammasome promotes insulin resistance in vivo. (a) Blood glucose and insulin levels were measured in WT (n=6), Nlrp3−/− (n=5) or Pycard−/− (n=6) mice under fasting or re-fed conditions after HFD feeding for 12 weeks. (b-e) Glucose tolerance test (GTT) (b, d) and insulin tolerance test (ITT) (c, e) were performed for WT, Nlrp3−/− (b, c) and Pycard−/− (d, e) mice on HFD for 12 weeks. (f) GTT was conducted on the indicated bone marrow chimeric mice on HFD for 12 weeks. (g, h) Insulin-stimulated phosphorylation of IRβ, IRS1 and Akt (Ser473) in liver tissues of individual WT and Pycard−/− mice (g), and phospho-Akt (Ser473) in liver, white adipose (WAT) and muscle tissues of individual WT and Nlrp3−/− mice (h) on HFD for 12 weeks after insulin (2 IU/kg body weight) infusion. Graphs at right of blots show the quantitation of each molecule. (i, j) Expression of Tnfa and Mcp1 mRNA relative to Actb in liver tissues of Nlrp3−/− mice (i) and Pycard−/− mice (j) on RD or HFD for 12 weeks. One of two independent experiments is shown (mean ± s.d.). * P < 0.05, versus controls.
We next examined the effect of inflammasome on insulin receptor signaling in the three key insulin target tissues, liver, adipose and muscle. Tissues were obtained from mice following insulin administration to assess insulin-induced phosphorylation of insulin receptor (IRβ), insulin receptor substrate-1 (IRS1) and more distally Akt. Pycard−/− mice showed increased insulin signaling as shown by a 3.1-fold enhanced phosphorylation of IRβ, a 2.6-fold increase in the tyrosine phosphorylation of IRS1 and a 3.2 fold increase in Akt serine-473 phosphorylation in liver tissue when compared to WT mice after HFD feeding for 12 weeks (Fig. 8g). Nlrp3−/− mice showed a similar enhancement in p-Akt (Ser473) in the liver, adipose and muscle tissues, suggesting increased insulin signaling in the key target tissues (Fig. 8h). The mRNA expression of inflammatory cytokines Tnfa and Mcp1 (Ccl2) was significantly reduced in livers from Nlrp3−/− mice (Fig. 8i) or Pycard−/− mice (Fig. 8j) compared to those from WT controls. In summary, these in vivo animal experiments suggest that myeloid-derived inflammasome complex promotes inflammatory cytokine production and insulin resistance in a HFD-induced model via reduction of insulin signaling.
One caveat is that the improved insulin sensitivity observed in Nlrp3−/− mice after HFD feeding might be associated with alternations in their basic metabolic parameters. To assess this, WT and Nlrp3−/− mice were subjected to indirect calorimetric analysis using metabolic cages. The total body weight of male WT and Nlrp3−/− mice on either RD or HFD were not different (Supplementary Fig. 6a), which is consistent with a recent study 37. Magnetic resonance imaging (MRI) analysis revealed similar proportions of fat and lean body mass in HFD-fed WT and Nlrp3−/− mice (Supplementary Fig. 6b). No significant difference in food intake (Supplementary Fig. 6c), water intake (Supplementary Fig. 6d), or activity (data not shown) was observed between these two groups. Furthermore, nocturnal or diurnal measurements of total energy expenditure were not different between these two groups (Supplementary Fig. 6e). Therefore no significant difference was observed in the basic metabolic parameters of HFD-fed WT and Nlrp3−/− mice.
Discussion
Although several inflammatory cytokines including IL-6 38 and TNF 36 have been indicated as important inflammatory and pro-diabetic mediators, anti-inflammation-based therapeutic strategies targeting these two cytokines in insulin resistance and T2D have been sub-optimal. In contrast, a recent study indicates a promising therapeutic effect of Anakinra in the treatment of T2D 6. Our findings provide mechanistic insights regarding the activation of the inflammasome by saturated FFAs via an AMPK-ROS signaling axis (Supplementary Fig. 1). The inflammasome products then target host liver cells to reduce IRβ and IRS1 tyrosine phosphorylation and more distal Akt serine phosphorylation that are essential for the proper biological effects of insulin.
In addition to the role described for the inflammasome activation, the role and mechanism of TNF in obesity and insulin resistance have been well described 35, 39. TNF is induced in adipose tissue in conditions of obesity and contributes to the impairment of insulin signaling. Mechanistically, TNF induces serine phosphorylation of IRS1, resulting in impaired signal transduction between insulin receptor and the downstream PI3K-Akt pathway that leads to insulin resistance. However, the endogenous molecule(s) that triggers TNF remains largely unknown. We show here that IL-1β administration leads to elevated TNF and the lack of NLRP3 and PYCARD decreased TNF transcript under HFD. This agrees with other studies under conditions of regular diet that IL-1β signals through MyD88 to induce TNF expression. Therefore, the function of IL-1β in obesity-associated chronic inflammation and insulin resistance involves at least two mechanisms; (a) direct inhibition of insulin signaling in insulin target tissues by serine phosphorylation of IRS1 and (b) indirect induction of insulin resistance by promoting TNF generation.
The development of insulin resistance and T2D has been linked to increased availability of lipids and other nutrients due to over-nutrition. Plasma concentrations of FFAs are elevated in insulin resistance and can predict T2D 32. Recent studies have suggested that FFAs induce insulin resistance by participating in lipotoxic responses 40 and chronic inflammatory responses 1, both of which promote insulin resistance and T2D. Overloaded FFAs directly exerts a lipotoxic effect through an increased level of intracellular lipid metabolites 41. FFAs, particularly saturated fatty acids (SFAs), exhibit proinflammatory effect through their influence on innate immune cells such as macrophages. Previous studies have suggested that FFAs could engage TLR and induce proinflammatory cytokine production 13, 14. Our findings revealed that FFAs also exert their proinflammatory effects by triggering inflammasome activation and IL-1β cleavage and release. Inflammasome products play an essential role in the impairment of insulin signaling, consistent with the clinical findings indicating that IL-1β antagonist is promising for insulin resistance and T2D 6.
The uptake of FFAs by cells is mediated by multiple cell membrane proteins such as CD36, fatty acid transport protein and plasma membrane fatty acid binding protein. FFAs then lead to the synthesis of triacylglycerol (TAG), which is a core component of lipid droplet 42. Lipid metabolites including ceramide and diacylglycerol (DAG) can activate NAPDH oxidase and enhance ROS generation 40. FFA-enhanced ROS generation is negatively regulated by AMPK activation, which results in an increased β oxidation of FFAs in mitochondria and decreased overall lipid load inside cells 20. Consistent with these previous studies, this study finds that PA treatment induces ROS generation in a time-dependent manner, which is prevented by a ROS or NAPDH oxidase inhibitor. Enhanced ROS generation is attenuated by the presence of AMPK agonist, suggesting an upstream inhibitory role of AMPK in ROS generation. We further identify that AMPK controls autophagy upon LPS plus PA treatment. Thus, PA-decreased AMPK activity leads to defective autophagy and the accumulation of mitochondrial ROS, presumably by a deficiency in the clearance of dysfunctional mitochondria (mitophagy). Since previous studies have shown that NAPDH oxidase-dependent generation of ROS plays an essential role in NLRP3 inflammasome activation 17, our findings indicate that FFA leads to inflammasome activation and IL-1β release through a novel AMPK-autophagy-ROS signaling pathway. This is different from previous identified NLRP3 inflammasome activating mechanisms, such as those mediated by phagolysosomal pathway (pathogens and exogenous reagents) and P2X7R (ATP) as inhibiting these pathways did not alter inflammasome activation by PA-BSA. Conversely, the AMPK pathway is not involved in inflammasome activation by other conventional agonists of NLRP3 such as ATP, nigericin and alum. This supports the concept that the AMPK-ROS pathway is a more specialized route of inflammasome activation in response to PA.
In addition to ROS, another shared property of inflammasome activation and FFA stimulation that has not been previously appreciated is autophagy. As an intrinsic process that aims to provide energy and maintain cellular homeostasis, autophagy can be activated by a number of stimuli such as bacterial and viral challenge 29, Although controversy exists 43, accumulating evidence including the experiment shown in this report, supports the contention that TLR activation can induce autophagy 31, 44, presumably due to an increased energy demand of mounting of an immune response, including enhanced cytokine production and phagocytosis. Since autophagy is activated in response to nutrient-poor conditions, one would hypothesize that over-nutrition inhibits autophagy. Indeed, one report showed defective autophagy in obesity, which exacerbates insulin resistance 45. Our study suggests a pathway where PA stimulation results in AMPK inhibition, leading to defective autophagy in myeloid cells, which has been shown to activate inflammasome 25, 26.
In summary, this work studies how HFD induces an inflammatory IL-1β response, which then contributes to insulin signaling in key target tissues. Our data show that elevated fatty acid caused by a HFD can activate the NLRP3 inflammasome in macrophages by an AMPK-autophagy-ROS signaling pathway that has not been previously associated with the inflammasome. IL-1β induced by fatty acid prevents normal insulin signaling in multiple insulin target tissues, ultimately resulting in insulin resistance.
Online Methods
Mice
Nlrp3−/−, Pycard−/−, Nlrc4−/−, Casp1−/−, P2x7r−/−, Il1b−/− have been described 46-49. C57BL/6 mice and Tnfa−/− mice were purchased from Jackson Laboratories. Mice were treated in accordance with the National Institute of Health Guide for the Care and Use of Laboratory Animals and the Institutional Animal Care and Use Committee (IACUC) of the University of North Carolina at Chapel Hill.
Reagents and antibodies
Recombinant murine IL-1β was from PeproTech. Sodium palmitate, fat acid-free BSA (A8806), N-acetyl-L-cysteine (NAC), ATP, chloroquine, glucose and insulin for in vitro treatment were from Sigma-Aldrich. AICAR, Bafilomycin A1, cytochalasin D and nigericin were from Calbiochem. Ultrapure LPS was from InvivoGen. Z-VAD-fmk, z-YVAD-fmk, APDC and dipheylene iodoinium (DPI) were from ALEXIS Biochemicals. Imject Alum was from Pierce. Human insulin (Novolin) for in vivo treatment was from Novo Nordisk. IL-1R antagonist “Anakinra” was from Amgen. TRIzol reagent was from Invitrogen. Antibodies included anti-p-AMPKα (Thr172), anti-AMPKα, anti-p-ACC (Ser79), anti-ACC, anti-p-IRS-1 (Ser307), anti-phosphotyrosine, anti-Akt, anti-p-Akt (Ser473), anti-p-ULK1 (Ser467), anti-p-ULK1 (Ser555), Anti-LC3B (Cell Signaling), anti-caspase-1, anti-insulin receptor β subunit, anti-β-actin (Santa Cruz Biotechnology), anti-IRS1 (Upstate Biotechnology), anti-IL-1β (R&D Systems) and anti-ULK1 (Sigma).
PA-BSA complex preparation
Sodium palmitate was dissolved in 95% ethanol at 60°C to yield a stock concentration of 10 mM and kept at -20°C. Nitrogen gas was used to completely remove ethanol in palmitate stock solution. Palmitate was then conjugated with fatty acid-free BSA at a 3:1 molar ratio.
Cell culture and stimulation
BMM and BMDC were generated in the presence of L-929 conditional medium and GM-CSF, respectively. After pretreatment with ultrapure LPS (200 ng/ml) for 3 h, BMM, BMDC or peritoneal macrophages were stimulated with BSA alone or PA-BSA (200 or 500 μM) for 24 h, ATP (2 mM) or nigericin (5 μM) for 40 min, or alum (400 μg/ml) for 8 hrs, as indicated. In the experiments studying the role of potassium efflux in PA-induced inflammasome activation, BMM were cultured in either low or high potassium media, as previously reported 23. Where indicated, chemical inhibitors were added 30 min before cell stimulation (2.5 h after LPS priming). Supernatant and cell lysate were collected for ELISA and western blot analysis.
Macrophage transfection
BMM were transfected with empty vector, constitutively active (CA) α1 AMPK 22 by using Amaxa Mouse Macrophage Nucleofector Kit according to the Manufacturer's directions (Lonza). The transfection efficiency was determined by flow cytometric analysis of green fluorescence protein (GFP) by cotransfecting macrophages with pmaxGFP and CA α1 AMPK.
ROS detection
We assessed the total level of intracellular ROS using the fluoroprobe dihydrorhodamine 123 (DHR, AnaSpec), and mitochondrial ROS using MitoSOX (Molecular Probes). LPS-primed cells were treated with palmitate in the presence or absence of ROS inhibitor APDC. Cells were loaded with 10 μM DHR for 10 min and washed twice with sterile PBS. Secondly, cells were loaded with 5 μM MitoSOX for 15 min. Mean fluorescence intensity (MFI) was determined using a CyAn ADP flow cytometer (DAKO).
Confocal microscopy imaging
BMMs were seeded on 8-well glass slide (Thermo Fisher Scientific). Cells were left untreated, or treated with either LPS (200 ng/ml) alone or LPS plus PA (0.5 mM) in the absence or presence of AICAR (100 μM) for 24 h. Cells were fixed and permeabilized with 4% paraformaldehyde containing 0.1% Triton-X 100 for 15 min at room temperature, and stained with anti-LC3B antibody overnight at 4°C, followed by the incubation with Alexa Fluor 647 goat anti-rabbit antibody (Invitrogen). Images were acquired with an Olympus FV500 confocal microscope.
Isolation of mouse primary hepatocytes
Liver was subsequently perfused with 10 ml DPBS and 10 ml DMEM containing collagenase A (0.1%), and was incubated in 0.1% collagenase at 37°C for 30 min with gentle rotation. Cell viability was assessed by the trypan blue staining and was higher than 60%. Hepatocytes were cultured at a density of 2×10⁶ cells in DMEM and stimulated as indicated in Figure Legend.
Flow cytometric analysis of phospho-Akt
Mouse hepatocyte cell line FL38B cells (ATCC CRL2390) were incubated with either 2 ng/ml recombinant murine IL-1β or macrophage conditioned medium in the absence or presence of either IL-1R antagonist anakinra (1 μg/ml) for 24 hrs. Cells were stimulated with insulin (200 nM) for 10 min and were bar-coded using Pacific Orange and Pacific Blue Alexa Fluor succinimidyl estres (Molecular probes) as previously described 50.
Mouse models
Male WT, Nlrp3−/− and Pycard−/− mice, aging at 6-7 weeks of age, were fed with either a regular diet (RD) or a high-fat diet (40% fat calories) (5TJN, TestDiet) and had free access to water and diet. GTT and ITT were conduced at after HFD for 12 and 13 weeks, respectively. For GTT, the mice were fasted overnight (∼16 hours). At 9 am next morning, mice were injected intraperitoneally with glucose solution at a dosage of 1 g/kg body weight. For ITT, the mice were fasted for 6 hrs. Mice were injected intraperitoneally with insulin solution at a dosage of 1 IU/kg body weight. Blood glucose was measured at indicated time points using a FreeStyle Lite glucometer (Abbott).
Metabolic study
Six-week old male WT and Nlrp3−/− mice were fed with HFD for 12 weeks. Lean and fat body mass were evaluated using an EchoMRI-100 (Echo Medical Systems) according to the manufacturer's instructions. Indirect calorimetry was conducted in the open-circuit indirect calorimeter (TSE Systems) for 48 hrs in the Clinical Nutrition Research Center at the University of North Carolina. Mice were placed individually in the chambers, and readings were taken 24 hrs after acclimation. Measures of food and water intake, O2 consumption, CO2 production, and physical activity were obtained.
Statistics
Statistical analysis was carried out with Prism 5.0 for Macintosh. All data are shown as mean ± s.d.. The mean values for biochemical data from each group were compared by Student's t-test. Comparisons between multiple time points were analyzed. by repeated-measurements analysis of variance (ANOVA) with Bonferroni post-tests. In all tests, p values of less than 0.05 were considered statistically significant.
Supplementary Material
Acknowledgments
We thank Drs. Vishva Dixit, Richard Flavell, Beverly Koller and David Chaplin for gene-deletion mice, Drs. Hang Shi and David Carling for AMPK constructs. We thank Dr. Kunjie Hua from UNC Nutrition Obesity Research Center (NORC) for metabolic studies, and Mrs. Victoria Madden from UNC Microscopy Services Laboratory for TEM analysis. We acknowledge Drs. Lei Li and Shuli Wang for technical support. We thank Drs. Rosalind Coleman and Maureen Su for a careful critique of the manuscript, and Drs. Gökhan Hotamisligil, Lisa Makowski and Jill Suttles for helpful discussions. This work was supported by grant R37-AI029564-17 (J.P-Y.T.) and CA-156330-01 (J.P-Y.T.) from the National Institutes of Health. H. Wen is supported by the Postdoctoral Fellowship of the American Heart Association, Mid-Atlantic Affiliate and Postdoctoral Fellowship of the Cancer Research Institute.
Footnotes
Author Contributions: H.W., D.G. and J.T. designed the experiments; H.W., D.G., Y.L., S.J., L.Z., M.H. and W.J.B. performed experiments and provided intellectual input; J.T. supervised the study. H.W., D.G. and J.T. interpreted the data and wrote the manuscript.
Competing Financial Interests: The authors declare no competing financial interests.
References
- 1.Hotamisligil GS. Inflammation and metabolic disorders. Nature. 2006;444:860–867. doi: 10.1038/nature05485. [DOI] [PubMed] [Google Scholar]
- 2.Maedler K, et al. Glucose-induced beta cell production of IL-1beta contributes to glucotoxicity in human pancreatic islets. J Clin Invest. 2002;110:851–860. doi: 10.1172/JCI15318. [DOI] [PMC free article] [PubMed] [Google Scholar]
- 3.Spranger J, et al. Inflammatory cytokines and the risk to develop type 2 diabetes: results of the prospective population-based European Prospective Investigation into Cancer and Nutrition (EPIC)-Potsdam Study. Diabetes. 2003;52:812–817. doi: 10.2337/diabetes.52.3.812. [DOI] [PubMed] [Google Scholar]
- 4.Jager J, Gremeaux T, Cormont M, Le Marchand-Brustel Y, Tanti JF. Interleukin-1beta-induced insulin resistance in adipocytes through down-regulation of insulin receptor substrate-1 expression. Endocrinology. 2007;148:241–251. doi: 10.1210/en.2006-0692. [DOI] [PMC free article] [PubMed] [Google Scholar]
- 5.Lagathu C, et al. Long-term treatment with interleukin-1beta induces insulin resistance in murine and human adipocytes. Diabetologia. 2006;49:2162–2173. doi: 10.1007/s00125-006-0335-z. [DOI] [PubMed] [Google Scholar]
- 6.Larsen CM, et al. Interleukin-1-receptor antagonist in type 2 diabetes mellitus. N Engl J Med. 2007;356:1517–1526. doi: 10.1056/NEJMoa065213. [DOI] [PubMed] [Google Scholar]
- 7.Mandrup-Poulsen T, Pickersgill L, Donath MY. Blockade of interleukin 1 in type 1 diabetes mellitus. Nat Rev Endocrinol. 2010;6:158–166. doi: 10.1038/nrendo.2009.271. [DOI] [PubMed] [Google Scholar]
- 8.Zhou R, Tardivel A, Thorens B, Choi I, Tschopp J. Thioredoxin-interacting protein links oxidative stress to inflammasome activation. Nat Immunol. 2010;11:136–140. doi: 10.1038/ni.1831. [DOI] [PubMed] [Google Scholar]
- 9.Masters SL, et al. Activation of the NLRP3 inflammasome by islet amyloid polypeptide provides a mechanism for enhanced IL-1beta in type 2 diabetes. Nat Immunol. 2010;11:897–904. doi: 10.1038/ni.1935. [DOI] [PMC free article] [PubMed] [Google Scholar]
- 10.Ting JP, et al. The NLR gene family: a standard nomenclature. Immunity. 2008;28:285–287. doi: 10.1016/j.immuni.2008.02.005. [DOI] [PMC free article] [PubMed] [Google Scholar]
- 11.Ahren B. Islet G protein-coupled receptors as potential targets for treatment of type 2 diabetes. Nat Rev Drug Discov. 2009;8:369–385. doi: 10.1038/nrd2782. [DOI] [PubMed] [Google Scholar]
- 12.Boden G. Interaction between free fatty acids and glucose metabolism. Curr Opin Clin Nutr Metab Care. 2002;5:545–549. doi: 10.1097/00075197-200209000-00014. [DOI] [PubMed] [Google Scholar]
- 13.Shi H, et al. TLR4 links innate immunity and fatty acid-induced insulin resistance. J Clin Invest. 2006;116:3015–3025. doi: 10.1172/JCI28898. [DOI] [PMC free article] [PubMed] [Google Scholar]
- 14.Nguyen MT, et al. A subpopulation of macrophages infiltrates hypertrophic adipose tissue and is activated by free fatty acids via Toll-like receptors 2 and 4 and JNK-dependent pathways. J Biol Chem. 2007;282:35279–35292. doi: 10.1074/jbc.M706762200. [DOI] [PubMed] [Google Scholar]
- 15.Ting JP, Duncan JA, Lei Y. How the noninflammasome NLRs function in the innate immune system. Science. 2010;327:286–290. doi: 10.1126/science.1184004. [DOI] [PMC free article] [PubMed] [Google Scholar]
- 16.Ting JP, Willingham SB, Bergstralh DT. NLRs at the intersection of cell death and immunity. Nat Rev Immunol. 2008;8:372–379. doi: 10.1038/nri2296. [DOI] [PubMed] [Google Scholar]
- 17.Schroder K, Tschopp J. The inflammasomes. Cell. 2010;140:821–832. doi: 10.1016/j.cell.2010.01.040. [DOI] [PubMed] [Google Scholar]
- 18.Bauernfeind FG, et al. Cutting edge: NF-kappaB activating pattern recognition and cytokine receptors license NLRP3 inflammasome activation by regulating NLRP3 expression. J Immunol. 2009;183:787–791. doi: 10.4049/jimmunol.0901363. [DOI] [PMC free article] [PubMed] [Google Scholar]
- 19.Steinberg GR, Kemp BE. AMPK in Health and Disease. Physiol Rev. 2009;89:1025–1078. doi: 10.1152/physrev.00011.2008. [DOI] [PubMed] [Google Scholar]
- 20.Wang S, et al. AMPKalpha2 deletion causes aberrant expression and activation of NAD(P)H oxidase and consequent endothelial dysfunction in vivo: role of 26S proteasomes. Circ Res. 2010;106:1117–1128. doi: 10.1161/CIRCRESAHA.109.212530. [DOI] [PMC free article] [PubMed] [Google Scholar]
- 21.Yang Z, Kahn BB, Shi H, Xue BZ. Macrophage alpha1 AMP-activated protein kinase (alpha1AMPK) antagonizes fatty acid-induced inflammation through SIRT1. J Biol Chem. 2010;285:19051–19059. doi: 10.1074/jbc.M110.123620. [DOI] [PMC free article] [PubMed] [Google Scholar]
- 22.Woods A, et al. Characterization of the role of AMP-activated protein kinase in the regulation of glucose-activated gene expression using constitutively active and dominant negative forms of the kinase. Mol Cell Biol. 2000;20:6704–6711. doi: 10.1128/mcb.20.18.6704-6711.2000. [DOI] [PMC free article] [PubMed] [Google Scholar]
- 23.Eisenbarth SC, Colegio OR, O'Connor W, Sutterwala FS, Flavell RA. Crucial role for the Nalp3 inflammasome in the immunostimulatory properties of aluminium adjuvants. Nature. 2008;453:1122–1126. doi: 10.1038/nature06939. [DOI] [PMC free article] [PubMed] [Google Scholar]
- 24.Fernandes-Alnemri T, et al. The AIM2 inflammasome is critical for innate immunity to Francisella tularensis. Nat Immunol. 2010;11:385–393. doi: 10.1038/ni.1859. [DOI] [PMC free article] [PubMed] [Google Scholar]
- 25.Zhou R, Yazdi AS, Menu P, Tschopp J. A role for mitochondria in NLRP3 inflammasome activation. Nature. 2011;469:221–225. doi: 10.1038/nature09663. [DOI] [PubMed] [Google Scholar]
- 26.Nakahira K, et al. Autophagy proteins regulate innate immune responses by inhibiting the release of mitochondrial DNA mediated by the NALP3 inflammasome. Nat Immunol. 2011;12:222–230. doi: 10.1038/ni.1980. [DOI] [PMC free article] [PubMed] [Google Scholar]
- 27.Egan DF, et al. Phosphorylation of ULK1 (hATG1) by AMP-Activated Protein Kinase Connects Energy Sensing to Mitophagy. Science. 2011;331:456–461. doi: 10.1126/science.1196371. [DOI] [PMC free article] [PubMed] [Google Scholar]
- 28.Kim J, Kundu M, Viollet B, Guan KL. AMPK and mTOR regulate autophagy through direct phosphorylation of Ulk1. Nat Cell Biol. 2011;13:132–141. doi: 10.1038/ncb2152. [DOI] [PMC free article] [PubMed] [Google Scholar]
- 29.Levine B, Mizushima N, Virgin HW. Autophagy in immunity and inflammation. Nature. 2011;469:323–335. doi: 10.1038/nature09782. [DOI] [PMC free article] [PubMed] [Google Scholar]
- 30.Klionsky DJ, et al. Guidelines for the use and interpretation of assays for monitoring autophagy in higher eukaryotes. Autophagy. 2008;4:151–175. doi: 10.4161/auto.5338. [DOI] [PMC free article] [PubMed] [Google Scholar]
- 31.Xu Y, et al. Toll-like receptor 4 is a sensor for autophagy associated with innate immunity. Immunity. 2007;27:135–144. doi: 10.1016/j.immuni.2007.05.022. [DOI] [PMC free article] [PubMed] [Google Scholar]
- 32.Roden M. Mechanisms of Disease: hepatic steatosis in type 2 diabetes--pathogenesis and clinical relevance. Nat Clin Pract Endocrinol Metab. 2006;2:335–348. doi: 10.1038/ncpendmet0190. [DOI] [PubMed] [Google Scholar]
- 33.Furuhashi M, Hotamisligil GS. Fatty acid-binding proteins: role in metabolic diseases and potential as drug targets. Nat Rev Drug Discov. 2008;7:489–503. doi: 10.1038/nrd2589. [DOI] [PMC free article] [PubMed] [Google Scholar]
- 34.Zenewicz LA, et al. Interleukin-22 but not interleukin-17 provides protection to hepatocytes during acute liver inflammation. Immunity. 2007;27:647–659. doi: 10.1016/j.immuni.2007.07.023. [DOI] [PMC free article] [PubMed] [Google Scholar]
- 35.Hotamisligil GS, et al. IRS-1-mediated inhibition of insulin receptor tyrosine kinase activity in TNF-alpha- and obesity-induced insulin resistance. Science. 1996;271:665–668. doi: 10.1126/science.271.5249.665. [DOI] [PubMed] [Google Scholar]
- 36.Uysal KT, Wiesbrock SM, Marino MW, Hotamisligil GS. Protection from obesity-induced insulin resistance in mice lacking TNF-alpha function. Nature. 1997;389:610–614. doi: 10.1038/39335. [DOI] [PubMed] [Google Scholar]
- 37.Vandanmagsar B, et al. The NLRP3 inflammasome instigates obesity-induced inflammation and insulin resistance. Nat Med. 2011;17:179–188. doi: 10.1038/nm.2279. [DOI] [PMC free article] [PubMed] [Google Scholar]
- 38.Sabio G, et al. A stress signaling pathway in adipose tissue regulates hepatic insulin resistance. Science. 2008;322:1539–1543. doi: 10.1126/science.1160794. [DOI] [PMC free article] [PubMed] [Google Scholar]
- 39.Hotamisligil GS, Shargill NS, Spiegelman BM. Adipose expression of tumor necrosis factor-alpha: direct role in obesity-linked insulin resistance. Science. 1993;259:87–91. doi: 10.1126/science.7678183. [DOI] [PubMed] [Google Scholar]
- 40.Brookheart RT, Michel CI, Schaffer JE. As a matter of fat. Cell Metab. 2009;10:9–12. doi: 10.1016/j.cmet.2009.03.011. [DOI] [PMC free article] [PubMed] [Google Scholar]
- 41.Savage DB, Petersen KF, Shulman GI. Disordered lipid metabolism and the pathogenesis of insulin resistance. Physiol Rev. 2007;87:507–520. doi: 10.1152/physrev.00024.2006. [DOI] [PMC free article] [PubMed] [Google Scholar]
- 42.Farese RV, Jr, Walther TC. Lipid droplets finally get a little R-E-S-P-E-C-T. Cell. 2009;139:855–860. doi: 10.1016/j.cell.2009.11.005. [DOI] [PMC free article] [PubMed] [Google Scholar]
- 43.Saitoh T, et al. Loss of the autophagy protein Atg16L1 enhances endotoxin-induced IL-1beta production. Nature. 2008;456:264–268. doi: 10.1038/nature07383. [DOI] [PubMed] [Google Scholar]
- 44.Sanjuan MA, et al. Toll-like receptor signalling in macrophages links the autophagy pathway to phagocytosis. Nature. 2007;450:1253–1257. doi: 10.1038/nature06421. [DOI] [PubMed] [Google Scholar]
- 45.Yang L, Li P, Fu S, Calay ES, Hotamisligil GS. Defective hepatic autophagy in obesity promotes ER stress and causes insulin resistance. Cell Metab. 2010;11:467–478. doi: 10.1016/j.cmet.2010.04.005. [DOI] [PMC free article] [PubMed] [Google Scholar]
- 46.Mariathasan S, et al. Differential activation of the inflammasome by caspase-1 adaptors ASC and Ipaf. Nature. 2004;430:213–218. doi: 10.1038/nature02664. [DOI] [PubMed] [Google Scholar]
- 47.Sutterwala FS, et al. Critical role for NALP3/CIAS1/Cryopyrin in innate and adaptive immunity through its regulation of caspase-1. Immunity. 2006;24:317–327. doi: 10.1016/j.immuni.2006.02.004. [DOI] [PubMed] [Google Scholar]
- 48.Solle M, et al. Altered cytokine production in mice lacking P2X(7) receptors. J Biol Chem. 2001;276:125–132. doi: 10.1074/jbc.M006781200. [DOI] [PubMed] [Google Scholar]
- 49.Shornick LP, et al. Mice deficient in IL-1beta manifest impaired contact hypersensitivity to trinitrochlorobenzone. J Exp Med. 1996;183:1427–1436. doi: 10.1084/jem.183.4.1427. [DOI] [PMC free article] [PubMed] [Google Scholar]
- 50.Krutzik PO, Nolan GP. Fluorescent cell barcoding in flow cytometry allows high-throughput drug screening and signaling profiling. Nat Methods. 2006;3:361–368. doi: 10.1038/nmeth872. [DOI] [PubMed] [Google Scholar]
Associated Data
This section collects any data citations, data availability statements, or supplementary materials included in this article.