Abstract
This study presents a completely automated method for separating the left and right lungs using free-formed surface fitting on volumetric computed tomography (CT). The left and right lungs are roughly divided using iterative 3-dimensional morphological operator and a Hessian matrix analysis. A point set traversing between the initial left and right lungs is then detected with a Euclidean distance transform to determine the optimal separating surface, which is then modeled from the point set using a free-formed surface-fitting algorithm. Subsequently, the left and right lung volumes are smoothly and directly separated using the separating surface. The performance of the proposed method was estimated by comparison with that of a human expert on 44 CT examinations. For all data sets, averages of the root mean square surface distance, maximum surface distance, and volumetric overlap error between the results of the automatic and the manual methods were 0.032 mm, 2.418 mm, and 0.017 %, respectively. Our study showed the feasibility of automatically separating the left and right lungs by identifying the 3D continuous separating surface on volumetric chest CT images.
Keywords: Left and right lung separation, Hessian matrix analysis, Euclidean distance transform, Free-formed surface fitting, Lung segmentation
Introduction
Computed tomography (CT) imaging technology has been improved for more accurate interpretation of lung diseases. Advances in CT imaging techniques have reduced the scan time and increased both the quality and quantity of image data. Consequently, the desirability of thin-section CT examination compared to other modalities has greatly increased with respect to lung analysis, including diagnostic lung imaging, computer-aided detection of lung nodules [1, 2], whole lung quantification [3–7], and lung functional analysis [8–10]. The large number of images that can be easily obtained has encouraged research into the computer-guided analysis of chest CT images.
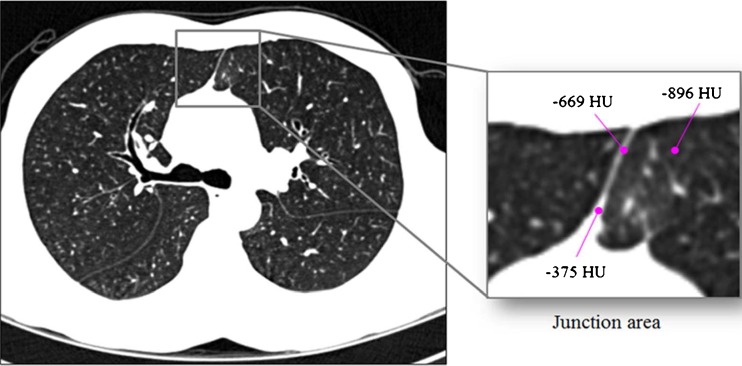
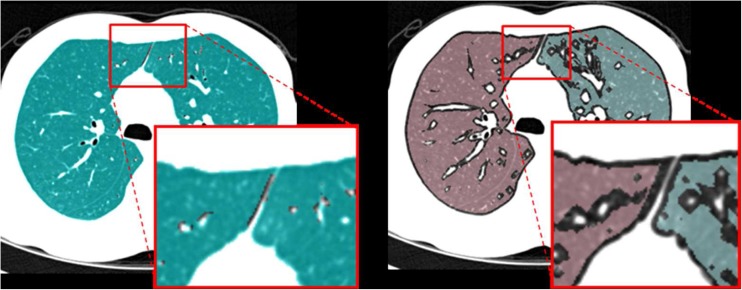
Lung segmentation is essential in computer-guided analyses of parenchymal density, airways and emphysema evaluation, the detection of lung nodules, and lobe-based studies. In CT images, the lung tissue appears as a dark region while the surrounding tissue is relatively bright, as air has a low attenuation value (ideally, −1,000 Hounsfield unit (HU)) on CT scans and it occupies most of the lung. Consequently, previous lung segmentation techniques have been based primarily on the contrast between the lung and the surrounding tissue [11]. Among lung segmentation techniques, the gray-level thresholding method, which defines a cutoff value between gray values of the lung and the other tissues and divides the lung and other regions according to that value, has been widely used in most computer-aided applications and its performance has been satisfactory; however, this method is quite vulnerable to the partial volume effects(PVE). Thus, if a patient has chronic obstructive pulmonary disease (COPD) or performs a deep inspiration during CT scanning, the anterior or posterior regions of the facing boundaries between the left and right lungs can be very close to each other, as shown in Fig. 1. In general, these regions may be very narrow and of low contrast due to PVE. Therefore, in these cases, with thresholding-based lung segmentation, the left and right lungs may falsely appear to be connected which makes it difficult to detect and quantify lung diseases accurately based on global and local lung function measurements.
Fig. 1.
An example of the anterior junction between the left and right lungs: when an upper-bound threshold value to be used for lung segmentation is −400 HU, a narrow region with low contrast located between the two lungs (including a voxel with −669 HU) belongs to a lung region
In an attempt to overcome this problem, several approaches have been examined. Most lung separation methods developed thus far are based on 2-dimensional (2D) slice images and consist of three steps: junction region detection, the search for a separating line, and lung separation [12–16]. Leader et al. [12] used a heuristic method to detect the junction region between the left and right lungs; they searched for a separating line by finding the largest pixel value in the junction region. Armato and Sensakovic [13] found the most anterior point along the cardiac aspect of the lung region and used it to search for a separating line. However, as this method assumes that most junction regions are located in the anterior part of the lung, it cannot be used for separating lung data with a posterior junction or both anterior and posterior junctions. Brown et al. [14] identified the narrow junction region by modeling an individual lung shape as a cylinder, and a separating line was then determined using a dynamic programming algorithm. Hu et al. [15] found anterior and posterior junction regions more reliably by obtaining the initial separation result using 2D morphological erosion and conditional dilation and then searching for a separating line. However, this method involves increased computational complexity in cases in which an area of the connected region is relatively large, as the morphological operations must be repeated many times. Park et al. [16] proposed a new method based on the 3-dimensional (3D) information of sequential CT images. The location of the junction was determined by ascertaining the middle point with the shortest distance between any two points on the facing lung boundary. The detected middle point was then used as a seed point to determine the junction region in the next slice. After detecting the junction region, they found the separating line using their proposed guided dynamic programming algorithm, which showed better performance than the original one in their experimental results. However, although this method uses 3D information on volumetric lung data, the separating line must be iteratively searched for in each slice of the given volumetric data and the lung separation process must be repeated if the number of junctions is more than two. In summary, as lung separation methods have thus far been based on 2D slice images, they unnecessarily require repeated processes and the 3D continuity of separated lung boundaries cannot be guaranteed.
To resolve these issues, we propose a more effective lung separation method using free-formed surface fitting. Instead of searching for the location of the junction region in the proposed method, the initial left and right lung volumes are separated by 3D morphological operator. The 3D distance transform algorithm is then applied to the initial lung volumes. Based on these results, 3D central points between the facing left and right lung boundaries are obtained and subsequently used to generate a free-formed surface by using a surface fitting algorithm. Finally, the left and right lung volumes are smoothly divided by this surface. In the experiments, it was proven that the left and right lungs are effectively separated using the proposed method without the need for repetition of the process and regardless of the number and position of the junctions.
This paper is organized as follows. The proposed method for the left and right lung separation is described in Section II. In Section III, the evaluation technique and experimental results are presented. Finally, a discussion of the results and the conclusion are provided in Section IV.
Materials and Methods
Testing Data Sets
For this study, CT volumetric images of the whole chest were selected from a collection of data in the Radiology Department of Asan Medical Center (Seoul, South Korea). This data set consisted of two groups: one group of patients with COPD and another with normal lungs. For the COPD data set, CT scans from 30 of COPD patients were retrospectively selected from all of the scans acquired from this group between June 2010 and June 2011. The normal data set consisted of CT scans from 14 of the 34 patients from whom scans were obtained between January 2011 and June 2011. A data inclusion criterion was that the CT image data could not be separated into left and right lungs using a typical lung extraction algorithm, due to junctions between the two lungs.
CT Protocol
Volumetric CT scans were performed without bronchodilatation within a day of pulmonary function tests. All CT scans were obtained using 16-MDCT scanner (Somatom Sensation; Siemens Medical Systems, Erlangen, Germany). Scan parameters included 16 × 0.75 mm collimation, 100 eff. mAs, 140 kVp, and pitch of 1. The scale of attenuation coefficients in this CT scanner ranges from −1,024 to 3,072 Hounsfield units (HU). Slice thickness of 0.625–1 mm and increment of 0.625–1 mm were used. Before CT scanning, subjects were coached to hold breaths at full inspiration and full expiration by the technologist, and training was performed to check whether full inspiration and expiration could be adequately obtained. Acquired data were reconstructed, using a standard algorithm, at thicknesses of 0.625–0.8 mm and increments of 0.625–0.8 mm. All CT machines were calibrated every month and after major maintenance, using water as a standard phantom, and were calibrated in air every day. We obtained all screening scans within 24 h of air calibration. Image data were stored in the Digital Imaging and Communications in Medicine (DICOM) format. This study was approved by the institutional review board at Asan Medical Center.
Lung Extraction
The lung volume was extracted using a typical, semi-automatic lung segmentation scheme [15, 17]. The lung segmentation algorithm consists of the following three steps, which are based on gray-level thresholding, 3D region growing, and morphological operations.
Classification of Lung and Non-lung Regions: A fixed, threshold-based segmentation is first applied to separate the lung region, including the airways, from the surrounding, non-lung region. The threshold range to segment the lung region is −1,024 to −400 HU. After thresholding, a seed point for 3D region growing is determined by semi-automatically searching for the location of a possible point within the lung. From this seed point, the lung volume is grown so that it reaches the size of the region determined by the thresholding.
Segmentation of the Trachea and Bronchi: The trachea and the main parts of the bronchial tree are segmented using 3D region growing with the fixed threshold range of −1,024 to −950 HU within the lung region, and are regarded as the true airway region [18]. A new seed point for the airways is determined by searching for a possible point within the tracheal region in the topmost superior slice of the chest volumetric CT scan. From this seed point, the volume of the trachea and the main stem bronchi is segmented using 3D region growing. Finally, morphological dilation is applied to eliminate fuzzy components, which can be caused by the use of a fixed threshold, from the segmented region.
Extraction of the Lung: The lung volume obtained with the first step contains the trachea and the main parts of the bronchial tree, as well as the left and right lungs. Therefore, to obtain the true left and right lung volumes, the trachea and the main stem bronchi must be removed from the lung region. Accordingly, volume-based subtraction is used to separate the left and right lungs from the trachea and bronchi. Finally, each lung volume is obtained by 3D region growing. In general, after the removal of the trachea and the main stem bronchi from the lung region, the left and right lungs are easily divided by region growing. However, in some cases, the two lungs cannot be separated due to anterior or posterior region attachment caused by PVE. Such cases require an additional separation process.
The Proposed Lung Separation Method
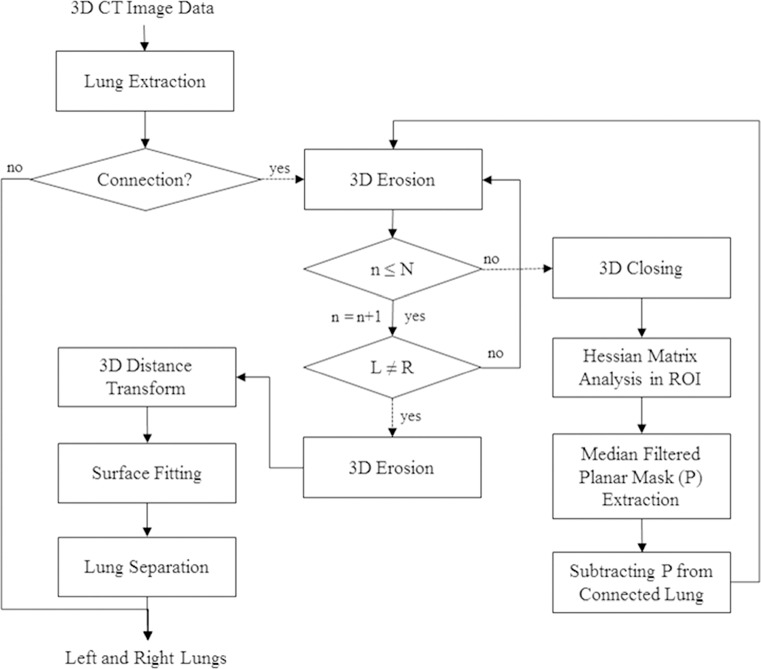
To automatically separate a 3D left and right lung volume in volumetric CT data, our iterative method consists of three steps: (1) Initial Left and Right Lung Separation, (2) Detection of a Central Point Set Traversed between the Initial Left and Right Lungs Using Euclidean Distance Transform, (3) Separation of the Left and Right Lungs Using Free-Formed Surface Fitting. Figure 2 shows the overall process of the proposed lung separation method.
Fig. 2.
Overall process of the proposed lung separation method
Initial left and right lung separation
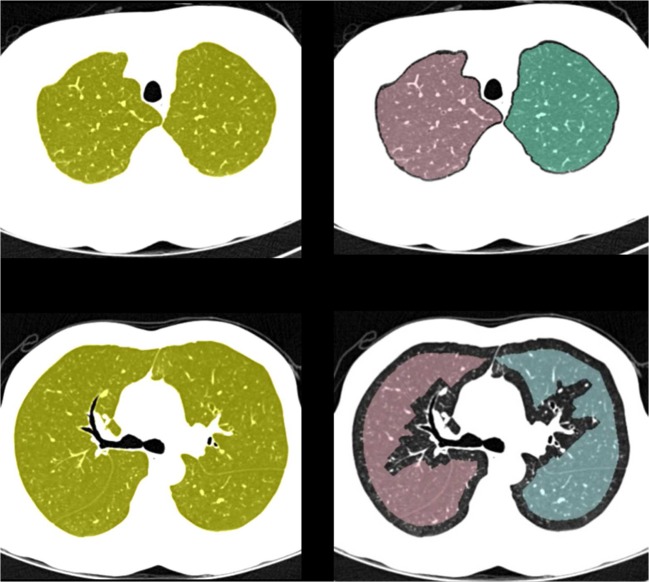
To identify a correct separating surface, the left and right lungs should initially be separated without severely modifying their original shapes. Accordingly, the proposed initial lung separation is based on a scheme in which a 3D eroding operation is combined with a Hessian matrix analysis method. Figure 3 shows the results of a separation in which a 3D erosion operator has been applied to the lung data of obtained from two examinations, with junctions of different sizes between the two lungs. The 3D erosion was performed repeatedly until each given lung volume was separated into left and right lungs.
Fig. 3.
The shapes of the lungs separated only by a 3D erosion operator for the volumetric lung data of two examinations with lungs of different junction sizes: a lung data with a small medial junction; b the shapes of the left and right lungs separated by repeating an erosion process four times; c lung data with a large anterior junction; and d the shapes of the left and right lungs separated by repeating an erosion process 15 times
As seen in Fig. 3a, b, if the left and right lungs are weakly connected, a 3D erosion operator can easily separated them using a small number of iterations, thus maintaining their original shapes. On the other hand, if the size of the junction is large, the separated volumes will be severely deformed in shape, such that it will be difficult to find a correct separating surface.
To solve this problem, we used a Hessian matrix analysis method with limited iterations of the 3D erosion operator. Initial lung separation starts by performing a 3D erosion operation within the limited repetitions of the number that was determined empirically. If the left and right lungs are separated during the process of this limited erosion, this lung data is considered as weakly connected lung data and this initial lung separation step is completed. However, if they are not, the lung data is considered as strongly connected lung data and the voxels corresponding to the junctions between the left and right lungs are detected and removed from the given lung data by analyzing the eigenvalues of the Hessian matrix. Therefore, this intermediate lung data whose junction region becomes weaker could be easily separated into left and right lungs without shape deformation caused by 3D eroding.
The Hessian matrix analysis method is widely used for extracting local structural features from 3D objects by analyzing the eigenvalues of the Hessian matrix. This method has been used primarily for vessel detection [19, 20] and tissue classification [21] in the field of medical image analysis. In this study, multiple scale analysis is used to correctly detect the lung junction with various sizes. Image intensity function in scale space is obtained by convoluting the original image with the Gaussian functions with differing variances, as shown in Eq. 1;
 |
1 |
where f(x, y, z) is an image function, g(x, y, z, ∂) is a Gaussian function with variance ∂, and I(x, y, z) is an original image. The Hessian matrix of the image function is obtained as follows:
 |
2 |
where fxx and fxy are second derivatives of the image function f(x, y, z). The eigenvalues (λ1 ≥ λ2 ≥ λ3) of the Hessian matrix are used as features for detecting local structures of three types such as sheet, line, and blob. Table 1 shows basic eigenvalue conditions for each local structure, and these conditions are based on the assumption that the local structure is brighter than the surrounding region [21].
Table 1.
Basic conditions for each local structure [21]
| Local structure | Eigenvalue condition | Decomposition condition |
|---|---|---|
| Sheet | λ 3 ≪ λ 2 ≅ λ 1 ≅ 0 | λ 3 ≪ 0 & λ 3 ≪ λ 2 ≅ 0 & λ 3 ≪ λ 1 ≅ 0 |
| Line | λ 3 ≅ λ 2 ≪ λ 1 ≅ 0 | λ 3 ≪ 0 & λ 3 ≅ λ 2 & λ 2 ≪ λ 1 ≅ 0 |
| Blob | λ 3 ≅ λ 2 ≅ λ 1 ≪ 0 | λ 3 ≪ 0 & λ 3 ≅ λ 2 & λ 2 ≅ λ 1 |
The junction region between the left and right lungs can be assumed as a plate structure in volumetric lung data. To detect this region, we defined a condition based on the fundamental condition for sheet-like region detection. The defined conditions are as follows:
 |
3 |
where θ1 and θ2 have similar values, which are near zero, θ3 is a negative number less than θ1 and θ2, and α is a positive number. These numbers were empirically defined. Based on these conditions, the voxels corresponding to a sheet-like structure are extracted. The extracted voxels are densely distributed in a correct junction region and are sparsely scattered in a non-junction region of lung tissue, such as fissures or large vessels. To refine the junction detection, scattered noisy voxels are eliminated by a median filter.
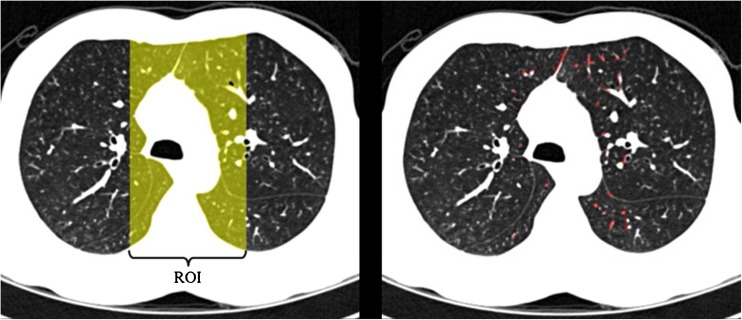
Before applying the Hessian matrix analysis, closing operation and region of interest (ROI) detection are used, as shown in Fig. 2. The closing operation is used to increase the junction region, and ROI detection is used to correctly detect the lung junction by excluding the regions containing lobar fissures as the lobar fissures can be detected as a lung junction. In addition, Hessian matrix analysis in the ROI can reduce processing time. The ROI is defined as a region occupying the central region in 35 % of the whole lung in the axial direction since most of the junctions are located between the left and right lungs, as shown in Fig. 4. Finally, the detected junction voxels are removed from the original, whole lung voxels. The strength of the connection between the two lungs then becomes weak enough to separate the two lungs based on a 3D erosion operator, and while maintaining the shape of each lung, as shown in Fig. 5.
Fig. 4.
ROI and sheet-like regions: a defined ROI in an axial CT image and b sheet-like voxels detected by Hessian matrix analysis in the ROI
Fig. 5.
Initial lung separation results: a Intermediate lung data and b initial left and right lungs
Detection of a central point set traversed between the initial left and right lungs using Euclidean distance transform
After initially separating the given single lung data into left and right lungs, we should correctly and efficiently find the optimal separating surface to separate the two lungs. For this purpose, the proposed scheme first detects 3D points which can be located on the separating surface using a 3D EDT algorithm.
This method has been widely used in computer vision, graphics, shape analysis, pattern recognition, and computational geometry [22, 23]. Here, we use a 3D EDT algorithm as the lung data used in this study is volumetric binary data [24].
The initial left and right lung volumes obtained in the previous step are separated some distance away from each other, and the amount of the boundary voxels removed from one lung volume by erosion is equal to that of the other lung volume. Based on these facts, the optimal separating surface can be obtained by detecting the points which are centrally traversed between the initial left and right lung volumes and modeling them into a free-formed surface. To detect the central point set between the two lung volumes, the 3D EDT for each volumetric lung data is calculated, and the point set is determined to be the points within the same distance range from each lung based on the 3D distance map for the two lungs.
The 3D distance map of each initial lung volume data set is calculated as shown in Eq. 4. Within the given volumetric binary lung data, a lung volume is an object and the remaining region is a background. In this study, we focus on the distance map of the background region, unlike the original DT algorithm, as the central point set traversed between the two objects should be able to be found. Therefore, the original 3D EDT is modified as:
 |
4 |
The set O is called ‘object’ and the set B ‘background’. ‖‖ is a 2D distance metric in which the DT(Distance Transform) algorithm obtains different results according to the distance metric. In the DT algorithm, the Euclidean distance is commonly considered to be the most useful metric [22].
From the distance map for each lung, we can find the set of central points as follows:
 |
5 |
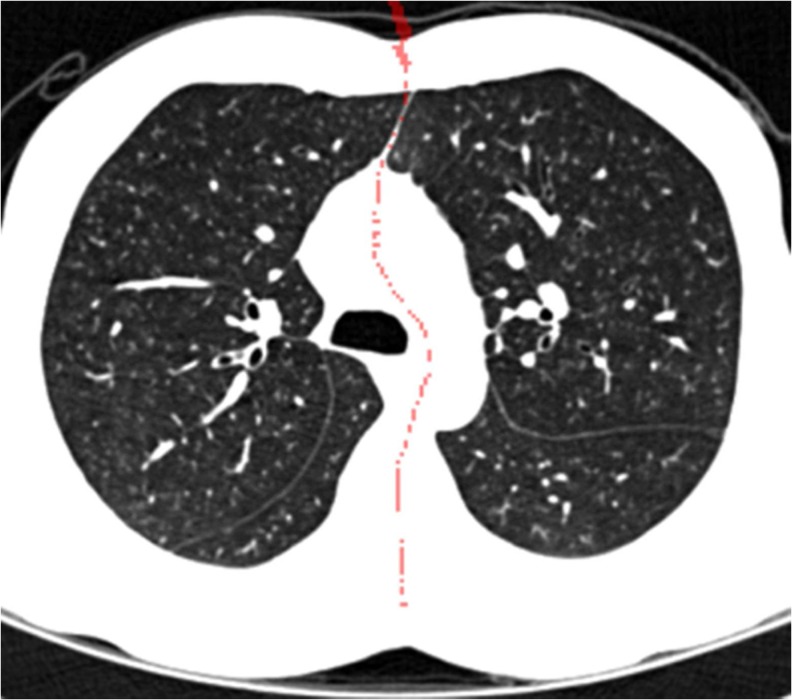
C is the set of central points, ILt(x, y, z) and IRt(x, y, z) are the distance maps of the initial left and right lung data, and τ1 and τ2 are, respectively, the lower and upper bounds of the common distance range. The lower and upper bounds were empirically defined in our experiments. Figure 6 shows the example for a process for detecting the central points between the two objects in a binary image-based on the 3D EDT algorithm, and Fig. 7 shows the result obtained using the proposed method for the volumetric CT lung data. To reduce the processing time, all volumetric lung data were subsampled with a factor of 2 in each direction before calculating the distance maps of the initially separated left and right lungs.
Fig. 6.
Example of the modified distance transform in a 2D binary image with two objects: a the Euclidean distance of each pixel to the nearest pixel of object A; b the Euclidean distance of each pixel to the nearest pixel of object B; and c the set of central points from a and b. The distance values are squared
Fig. 7.
Example of the central point set obtained by the 3D EDT algorithm. The detected central points are represented as red dots on the axial view image
Separation of the left and right lungs using free-formed surface fitting
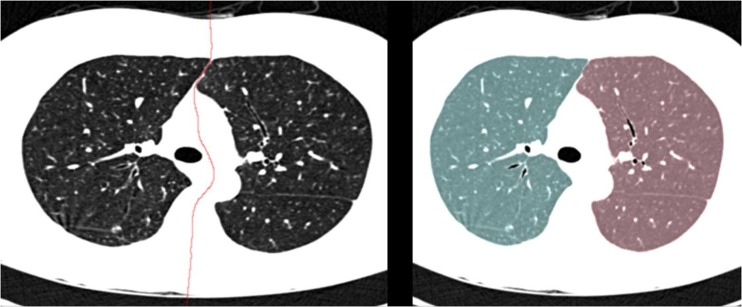
The central point set is used to model a free-formed surface to separate the left and right lungs. For this purpose, we used a surface fitting algorithm based on gridfit of the Matlab version because this algorithm makes a smooth surface model based on data that have a z(x, y) form from scattered or semi-scattered data [25]. After the separating surface between the two lungs has been determined, to separate the left and right lungs, the voxels of the surface data are removed from the original single large lung data, and the two separated lung volumes are obtained using a region growing method. Figure 8 shows the lung separation result obtained with the proposed method.
Fig. 8.
Lung separation results: a the optimal separating surface modeled from the central point set and b the left and right lung data separated using the proposed method (Left lung; blue, Right lung; red)
Results
Evaluation Technique
To evaluate the performance of the proposed lung separation method, we compared the results obtained using the proposed method with the manually separated results, using the three measures including average symmetry Root Mean Square–Surface Distance(RMS-SD), maximum surface distance(MSD), and volumetric overlap error(VOE) [26].
To obtain manual separation results, an interactive, lung-separating tool developed as in-house software was used. This tool allows an observer to split the left and right lungs manually using thresholding based, 3D sculpting. A human expert who has worked with this interactive tool for more than 5 years separated the left and right lungs manually. We then compared and analyzed the automatically separated result and the manually generated result.
Results
Table 2 shows the average and standard deviation of the volumetric differences between the lungs separated using the proposed method and the manual analysis. From these results, the following can be observed:
The proposed method precisely and successfully detected and separated all connections between the left and right lungs in the given lung data of 44 patients. The averages of the RMS-SD, MSD, and VOE between the two results were 0.032 (±0.045) mm, 2.418 (±1.955) mm, and 0.017 (± 0.039) %, respectively.
The performance of the abnormal (COPD) data set was similar to that of the normal data set in all three measurements. In other words, the performance of the proposed method would be clinically reasonable regardless of the data set, whether normal or abnormal.
Table 2.
Average and standard deviation of the volume differences between lungs separated using the proposed versus the manual method
| Data set | RMS-SD (mm) | MSD (mm) | VOE (%) |
|---|---|---|---|
| Abnormal | 0.033 (0.045) | 2.525 (1.988) | 0.014 (0.032) |
| Normal | 0.030 (0.044) | 2.189 (1.897) | 0.025 (0.052) |
| Total | 0.032 (0.045) | 2.418 (1.955) | 0.017 (0.039) |
In Table 3, the abnormal and normal data sets were compared with respect to the following: percentage of cases subjected to Hessian matrix analysis, number of repeated erosion operations for the initial lung separation in the cases not subjected to Hessian matrix analysis, and number of repeated erosion operations in the cases subjected to Hessian matrix analysis. These three factors represent the conditions of the connections between the left and right lungs for each data set. As shown in Table 3, more lung data needing Hessian matrix analysis were presented in the abnormal than in the normal data set, and the average number of repeated erosion operations was higher (5.2 and 4.1, respectively). This indicates that the lung data contained in the abnormal set had stronger and wider connections between the left and right lungs than that of the normal set. However, the experimental findings also showed that the lung separation results of the abnormal set were similar to those of the normal set. From this information, it can be concluded that the proposed lung separation method is feasible in the given two data sets and that its performance is less affected by the locations (i.e., anterior, medial, and posterior) and numbers (i.e., single and multiple) of lung connections, as shown in Fig. 9. The algorithm was implemented in C++ linked with Matlab, and the code was not optimized. It takes 3 min to process complete CT images on Intel 3-GHz i7 CPU. The processing time of the proposed method is shorter than that of a human expert. In the case of a human expert, it takes approximately 15 min
Table 3.
Comparisons between the abnormal and normal data sets
| Data set | Percentage of Cases in which a Hessian Matrix Analysis was applied | # of erosion operations | # of Erosion operations after applying Hessian matrix analysis | ||||
|---|---|---|---|---|---|---|---|
| Max | Min | Ave | Max | Min | Ave | ||
| Abnormal | 23.3 % (7/30) | 9 | 2 | 5.2 | 6 | 3 | 4.7 |
| Normal | 21.4 % (3/14) | 6 | 2 | 4.1 | 5 | 4 | 4.7 |
| Total | 22.7 % (10/44) | 9 | 2 | 4.8 | 6 | 3 | 4.7 |
Fig. 9.

CT slice images for the lung separation results obtained using the proposed method
Discussion and Conclusion
We have developed a novel 3D surface fitting based a scheme used to automatically separate the left and right lungs on the chest CT data. Our results showed that this method could separate the connections between the left and right lungs with accuracy comparable to that of a human expert, as shown in Table 2.
In the previous methods [12–16], based on the 2D-slice CT images, the processes used to detect the junction region and to identify the optimal path should be iteratively conducted on every slice image; consequently, they would not guarantee the 3D continuity of a separating surface between left and right lungs. As our proposed scheme is a 3D-volumetric CT data-based method, it is able to avoid such iterations and separate multiple junctions regardless of their locations in a single instance. In addition, 3D-based lung separation can provide results with 3D continuity of the separated lung boundary. Figure 10 shows the three-dimensionally rendered views of the lung separation results obtained using our method.
Fig. 10.

Three-dimensionally rendered views of the lung separation process of one CT examination: a lung with an anterior junction; b connected lung data and the detected optimal separating surface; and c left and right lungs separated using the proposed method
In a previous study, a method [15] based on the morphological operator iteratively conducted morphological opening and/or closing operations. This iterative procedure is time-consuming. Our method also used morphological operation. However, our method used morphological operation with the limited conducting number, as well as the scheme combined Hessian matrix analysis in order to minimize the processing time. Therefore, we were able to avoid a large degree of computational complexity.
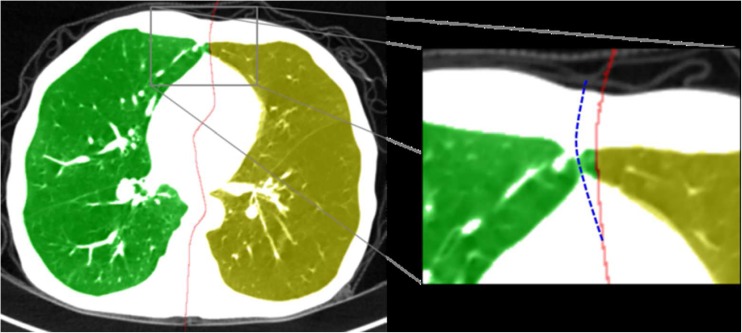
Although the proposed method was successful regardless of the given data sets, there might be a problem when applying it for lung data with non-smooth boundary. In this case, the original lung shape can be severely deformed after conducting 3D erosion operation in the initial lung separation step. This makes the proposed method incorrect for finding the separating surface. Consequently, this problem causes failed separation results to be obtained. Figure 11 shows examples of this problem. To solve this problem, the initial lung separation step must be improved in order to keep the original shape of the lung boundary in the future work.
Fig. 11.
Examples of failed lung separation results caused by a 3D erosion operator. The original shapes of the left and right lungs in the junction region were severely modified by 3D erosion. (Red solid line indicates the separating surface detected using the proposed method; Blue dotted line indicates the manually corrected separating surface)
In addition, the proposed method was only tested on a small number of CT examinations performed on a limited specific CT machine, using a CT reconstruction protocol, and for only certain diseases. In other words, the feasibility or performance of the proposed method, when applied to cases with severe lung abnormalities along the junction area or when using other CT scanners and reconstruction protocols, was not investigated in this study. Therefore, the robustness of the proposed method should be improved by testing on a large CT image database that includes diverse cases with various lung diseases, CT vendors, and reconstruction protocols. In conclusion, our study showed that it is possible to separate the left and right lungs automatically in volumetric chest CT images by identifying the 3D continuous separating surface. Regarding the evaluation of abnormal and normal lung data sets, the experimental results showed that the performance of the proposed method was comparable to that of a human expert.
Acknowledgments
This work was supported by the Technology Innovation Programs (10041618, 10041605) funded by the Ministry of Knowledge Economy (MKE) of Korea.
References
- 1.Kang MJ, Park CM, Lee CH, Goo JM, Lee HJ. Dual-energy CT: clinical applications in various pulmonary diseases. Radiographics. 2010;30(3):685–698. doi: 10.1148/rg.303095101. [DOI] [PubMed] [Google Scholar]
- 2.Goo JM. A computer-aided diagnosis for evaluating lung nodules on chest CT: the current status and perspective. Korean J Radiol. 2011;12(2):145–155. doi: 10.3348/kjr.2011.12.2.145. [DOI] [PMC free article] [PubMed] [Google Scholar]
- 3.Uppaluri R, Hoffman EA, Sonka M, Hunninghake GW, McLennan G. Interstitial lung disease: a quantitative study using the adaptive multiple feature method. Am J Respir Crit Care Med. 1999;159(2):519–525. doi: 10.1164/ajrccm.159.2.9707145. [DOI] [PubMed] [Google Scholar]
- 4.Park YS, et al. Texture-based quantification of pulmonary emphysema on high-resolution computed tomography: comparison with density-based quantification and correlation with pulmonary function test. Investig Radiol. 2008;43(6):395–402. doi: 10.1097/RLI.0b013e31816901c7. [DOI] [PubMed] [Google Scholar]
- 5.Lee CW, et al. A pilot trial on pulmonary emphysema quantification and perfusion mapping in a single-step using contrast-enhanced dual-energy computed tomography. Investig Radiol. 2012;47(1):92–97. doi: 10.1097/RLI.0b013e318228359a. [DOI] [PubMed] [Google Scholar]
- 6.Lee YK, et al. Quantitative assessment of emphysema, air trapping, and airway thickening on computed tomography. Lung. 2008;186(3):157–165. doi: 10.1007/s00408-008-9071-0. [DOI] [PubMed] [Google Scholar]
- 7.Chae EJ, et al. Slope of emphysema index: an objective descriptor of regional heterogeneity of emphysema and an independent determinant of pulmonary function. AJR Am J Roentgenol. 2010;194(3):W248–W255. doi: 10.2214/AJR.09.2672. [DOI] [PubMed] [Google Scholar]
- 8.Chae EJ, et al. Xenon ventilation CT with a dual-energy technique of dual-source CT: initial experience. Radiology. 2008;248(2):615–624. doi: 10.1148/radiol.2482071482. [DOI] [PubMed] [Google Scholar]
- 9.Goo HW, Yang DH, Kim N, Park SI, Kim DK, Kim EA. Collateral ventilation to congenital hyperlucent lung lesions assessed on xenon-enhanced dynamic dual-energy CT: an initial experience. Korean J Radiol. 2011;12(1):25–33. doi: 10.3348/kjr.2011.12.1.25. [DOI] [PMC free article] [PubMed] [Google Scholar]
- 10.Chae EJ, et al. Collateral ventilation in a canine model with bronchial obstruction: assessment with xenon-enhanced dual-energy CT. Radiology. 2010;255(3):790–798. doi: 10.1148/radiol.10090947. [DOI] [PubMed] [Google Scholar]
- 11.Sluimer I, Schilham A, Prokop M, van Ginneken B. Computer analysis of computed tomography scans of the lung: a survey. IEEE Trans Med Imaging. 2006;25(4):385–405. doi: 10.1109/TMI.2005.862753. [DOI] [PubMed] [Google Scholar]
- 12.Leader JK, et al. Automated lung segmentation in X-ray computed tomography: development and evaluation of a heuristic threshold-based scheme. Acad Radiol. 2003;10(11):1224–1236. doi: 10.1016/S1076-6332(03)00380-5. [DOI] [PubMed] [Google Scholar]
- 13.Armato SG, 3rd, Sensakovic WF. Automated lung segmentation for thoracic CT impact on computer-aided diagnosis. Acad Radiol. 2004;11(9):1011–1021. doi: 10.1016/j.acra.2004.06.005. [DOI] [PubMed] [Google Scholar]
- 14.Brown MS, et al. Method for segmenting chest CT image data using an anatomical model: preliminary results. IEEE Trans Med Imaging. 1997;16(6):828–839. doi: 10.1109/42.650879. [DOI] [PubMed] [Google Scholar]
- 15.Hu S, Hoffman EA, Reinhardt JM. Automatic lung segmentation for accurate quantitation of volumetric X-ray CT images. IEEE Trans Med Imaging. 2001;20(6):490–498. doi: 10.1109/42.929615. [DOI] [PubMed] [Google Scholar]
- 16.Park SC, et al. Separation of left and right lungs using 3-dimensional information of sequential computed tomography images and a guided dynamic programming algorithm. J Comput Assist Tomogr. 2011;35(2):280–289. doi: 10.1097/RCT.0b013e31820e4389. [DOI] [PMC free article] [PubMed] [Google Scholar]
- 17.van Rikxoort EM, de Hoop B, van de Vorst S, Prokop M, van Ginneken B. Automatic segmentation of pulmonary segments from volumetric chest CT scans. IEEE Trans Med Imaging. 2009;28(4):621–630. doi: 10.1109/TMI.2008.2008968. [DOI] [PubMed] [Google Scholar]
- 18.Bartz D et al.: Hybrid segmentation and exploration of the human lungs. Proceedings of the 14th IEEE Visualization Conference (VIS'03). Seattle, WA, USA, 2003
- 19.Chen J, Amini AA. Quantifying 3-D vascular structures in MRA images using hybrid PDE and geometric deformable models. IEEE Trans Med Imaging. 2004;23(10):1251–1262. doi: 10.1109/TMI.2004.834612. [DOI] [PubMed] [Google Scholar]
- 20.Sofka M, Stewart CV. Retinal vessel centerline extraction using multiscale matched filters, confidence and edge measures. IEEE Trans Med Imaging. 2006;25(12):1531–1546. doi: 10.1109/TMI.2006.884190. [DOI] [PubMed] [Google Scholar]
- 21.Sato Y, et al. Tissue classification based on 3D local intensity structures for volume rendering. IEEE Trans Vis Comput Graph. 2000;6(2):160–180. doi: 10.1109/2945.856997. [DOI] [Google Scholar]
- 22.Fabbri R, Costa LDF, Torelli JC, Bruno OM. 2D Euclidean distance transform algorithms: a comparative survey. ACM Comput Surv (CSUR) 2008;40(1):2. doi: 10.1145/1322432.1322434. [DOI] [Google Scholar]
- 23.Bailey DG. An efficient euclidean distance transform. Berlin: Springer; 2005. [Google Scholar]
- 24.Maurer CR, Jr, Qi R, Raghavan V. A linear time algorithm for computing exact euclidean distance transforms of binary images in arbitrary dimensions. IEEE Trans Pattern Anal Mach Intell. 2003;25(2):265–270. doi: 10.1109/TPAMI.2003.1177156. [DOI] [Google Scholar]
- 25.Surface fitting using gridfit. Available at http://www.mathworks.com/matlabcentral/fileexchange/8998. Accessed 11 Sept 2012
- 26.Van Ginneken B, Heimann T, Styner M. 3D Segmentation in the clinic: a grand challenge. MICCAI. 2007;10:7–15. [Google Scholar]


