

Abstract
In addition to their primary role in lowering plasma cholesterol, statins have a variety of other actions. In this report we studied the effect of simvastatin treatment on burn injury induced changes in regional glucose metabolism. Groups of six CD-1 mice (male, ~25 g) were subjected to full thickness 30% total body surface area (TBSA) burn injury. Seven days later the animals were treated with simvastatin at various doses (0.02, 0.2 and 2.0 μg/kg, i.p.). On the following morning, the mice were injected with 18FDG (50 μCi) via tail vein. Approximately 60 minutes after tracer injection, the animals were sacrificed and biodistribution was measured. A sub-set burned and sham-control animals was injected with a larger dose of 18FDG (~1.0 mCi) and tracer distribution was evaluated by μPET. In heart and brown adipose tissue (BAT), burn injury produced a highly significant increase in 18FDG accumulation (p<0.01), whereas tracer accumulation in brain was markedly reduced (p<0.01). In heart and BAT, simvastatin treatment produced dose dependent reductions in 18FDG accumulation. In contrast, simvastatin did not affect 18FDG accumulation in brain. There was no effect of simvastatin treatment on 18FDG accumulation in heart, BAT or brain of sham treated mice. Less pronounced effects were detected in other tissues that were studied. All animals had normal plasma glucose levels (~90 mg/dl). Our results indicate that simvastatin reverses burn induced increases in 18FDG accumulation by heart and BAT in a dose dependant manner but does not affect burn induced reductions of 18FDG accumulation by brain. These findings suggest that statins may exert some of their effects by tissue specific modulation of glucose metabolism.
Keywords: Burn, Glucose, 18FDG, Insulin resistance, Brown Adipose Tissue, Simvastatin, Sepsis
Introduction
Over the past several years, we have performed numerous studies of whole body and organ glucose metabolism with 18F labeled 2-fluoro-2-deoxy-D-Glucose (18FDG) in rodent models (mice and rats) of burn injury. Among the most common and striking findings of these studies, were alterations of glucose metabolism in the brain and heart (1,2,3,4,5). In the case of the brain, these studies demonstrated a consistent and marked reduction in 18FDG uptake throughout the brain. Since burn injury is associated with insulin resistance and hyperglycemia, this finding could, at least in part, be due to competition of endogenous glucose with 18FDG for brain uptake. However, when the raw uptake data from these studies were corrected for glucose levels, the finding of reduced CNS metabolism persisted. These results are surprising, since glucose is the primary substrate for CNS energy metabolism and CNS uptake of glucose is maintained in most pathophysiological states.
In contrast to the brain, 18FDG uptake in the myocardium was markedly increased after burn injury. When brain uptake of 18FDG was corrected for the existing hyperglycemia associated with burn injury, the effect of burn injury became even more profound. Clearly, these alterations in glucose metabolism in the brain and heart could be contributing factors in the increase mortality of septic animals with or without burn injury.
In addition to their primary role in lowering plasma cholesterol, statins have a variety of other actions. Statin pretreatment has been shown to protect mice against sepsis-related death (6) and this protection appeared to be associated in part, with an attenuation of pro-inflammatory cytokine production, specifically Il-6 and TNF. Dobesh et al (7) demonstrated that use of statins in patients prior to the development of severe sepsis appears to produce a significant reduction in mortality compared with patients that were not receiving statins. In addition, it has been reported by Fogerty et al that treatment wit statins prior to injury significantly decreased mortality and showed a trend toward reduced septic shock in a retrospective study of 223 elderly burn patients (8). Recently, we demonstrated that mortality produced by sepsis in mice with burn injury or by lipopolysaccharide challenge is greatly attenuated by simvastatin treatment (9,10). However, the effects of statin treatment on the metabolic derangements and insulin resistance after burn injury or sepsis are unknown. In the current report, we studied the effect of simvastatin treatment on burn injury induced changes in regional glucose metabolism.
Materials and Methods
Burn Injury Model
Male CD-1 mice weighing 25 to 28 g were purchased from Charles River Breeding Laboratories, Boston MA. Full-thickness, non-lethal thermal injury (30 % total body surface area [TBSA]) was produced, as described previously (11) using a protocol approved by the Subcommittee on Research Animal Care of the Massachusetts General Hospital. Briefly, the mice were anesthetized with ether and their backs were shaved with animal hair clippers. Under ether anesthesia, they were placed in molds exposing 30% TBSA followed by emersion of the exposed area in a water bath at 90°C for 9 sec. The animals were immediately resuscitated with saline (15 ml/kg) by intraperitoneal injection. Sham control animals were treated similarly, except immersion was in room temperature water. After the procedures, the animals were caged individually and food and water were provided ab libitum.
Measurement of 18FDG Uptake in Tissues of Mice With Burn Injury
In preliminary studies, groups of six animals were fasted overnight before tracer injection. On the following morning, the mice were injected with 18FDG (50 μCi) via tail vein. Approximately 60 minutes after tracer injection, the animals were sacrificed by cervical dislocation and complete biodistribution was measured. Radioactivity in aliquots of the injected was measured in parallel with the tissue samples and the results were calculated as the percentage of the injected dose per gram wet weight of tissue (%ID/g). All results were expressed as mean ±sem. Blood glucose levels were measured with a Contour glucometer (Bayer Inc.).
Effect of Simvastatin Treatment on Regional Glucose metabolism
Simvastatin (Merck Biosciences, Inc.) was dissolved in ethanol at a concentration of 10 mg/ml and diluted with normal saline to yield a final concentration of 10 μg/ml. Placebo contained only ethanol in saline.
On day seven after burn injury when the animals were presumed to be insulin resistant (12) simvastatin was injected i.p. at doses of 0 (placebo), 0.02, 0.2 and 2.0 μg/kg followed by fasting overnight. On the following morning, the mice were injected with 18FDG (50 μCi) via tail vein. Approximately 60 minutes after tracer injection, the animals were sacrificed by cervical dislocation and complete biodistribution was measured as described above. The results were calculated as the percentage of the injected dose per gram wet weight of tissue (%ID/g). All results were expressed as mean ± sem. A sub-set burned and sham-control animals was injected with a larger dose of 18FDG (~1.0 mCi) and tracer distribution was evaluated by μPET.
μPET Imaging
To further evaluate the glucose metabolism in mayor organs, Positron Emission Tomography (PET) were conducted in a sub-set of the animals described above; sham controls and burned mice with or without treatment wit simvastatin at a dose of 0.2 μg/kg (n=3 each). For these studies a larger dose of 18FDG (~1.0 mCi) was injected.
Imaging was performed with a Concord P4 micro-PET device. The primary imaging characteristics of the P4 camera are average intrinsic spatial resolution of 1.75 FWHM, 63 contiguous slices of 1.21 mm separation and a sensitivity of 1.43% for the 350–650 Kev energy window (13).
18FDG for measuring glucose metabolism, was injected approximately one hour before image acquisition. The acquisition was performed for 10 min. The list mode data set re-binned to a single sinogram and reconstructed using a filtered back projection (FGP) algorithm using a ramp filter with cutoff of 0.5. In all animals, the region from the head to the base of the tail was included in the 7.9 cm field of view of the camera. Data for attenuation correction was measured with a rotating point source containing 68Ge. All projection data were corrected for non-uniformity of detector response, dead time, random coincidences, and scattered radiation. Regions of interest (ROIs) were drawn over selected tissues and activity was measured in nCi/ml.
When 18FDG is injected, it is transported from plasma into cells according to the rate constant K1, transported back into plasma with the rate constant k2, phosphorylated with a rate constant k3 and dephosphorylated with a rate constant k4. Since, 18FDG-PO4 cannot proceed further in glycolysis or be used for glycogen synthesis, tracer accumulation reflects glucose utilization. The transport and metabolism of 18FDG is summarized by the kinetic model in Figure 1.
Figure 1.
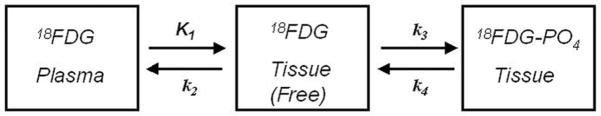
Kinetic model for 18FDG-PET. When 18FDG is injected, it is transported from plasma into cells according to the rate constant K1, transported back into plasma with the rate constant k2, phosphorylated with a rate constant k3 and dephosphorylated with a rate constant k4.
Oral Glucose Tolerance Tests
These studies were performed on mice with burn injury, sham controls and burn injured mice treated with simvastatin. On the day of the experiments, food was removed 10 hours prior to administration of a 2 g/kg glucose solution via gavage. Glucose levels were measured on serial whole blood samples acquired over two hours with a Contour glucometer (Bayer Inc.). Areas under the plasma glucose curves (AUC’s) were calculated using the trapazoidal rule.
Statistical Analysis
Statistical analysis was performed by one or two-way analysis of variance (ANOVA). Individual means were compared by Duncan’s multiple range test. Differences with a p-value of less than 0.05 were considered to be statistically significant.
Results
Figure 2, illustrates the pattern of 18FDG uptake in brain and heart of sham-treated and burned mice at 24 and 168 h after injury. Two-way ANOVA demonstrated highly significant effects of treatment, F2,30= 110.49; p<0.0001 and tissue by treatment interaction, F2,35= 38.85; p<0.0001. In brain, there was a monotonic decrease in tracer uptake over the time-course after injury. Tracer uptake was decreased by 38 % compared with sham-treated control animals at 24 h after injury (p<0.01) and decreased further by 52 % compared with sham-treated control animals at 168 h after injury (p<0.001). In contrast, cardiac uptake of 18FDG demonstrated a monotonic increase over the time course after injury. Tracer uptake was increased by 246 % compared with sham-treated control animals at 24 h after injury (p<0.001) and increased further by 315 % compared with sham-treated control animals at 168 h after injury (p<0.001 vs sham, p<0.001 vs 24 h).
Figure 2.

18FDG uptake in brain and heart of sham-treated and burned mice at 24 and 168 hours after injury. Each value is the mean ± sem for 6 animals. *p<0.01 vs. sham group, **p<0.001 vs. sham group, ***p<0.001 vs. sham and 24 h groups.
In addition to the tracer studies, observation of the behavior of the animals revealed signs consistent with cerebral dysfunction during the first 24 hours after injury, including: lethargy, difficulty in righting after turning over, disorientation in movement in the cage, etc.
The pattern of 18FDG uptake in brain, heart, brown adipose tissue (BAT) and white adipose tissue (WAT) of mice treated with placebo and 3 doses of simvastatin at 24 hours after burn injury and sham treated controls is illustrated in Figure 3. Two-way ANOVA demonstrated highly significant main effects of treatment, F4,100= 18.11; p<0.0001, tissue F3,100= 123.67; p<0.0001 and tissue by treatment interaction, F12,119 = 15.57; p<0.0001. Burn injury produced significant increases in 18FDG uptake by heart (p< 0.01) and BAT (p< 0.001) and a significant decrease in uptake by brain (p< 0.01). In both heart and BAT, simvastatin treatment produced progressive and dose dependent decreases in tracer uptake. In BAT, upake was significantly reduced by simvastatin at 0.2μ/g compared to burn alone (p<0.05) and by simvastatin at 0.2 and 2 μ/g compared to simvastatin at 0.02 μ/g (p<0.01). In contrast, tracer uptake in brain was not affected by simvastatin treatment. Burn injury with or without simvastatin had no effect on 18FDG uptake by WAT. Minor non-statistically significant effects of simvastatin treatment were detected in the other tissues that were sampled. There were no effects of simvastatin treatment any tissues of sham treated control animals (data not shown).
Figure 3.

18FDG uptake in brain, heart, BAT and WAT of burn injured mice, sham controls and burn injured mice treated with placebo or simvastatin at doses of 0.02 (Statin - L), 0.2 (statin – I) and 2.0 (Statin – H) μg/g. Each value is the mean ± sem for 6 animals. Heart: **p<0.01 vs. sham, *p<0.05 vs. burn alone; Brain: ++p<0.01 vs sham; BAT: ***p<0.001 vs. sham, +p<0.05 vs burn alone, #p<0.05 vs. simvastatin at 0.02 μg/g.
Figure 4 illustrates representative 18FDG μPET images of a sham control mouse (A), a mouse with burn injury (B) and a burn injured mouse treated with simvastatin at a dose of 0.2 μg/g (C). After injury there was intense tracer uptake in BAT that was associated with significant reductions in uptake by all other tissues, including brain. After treatment with simvastatin, 18FDG uptake in BAT returned toward the level observed in sham treated mice and uptake in brain was partially normalized (see Figure 3). Similar results were observed in all animals that were studied.
Figure 4.
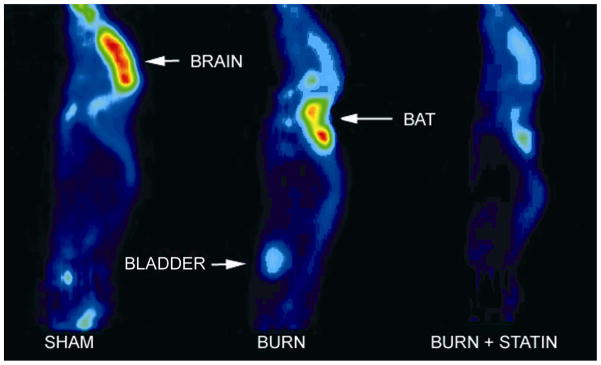
Representative 18FDG μPET images of a sham control mouse (A), a mouse with burn injury (B) and a burn injured mouse treated with simvastatin at a dose of 0.2 μg/g (C).
The results of oral glucose tolerance tests performed in burn injured mice, sham controls and burn injured mice treated with simvastatin at a dose of 0.2 μg/g are illustrated in Figure 5. Two-way ANOVA demonstrated highly significant effects of treatment, F2,168 = 56.33; p<0.0001, time F6,168 = 33.39; p<0.0001 and treatment by time interaction, F12,188= 1.89; p<0.05. At the first time point, blood glucose levels were higher in burned mice compared with sham treated controls (p<0.005) but levels in the burn and burn + simvastatin groups were not significantly different. At 5 min., glucose levels increased in all 3 groups of mice (burned vs. sham; p<0.02, burned vs. burned + simvastatin and burned + simvastatin vs. sham; p=NS). At 10 min., glucose levels increased further in all 3 groups (burned vs. sham; p<0.02, burned vs. burned + simvastatin; p<0.02, burned + simvastatin vs. sham; p=NS). At 15 min. there was a further increase in glucose levels (burned vs. sham; p<0.005, burned vs. burned + simvastatin; p<0.02, burned + simvastatin vs. sham; p=NS). At 30 min. there was a slight further increase in glucose levels (burned vs. sham; p<0.05, burned vs. burned + simvastatin; p<0.02, burned + simvastatin vs. sham; p=NS). Peak glucose levels appeared to be achieved in all groups of mice between 15 and 30 min. At 60 min. glucose levels decreased in all groups (burned vs. sham; p<0.05, burned vs. burned + simvastatin; p<0.02, burned + simvastatin vs. sham; p=NS). At the final time of measurement, glucose levels continued to decrease and the differences among all groups was statistically significant; most probably due to the low variance of the measurements at this time point (burned vs. sham; p<0.005, burned vs. burned + simvastatin; p<0.02, burned + simvastatin vs. sham; p<0.005).
Figure 5.

Oral glucose tolerance tests from burn injured mice, sham controls and burn injured mice treated with simvastatin at a dose of 0.02 and 0.2 μg/g. Each value is the mean ± sem for 6 animals. *p<0.05: burn vs sham and burn vs burn + statin; +p=NS: burn + statin vs sham; #p<0.01: burn + statin vs sham
An additional group of 5 mice with burn injury that were studied with a lower dose of simvastatin (0.02 μg/kg) yielded a similar but less pronounced effect. For the purpose of clarity, these results were not included in Figure 5.
AUCs for the curves in Figure 5, including the results of the low-dose simvastatin study, are illustrated in Figure 6. One-way ANOVA revealed a highly significant main effect of treatment, F3,36 = 8.10; p<0.0005. These data indicate that the AUC for the burned mice was significantly higher than for the sham controls (p<0.005) and the AUC for the burn + higher dose simvastatin group was significantly lower than the burn group (p<0.01). The AUC for the burn + lower dose simvastatin group tended to show a modest reduction compared to the burn group, however, the difference was not statistically significant (p=0.12). The AUCs for both simvastatin groups were not significantly different from the sham controls or each other.
Figure 6.

Glucose AUCs from oral glucose tolerance tests in burn injured mice, sham controls and burn injured mice treated with simvastatin at a doses of 0.2 μg/g. Each value is the mean ± sem for 6 animals. *p<0.01 vs. burn group, **p<0.001 vs. sham group; +p=NS vs. sham group.
Discussion
Statins were originally designed to inhibit production of cholesterol by the liver. However, subsequent to their introduction into clinical practice several additional actions have been identified. For example, statins have been shown to have a protective effect in patients with severe sepsis, as demonstrated by a significant reduction in mortality compared with patients not receiving statins (7) and in burned mice subjected to cecal ligation and puncture (9).
The present study clearly demonstrated the effects of statins in reducing burn injury induced alterations in glucose metabolism by brain, heart and BAT and their effect on improving glucose tolerance. It is not immediately clear why statins should also be involved in the correction of burn induced insulin resistance as evidenced by changes we observed in oral glucose tolerance tests, or the reduction in burn induced stimulation of 18FDG uptake by heart and BAT.
Severely burned and other critically ill patients exhibit insulin resistance which complicates their management. We have demonstrated that burn injury produces insulin resistance in mice (11), rats (12) and rabbits (unpublished results). These studies have demonstrated that hepatic production of glucose becomes resistant to insulin induced reduction in glucose production. Hence, one possible mechanism for statin mediated correction of burn induced insulin resistance may be related to alterations in hepatic glucose production after injury. We have also demonstrated that burn injury to mice results in increased phosphorylation of IRS-1 at serine residues, which would contribute, in part to the burn induced insulin resistance (11).
The effect statins in ameliorating insulin resistance in numerous other pathophysiological conditions have been reported in previous studies of human subjects and animals.
Guclu et al (14) studied the effects of pravastatin on insulin resistance in patients with metabolic syndrome and impaired glucose tolerance (IGT), using the Homeostasis Model Assessment (HOMA) test, insulin sensitivity indices and glucose half activation time (glucose t1/2). The study population consisted of 25 women who were diagnosed with metabolic syndrome. At baseline and 10 weeks after daily oral treatment with pravastatin (20 mg/daily), waist/hip circumference, body weight, arterial blood pressure, plasma glucose, total cholesterol, triglyceride, high density lipoprotein (HDL)-cholesterol, transaminases, glycosylated haemoglobin (A1C) and insulin level were measured and HOMA and insulin tolerance testing was performed after 12 h of fasting. After treatment with pravastatin, there were significant decreases in arterial blood pressure and baseline insulin levels. In contrast, there was an increase in insulin sensitivity and a decrease in glucose t1/2. Related to the improvement in these parameters, statistically significant decreases were also observed in HOMA, postprandial and fasting glucose levels and A1C values (P < 0.0001). These authors concluded that pravastatin treatment may be an effective approach for treating insulin resistance.
Lalli et al (15) examined the effect of lovastatin on insulin sensitivity and insulin signaling in liver and muscle of rats maintained on a high-fat diet (HFD) for 4 weeks. Their results indicated that lovastatin treatment resulted in a marked improvement in insulin sensitivity characterized by an increase in glucose disappearance rate during insulin tolerance tests. This increase in insulin sensitivity was associated with an increase in insulin-induced insulin receptor (IR) tyrosine phosphorylation and parallel decrease in IR serine phosphorylation and association with PTP1B. They also demonstrated that lovastatin treatment was associated with an increase in insulin-stimulated insulin receptor substrate (IRS) phosphatidylinositol 3-kinase/Akt pathway in the liver and muscle of HFD-fed rats in parallel with a decrease in the inflammatory pathway (c-jun N-terminal kinase and I kappa beta kinase (IKKbeta)/inhibitor of kappa B/nuclear factor kappa B) related to insulin resistance.
In another investigation, Naples et al (16) studied the effect of rosuvastatin treatment of insulin resistant hamsters to determine if this treatment can induce improvements in hepatic and whole body insulin sensitivity. Treatment with rosuvastatin at 10 mg/kg/day for 10 days significantly reduced fasting insulin (−59%) and triglyceride (−50%) levels in fructose-fed hamsters (p<0.05). Following an intraperitoneal (IP) glucose challenge, rosuvastatin-treated hamsters exhibited enhanced glucose clearance compared to untreated hamsters maintained on the high-fructose diet (area under curve (AUC) = 1,772 ± 223 mM min vs. 2,413 ± 253 mM min, respectively; p<0.002) with a significant reduction in 2h post-challenge glucose (n=5, p<0.02). Rosuvastatin-treatment also significantly improved sensitivity to an IP insulin challenge (AUC=314 ± 39 mM min vs. 195 ± 22 mM min for rosuvastatin-treated and fructose-fed hamsters, respectively; p<0.04, n=3). At the molecular level, significant increases in tyrosine-phosphorylation of the hepatic insulin receptor and IRS-1 were observed for rosuvastatin-treated hamsters (+37% and +58%, respectively) compared to fructose-fed controls following an intravenous (IV) bolus of insulin (p<0.05). Increases in insulin receptor and IRS-1 phosphorylation were also observed in muscle and adipose tissue. Analysis of hepatic Akt phosphorylation and mass revealed a small (25%) increase in serine phosphorylation of Akt with no significant change in Akt mass, although serine-phosphorylation and mass of Akt2 were significantly increased (+32%, p=0.03, and +42%, p=0.01, respectively). Interestingly, expression of PTP-1B, a key negative regulator of insulin signaling, showed a non-significant trend toward reduction in liver and was significantly reduced in adipose tissue (−20% and −37%, respectively). The authors suggested that statin-treatment increases whole body and peripheral tissue insulin sensitivity via improved cellular insulin signal transduction.
In another study, Abe et al (17) demonstrated that pravastatin did not increase plasma adiponectin levels although normal mice treated with pravastin did show such an increase. Adiponectin is an insulin sensitizing factor derived from adipocytes. When obese mice were treated with pravastitin, the increase in mRNA expression of proinflammatory genes, including MCP1 and Il-6 in adipose tissue was attenuated. It was pointed out that macrophages accumulate in adipose tissue with increased body weight and the levels of these cells correlated with measures of insulin resistance. Since macrophages in adipose tissue are the major source of pro-inflammatory cytokines, there may be a link between inflammation and insulin resistance, at least in obese mice. The authors suggested that it may be the anti-inflammatory effect of statin treatment that helps reduce insulin resistance in this model.
Inflammatory activity in fat tissue has recently been implicated in the mechanism (s) of insulin resistance and obesity-related metabolic dysfunction. In a recent study Vitseva et al (18) biopsied abnormal subcutaneous abdominal fat from 16 obese subjects (age 39 ± 11 years, BMI 49 ± 14 kg/m2) and studied Toll-like receptors (TLRs) which are know to play a key role in innate immune responses and are involved in the mechanisms of inflammation. Their findings demonstrated that TLRs are inducible in adipose tissue and are linked with downstream NF-κB activation and cytokine release. They also suggested that adipose stores may play a dynamic role in the regulation of inflammation and innate immunity in human subjects via modulation of the TLR/NF-κB regulatory pathway.
In vitro studies have demonstrated that statins are able to decrease the activation of NF-κB by increasing the expression of the NF-κB inhibitory protein IκB, resulting in reduced cytokine production (19) and therefore, for example, reduced iNOS expression and iNOS-mediated NO production (20). Very recently we observed that burn injury to mice leads to activation of NF-κB transcription in BAT in two different transgenic models (unpublished results). In this study, statin treatment reduced burn induced stimulation of NF-κB activation in BAT, as measured by luciferase activity. Whether the reduction in burn induced changes in glucose tolerance and NF-κB expression produced by statin treatment are related to a suppression of inflammation by statin could not be determined. Clearly, these issues require further investigation.
Acknowledgments
This study was supported in part by grants from the National Institutes of Health (2P50 GM21700-27A) and Shriners Hospitals for Children (#8540).
References
- 1.Carter E, Tompkins RG, Babich JW, Fischman AJ. Effect of thermal injury on uptake and phosphorylation of F-18 flurodeoxyglucose. J Nucl Med. 1994;34:175P. [Google Scholar]
- 2.Carter EA, Tompkins RG, Babich JW, Correia JA, Fischman AJ. Effects of thermal injury and modifiers of energy metabolism on FDG utilization by rat brain. J Nucl Med. 1995;36:205P. [Google Scholar]
- 3.Carter EA, Tompkins RG, Babich JW, Correia J, Fischman AJ. Decreased cerebral glucose utilization in rats during the ebb phase of thermal injury. J Trauma. 1996;40:930–935. doi: 10.1097/00005373-199606000-00011. [DOI] [PubMed] [Google Scholar]
- 4.Zhang Q, Carter EA, Ma B, Fischman AJ, Tompkins RG. Burn-related metabolic and signaling changes in rat brain. J Burn Care Res. 2008;29(2):346–352. doi: 10.1097/BCR.0b013e3181667387. [DOI] [PubMed] [Google Scholar]
- 5.Carter EA, Winter D, Tolman C, Tompkins RG, Fischman AJ. Burn induced changes in cerebral and myocardial glucose metabolism in rodents. J Nucl Med. 2009;50:1216P. [Google Scholar]
- 6.Chaudry MZ, Want JH, Blankson S, Redmond HP. Statin (cerivastatin) protects mice against sepsis-related death via reduced proinflammatory cytokines and enhanced bacterial clearance. Surgical Infections. 2008;9:183–194. doi: 10.1089/sur.2006.077. [DOI] [PubMed] [Google Scholar]
- 7.Dobesh PP, Klepser DG, McGuire TR, Morgan CW, Olsen KM. Reduction in mortality associated with statin therapy in patients with severe sepsis. Pharmacotherapy. 2009;29:621–630. doi: 10.1592/phco.29.6.621. [DOI] [PubMed] [Google Scholar]
- 8.Fogerty MD, Abumrad N, Efron D, Guy J, Barbul A. The effect of preinjury statin use on mortality and sepsis in elderly burn patients. J Trauma. doi: 10.1097/TA.0b013e3181df61b1. (in press) [DOI] [PubMed]
- 9.Beffa DC, Carter EA, Hamrahi VF, Yu YM, Fagan S, Sheridan RL, Fischman AJ, Tompkins RG. Simvastatin improves survival in murine gram negative burn sepsis. J Burn Care Res. 2007;28:S85. [Google Scholar]
- 10.Shinozaki S, Inoue Y, Yang W, Fukaya M, Carter EA, Yu YM, Fischman AJ, Tompkins RG, Kaneki M. Farnesyltransferase inhibitor improved survival following endotoxin challenge in mice. Biochem Biophys Res Commu. 2010;391(3):1459–1464. doi: 10.1016/j.bbrc.2009.12.094. [DOI] [PMC free article] [PubMed] [Google Scholar]
- 11.Zhang Q, Carter EA, Ma BY, White M, Fischman AJ, Tompkins RG. Molecular mechanism(s) of burn induced insulin resistance in murine skeletal muscle: role of IRS phosphorylation. Life Science. 2005;77(24):3068–3077. doi: 10.1016/j.lfs.2005.02.034. [DOI] [PubMed] [Google Scholar]
- 12.Carter EA, Burks D, Fischman AJ, White M, Tompkins RG. Insulin resistance in thermally injured rats is associated with post-receptor alterations in skeletal muscle, liver and adipose tissue. Int J Mol Med. 2004;14:653–658. [PubMed] [Google Scholar]
- 13.Tai C, Chatziioannou A, Siegel S, Young J, Newport D, Goble RN, Nutt RE, Cherry SR. Performance evaluation of the microPET P4: a PET system dedicated to animal imaging. Phys Med Biol. 2001;46(7):1845–1862. doi: 10.1088/0031-9155/46/7/308. [DOI] [PubMed] [Google Scholar]
- 14.Guclu F, Ozmen B, Hekimsoy Z, Kirmaz C. Effects of a statin group drug, pravastatin, on the insulin resistance in patients with metabolic syndrome. Biomed Pharmacother. 2004;58(10):614–618. doi: 10.1016/j.biopha.2004.09.005. [DOI] [PubMed] [Google Scholar]
- 15.Lalli CA, Pauli JR, Prada PO, Cintra DE, Ropelle ER, Velloso LA, Saad MJ. Statin modulates insulin signaling and insulin resistance in liver and muscle of rats fed a high-fat diet. Metabolism. 2009;57(1):57–65. doi: 10.1016/j.metabol.2007.07.021. [DOI] [PubMed] [Google Scholar]
- 16.Naples M, Federico LM, Xu E, Nelken J, Adeli K. Effect of rosuvastatin on insulin sensitivity in an animal model of insulin resistance: evidence for statin-induced hepatic insulin sensitization. Atherosclerosis. 2008;198(1):94–103. doi: 10.1016/j.atherosclerosis.2007.11.003. [DOI] [PubMed] [Google Scholar]
- 17.Abe M, Matsuda M, Kobayashi H, Miyata Y, Nakayama Y, Komuro R, Fukuhara A, Shimomura I. Effects of statins on adipose tissue inflammation: their inhibitory effect on MyD88-independent IRF3/IFN-β pathway in macrophages. Atherioscler Thromb Vasc Biol. 2008;28:871–877. doi: 10.1161/ATVBAHA.107.160663. [DOI] [PubMed] [Google Scholar]
- 18.Vitseva OI, Tanriverdi K, Tchkonia TT, Kirkland JL, McDonnell ME, Apovian CM, Freedman J, Gokce N. Inducible toll-like receptor and NF-κB regulatory pathway expression in human adipose tissue. Obesity. 2008;16:932–937. doi: 10.1038/oby.2008.25. [DOI] [PMC free article] [PubMed] [Google Scholar]
- 19.Zelvyte I, Dominaitiene R, Crisby M, Janciauskiene S. Modulation of inflammatory mediators and PPAR gamma and NF kappa B expression by pravastatin in response to lipoproteins in human monocytes in vitro. Pharmacol Res. 2002;45:147–154. doi: 10.1006/phrs.2001.0922. [DOI] [PubMed] [Google Scholar]
- 20.Giusti-Paiva A, Martinez MR, Felix JV, da Rocha MJ, Carnio EC, Elias LL, Antunes-Rodrigues J. Simvastatin decreases nitric oxide overproduction and reverts the impaired vascular responsiveness induced by endotoxic shock in rats. Shock. 2004;21:271–275. doi: 10.1097/10.shk.0000115756.74059.ce. [DOI] [PubMed] [Google Scholar]