

Abstract
The incidence of type-2 diabetes (T2D) and the burden it places on individuals, as well as society as a whole, compels research into the causes, factors and progression of this disease. Epidemiological studies suggest that chronic stress exposure may contribute to the development and progression of T2D in human patients. To address the interaction between chronic stress and the progression of T2D, we developed a dietary model of the prediabetic state in rats utilizing unlimited access to 30% sucrose solution (in addition to unlimited access to normal chow and water), which led to impaired glucose tolerance despite elevated insulin levels. We then investigated the effects of a chronic variable stress paradigm (CVS; twice daily exposure to an unpredictable stressor for 2 weeks) on metabolic outcomes in this prediabetic model. Chronic stress improved glucose tolerance in prediabetic rats following a glucose challenge. Importantly, pair-fed control groups revealed that the beneficial effect of chronic stress did not result from the decreased food intake or body weight gain that occurred during chronic stress. The present work suggests that chronic stress in rodents can ameliorate the progression of diet-induced prediabetic disease independent of chronic stress-induced decreases in food intake and body weight.
Keywords: chronic stress, glucose tolerance, type 2 diabetes, insulin
Introduction
The incidence of type-2 diabetes (T2D) in the United States is alarming. 25.8 million Americans have diabetes and 90–95% of those cases are T2D (Centers for Disease Control and Prevention, 2011). According to current statistics from the World Health Organization, 347 million people worldwide have diabetes and of those cases 90% are T2D. T2D is characterized by decreased glucose tolerance and reduced insulin sensitivity as well as pancreatic β cell dysfunction. The increased incidence of this disease is generally attributed to changes in lifestyle including increases in sedentary behavior and consumption of calorically-dense and sugar-laden foods. In addition, there exists a complex and equivocal relationship between stress and diabetes.
Stress is generally defined as a real or perceived threat to homeostasis or well-being (Ulrich-Lai and Herman, 2009). The physiological response to stress primarily involves activation of the hypothalamic-pituitary-adrenal (HPA) axis and the sympathetic nervous system. HPA axis activation leads to the production of glucocorticoids (e.g., cortisol in humans and corticosterone in rats); these hormones have numerous effects throughout the body, including actions on the liver and pancreas to promote the mobilization of stored energy (Cherrington, 1999). Similarly, activation of the sympathetic nervous system exerts numerous effects including increased heart rate, elevated blood pressure and energy mobilization (Ulrich-Lai and Herman, 2009).
Given that physiological responses to stress have profound effects on energy storage and mobilization, one might expect that stress exposure could play a role in the development and progression of metabolic disorders such as T2D (Ulrich-Lai and Ryan, 2014). However, clinical studies suggest that the effects of stress are variable and complex. Whereas some clinical studies report no effect of stress on glycemic control in T2D patients (Naliboff et al., 1985; Pibernik-Okanović et al., 1993; Roglić et al., 1993), other studies suggest that stress contributes to the progression of T2D and its complications, but that this may depend on factors such as the nature of the stressor and social support (Bradley, 1979; Duong et al., 2012; Faulenbach et al., 2012; Griffith et al., 1990; Manenschijn et al., 2013; Reynolds et al., 2010).
Given these clinical data, one might expect that chronic stress exposure in rats would impair glucose tolerance and contribute to the development of T2D. However, in the few studies that have addressed this question, researchers have generally observed that chronic stress ameliorates symptoms of T2D. Repeated immobilization stress improves glucose tolerance in Otsuka Long Evans Tokushima Fatty (OLETF) rats (Kai et al., 2000), and repeated restraint delays the development of hyperglycemia in Zucker diabetic fatty rats (Bates et al., 2008, 2007). Similarly, swim stress in deep or shallow water delays the progression of T2D in Zucker diabetic fatty rats (Király et al., 2007). Because these prior studies used genetic models of diabetes, they did not consider environmental (e.g., dietary) conditions that are thought to contribute to the development of T2D in humans (Consortium, 2013; Malik et al., 2010), raising the possibility that chronic stress may have different effects in a dietary model of prediabetes. Additionally, the reactivity of the HPA axis is increased in the Zucker diabetic fatty rats suggesting that this genetic model may not be ideal for stress studies (Guillaume-Gentil et al., 1990). Moreover, prior work used repeated exposure to a single type of stressor, which permits habituation of the physiologic stress responses (Bates et al., 2007; Herman et al., 1995), and, consequently, potentially alters the effects of stress exposure. Lastly, the observed improvements in T2D by chronic stress have been attributed to stress-induced reductions in food intake and body weight to varying degrees (Bates et al., 2008, 2007; Kai et al., 2000). Since glucocorticoids and sympathetic activation have the potential to act directly on peripheral tissues (e.g., liver and adipose tissue) to alter glucose metabolism (Cherrington, 1999), it is important to determine whether chronic stress can alter glucose tolerance independent from effects on food intake and body weight.
In order to address these critical factors, we first developed a dietary-model of “prediabetic” glucose intolerance, in which rats with free access to chow and water are given additional unlimited access to a 30% sucrose solution. This dietary paradigm was then combined with chronic variable stress (CVS), a well-characterized model of chronic stress in which rats are given twice-daily exposure to an unpredictable stressor, and which is designed to limit habituation of the stress response (Herman et al., 1995). Importantly, as CVS is known to decrease food intake and reduce body weight gain (Ulrich-Lai et al., 2006), factors that themselves could affect glucose tolerance, pair-fed control groups were included to directly test the extent to which chronic stress acts via reductions in food intake and body weight. We found that CVS attenuates the progression of prediabetes, and that it is independent of reduced food intake and body weight gain.
Methods
Animals
Adult male Long-Evans rats (250g) from Harlan (Indianapolis, IN) were allowed at least one week to acclimate to the facility prior to the experiments. They were housed individually and kept on a 12h light/dark cycle (0600–1800h lights on) with access to chow (LM-485; Harlan Teklad, Madison WI) and water in an Association for the Assessment and Accreditation of Laboratory Animal Care (AAALAC)-accredited facility. The University of Cincinnati (OLAW# A3295-01) Internal Animal Care and Use Committee approved all procedures according to the National Institutes of Health Guidelines.
Characterization of the dietary sucrose paradigm to induce glucose intolerance
Three groups of rats (n=12–13 per group) were given ad libitum access to chow and water and an additional bottle containing either 30% sucrose (MP Biomedicals, Solon,OH), 0.1% saccharin (Sigma-Aldrich, St.Louis, MO), or water. Food intake, body weight, and fluid intake from the second bottle were monitored.
Glucose tolerance tests (GTT) were conducted following both intraperitoneal (ip) injection (ipGTT) and oropharyngeal gavage (oGTT) of glucose to determine whether the effects of sucrose drink depend on oro-gastric glucose-induced incretins. The ipGTT was performed on Day 10 of drink exposure, while the oGTT was performed on Day 15 of drink exposure. In both cases, animals were fasted the night before GTT testing, and the following morning glucose (1.5 g/kg, 50% dextrose; Vedco Inc., Saint Joseph, MO) was administered. Blood was sampled from the tip of tail at 0, 15, 30, 45, 60 and 120 min following glucose administration for measurement of blood glucose (Freestyle blood glucose meters and strips; Abbott Diabetes Care Inc., Alameda, CA). Additional blood samples were collected in chilled EDTA-coated tubes at 1, 30 and 120 min following glucose administration for later measurement of plasma insulin by ELISA (Ultra Sensitive Rat Insulin ELISA; Crystal Chem Inc., Downers Grove, IL).
Effects of chronic variable stress on sucrose-induced glucose intolerance
Rats were weighed and nuclear magnetic resonance (NMR) (Echo MRI, Echo Medical Systems, Houston, TX) was used to determine body composition. Rats were divided into four groups (n=12–13 per group) matched for body weight and percent body fat (Day 0). On Day 1, all rats began having ad libitum access to 30% sucrose (MP Biomedicals), water and chow, which continued throughout the remainder of the study (until Day 21) to induce glucose intolerance as determined above. On Days 5–15, half of the rats were given CVS and half remained undisturbed in their home cages. Because CVS is known to decrease food intake and reduce body weight gain (Ulrich-Lai et al., 2006), which could themselves affect glucose tolerance, two groups of pair-fed controls were included. Group 3 (No CVS- food restriction) received the chow and sucrose drink in amounts equivalent to that consumed by the CVS- ad libitum group. This was approximately 11% less chow (since CVS decreased chow intake by 11%) with the same amount of sucrose (since CVS did not affect sucrose intake). Moreover, since food restriction itself could affect glucose tolerance (Escrivá et al., 1992), the fourth group received both CVS and food restriction. Specifically, these rats were offered 11% less chow and the same amount of sucrose drink as the CVS- ad libitum group. Since meal-feeding, in which food-restricted rats are given their daily food allotments once daily at a scheduled time, can affect glucose tolerance and thus confound experimental interpretation, we sought to minimize meal-feeding effects in the two food restriction groups (Vahl et al., 2010). Daily chow allotments were subdivided into a varying number of `meals' (between 1–3 per day) that were given at variable times of day (between 0900 – 1600h). Overall, this experimental design resulted in a 2×2 factorial design with one factor being the presence or absence of CVS and the other factor being the presence of absence of mild food restriction (approximately 11%). Body weight, food and sucrose intake were monitored throughout study.
CVS groups were exposed to twice-daily stressors on Days 5–15, as described previously (Ulrich-Lai et al., 2006). The types of stressors varied and were presented in an unpredictable order, with all CVS rats following the same schedule of stressor exposure. Stressors included: 30-min hypoxia (8% oxygen, 92% nitrogen), 1 h on a rotating platform (100 rpm), 1-h cold stress (4 °C), 10-min cold swim (16–18 °C), 20-min warm swim (31–33 °C), 30-min restraint, and 10 min in an open-field apparatus. The last stress exposure occurred on the afternoon of Day 15.
All rats were fasted on the evening of Day 15, and glucose tolerance was assessed by ipGTT on the morning of Day 16. An ipGTT was used since the prior experiment established that unlimited sucrose intake impaired both ip and oral glucose clearance (i.e., impaired glucose tolerance following unlimited sucrose intake did not depend on the incretin response to oro-gastric glucose). The ipGTT was performed with measurement of blood glucose and plasma insulin as described above, except that plasma insulin was measured at 1, 30, 60, and 120 min post-glucose injection. After the ipGTT all rats were returned to ad libitum access to chow and sucrose drink for the remainder of the experiment.
On Day 17, post-CVS body fat composition was assessed by NMR. On the afternoon of Day 21, undisturbed rats were sacrificed by rapid decapitation with collection of trunk blood for measurement of plasma hormones and cytokines. Care was taken to complete the collection procedure within 3 min of first disturbing the rats to ensure that hormone levels reflected the undisturbed state (Vahl et al., 2010). Blood was collected into EDTA containing tubes and spun (3000×g, 15 min at 4 °C) to separate plasma. Plasma was aliquotted and stored at −80 °C until analyzed. Radioimmunoassays (RIAs) were used to measure corticosterone (MP Biomedicals) and ACTH (as previously described (Jasper and Engeland, 1991)). Enzyme-linked immunosorbent assays (ELISAs) were used to measure adiponectin (Millipore, Billerica, MA), leptin (Chrystal Chem Inc), interleukin (IL)-1β, IL-6, and IL-10 (Life Technologies, Grand Island, NY). Carcasses were stored at −20 °C until they were dissected to separate pelt (skin with subcutaneous fat) from remaining carcass (with enclosed visceral fat), and NMR was used to determine the fat content of each portion to assess effects on body fat distribution.
Statistics
Data are depicted as mean ± SEM. Integrated glucose responses were calculated as the area-under-the-curve. Data were analyzed by ANOVA, with repeated measures when appropriate. Square root transform was applied if groups were not found to have homogeneous variance. Post-hoc analyses were performed by protected Fisher's post-hoc test. Spearman test was used for correlation analysis. Statistical significance was taken as p<0.05.
Results
Dietary sucrose induces glucose intolerance
To attempt to model a diet-induced `prediabetic' state, rats were given free access to normal chow, a water bottle, and a second bottle containing 30% sucrose solution for 14 d. Control groups received either 0.1% saccharin (a non-caloric sweetener) or water in their second bottle. During this time, rats gained comparable body weight (p=0.073; Figure 1A). As expected, rats drank more from the bottle (p<0.01) that contained either saccharin or sucrose than from the water bottle (Figure 1B). Chow intake was markedly reduced (p<0.01) in rats drinking sucrose (Figure 1C), likely to compensate for the calories consumed as sucrose (Rowland et al., 2005).
Figure 1.
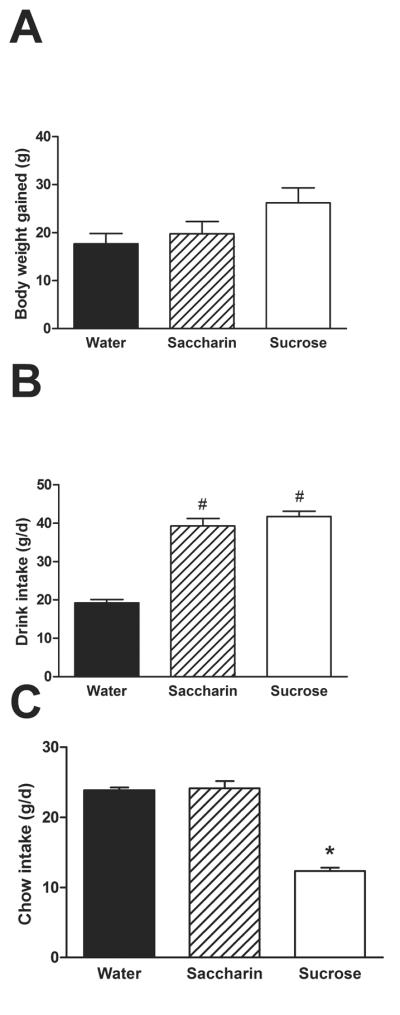
Rats with free access to normal chow and water, given additional free access to a second bottle containing either 30% sucrose, 0.1% saccharin, or water for 14d. (A) Drink type did not affect body weight gain. (B) Rats drank more from their second bottle when it contained sucrose or saccharin solution as opposed to water. (C) Rats given sucrose ate less chow. n = 12–13/group. Different letters denote statistical differences. #p<0.05 vs. water, *p<0.05 vs. both water and saccharin.
During the ipGTT on Day 10 of the dietary paradigm (Figure 2A) there was no main effect of drink type (p=0.064) on blood glucose, but a main effect of time (p<0.01) and a drink × time interaction (p=0.018). Post-hoc analysis revealed that sucrose-fed rats had elevated blood glucose levels at 45 and 60 min post-injection relative to both water and saccharin-fed rats. Sucrose increased the integrated glucose response relative to both water and saccharin (p=0.009; Figure 2B). The time course of the plasma insulin response (Figure 2C) was affected by drink type (p=0.003) and time post-injection (p<0.01), with no drink × time interaction (p=0.082). Post-hoc analysis revealed that sucrose increased both basal and post-injection plasma insulin levels relative to water and saccharin, and saccharin modestly increased plasma insulin relative to water at 30min.
Figure 2.

Glucose tolerance to an ip injection of glucose (1.5g/kg) is impaired by sucrose intake despite elevated insulin levels. In the ipGTT performed on Day 10 of drink exposure, both the time course of blood glucose levels (A) and the integrated incremental blood glucose (B) are increased in rats drinking sucrose relative to water or saccharin. (C) Plasma insulin levels are elevated in sucrose-fed rats before and after glucose injection. n = 9–12/group. Different letters denote statistical differences. #p<0.05 vs. water, *p<0.05 vs. both water and saccharin, $p<0.05 vs. saccharin.
To test for a potential role for the incretin response, an oGTT was also performed. During the oGTT on Day 15 of the dietary paradigm (Figure 3A) there was no main effect of drink type (p=0.79) on blood glucose, but a main effect of time (p<0.001) and a drink × time interaction (p=0.018). Post-hoc analysis revealed that sucrose-fed rats had elevated blood glucose levels at 15 and 30 min post-injection relative to both water and saccharin-fed rats. Drink type affected the integrated blood glucose response (p=0.020), with sucrose increasing the response relative to both water and saccharin (Figure 3B). The time course of the plasma insulin response (Figure 3C) was also affected by drink type (p=0.001) and time post-injection (p<0.001), with no drink × time interaction (p=0.13). Post-hoc analysis revealed that sucrose increased both basal and post-injection plasma insulin levels relative to water and saccharin, and saccharin modestly increased plasma insulin relative to water at 30 min.
Figure 3.

Glucose tolerance to an oral gavage of glucose is impaired by sucrose intake despite elevated insulin levels. In the oGTT performed on Day 15 of drink exposure, both the time course of blood glucose levels (A) and the integrated incremental blood glucose (B) are increased in rats drinking sucrose relative to water or saccharin. Moreover, plasma insulin levels are elevated in sucrose-fed rats before and after glucose injection (C). n = 12–13/group. Different letters denote statistical differences. #p<0.05 vs. water, *p<0.05 vs. both water and saccharin.
Effects of chronic variable stress on body weight, chow intake and sucrose intake
To determine whether chronic stress affects the development of T2D, rats were made `prediabetic' using the same dietary paradigm while receiving CVS exposure (vs. no CVS controls). Since CVS decreases chow intake and reduces body weight gain (Ulrich-Lai et al., 2006), consequences which could themselves affect glucose tolerance, two groups of pair-fed controls were included. Specifically, the chow and sucrose intake of the third treatment group (No CVS- food restriction) was limited to that consumed by the CVS- ad libitum group. Moreover, since this mild food restriction itself could affect glucose tolerance (Escrivá et al., 1992), the fourth treatment group (CVS-food restriction) received both CVS and a mild food restriction so that their intake was limited to the same extent.
As expected, both CVS and mild food restriction reduced body weight (Figure 4A). The amount of body weight gained over Days 5–15 (the period of CVS and/or mild chow restriction; Figure 4B) was affected by CVS (p<0.001), and mild food restriction (p<0.001), with no CVS × food restriction interaction (p=0.97). Post-hoc analysis revealed that CVS reduces body weight gain (~ 20 g) regardless of mild food restriction, while mild food restriction also reduces body weight gain (~ 7 g) regardless of CVS.
Figure 4.

Chronic variable stress (CVS) decreased body weight gain relative to rats not receiving CVS (NOCVS) regardless of whether rats were consuming chow and 30% sucrose solution in unlimited (ad libitum; AL) or mildly food-restricted (FR; chow restricted to match the 11% reduction in chow intake observed in CVS-AL rats) amounts. (A) Body weight throughout the duration of the experiment, and (B) the change in body weight that occurred from days 5 to 15 (the period of CVS and/or mild FR) show that body weight gain is reduced by both CVS and mild FR. (C) Chow intake throughout the experiment shows that CVS decreased chow intake, and that mild food restriction reproduced the same extent of reduced chow intake. Moreover, once all rats were returned to ad libitum food access on Day 15, rats with prior FR ate more chow than those without FR regardless of CVS history. (D) Sucrose intake was not affected by CVS, thus the FR groups were given the same amount of sucrose that the CVS-AL rats consumed, resulting in no differences in sucrose intake among the treatment groups. n = 12–13/group. Different letters denote statistical differences. #p<0.05 vs. AL, *p<0.05 vs. NOCVS.
Chow intake (Figure 4C) was affected by time (p<0.001) with significant CVS × time (p=0.029) and food restriction × time (p<0.001) interactions (there were no main effects of CVS (p=0.26) or food restriction (p=0.37) nor any other interactive effects (p>0.5 for all)). Post-hoc analysis revealed that CVS (Days 5–15) decreased chow intake, and that mild food restriction reproduced the same extent of reduced chow intake such that the `NO CVS-food restricted' and `CVS-food restricted' groups each ate 11% less chow (and drank identical amounts of sucrose) than their respective ad libitum groups. Moreover, once all rats were returned to ad libitum food access on Day 15, rats with prior food restriction ate more chow than those without prior food restriction regardless of CVS history likely in an attempt to recover to their defended body weight (Levin and Dunn-meynell, 2000).
Sucrose intake (Figure 4D) was affected by time (p=0.008), but not by CVS (p=0.080) or mild food restriction (p=0.082), and there were no interactive effects (p>0.18 for all), indicating that the CVS did not affect sucrose intake in rats with ad libitum access to chow and 30% sucrose. As such, the mild food-restriction rats were offered sucrose drink in amounts matched to the sucrose intake of the ad libitum CVS group, (i.e., they were offered and consumed the full amount of sucrose such that the net extent of sucrose restriction in food restricted rats compared to ad libitum rats was 0%). This resulted in no differences in sucrose intake among the four treatment groups throughout the duration of the experiment.
Effects of chronic variable stress on sucrose-induced glucose intolerance
The ipGTT given on Day 16 (i.e., the day after completion of CVS and/or mild food restriction) revealed that CVS rats had overall improved glucose tolerance. Blood glucose levels immediately prior to and after glucose injection (Figure 5A) revealed main effects of CVS (p=0.016) and time (p<0.001), with no effect of mild food restriction (p=0.66) and a CVS × time interaction (p=0.027) with no other interactive effects (p>0.16 for all). Post-hoc analysis revealed that the CVS-induced reduction in blood glucose levels occurred primarily in the ad libitum rats at 30, 45 and 60 min post-injection. CVS similarly reduced the integrated incremental blood glucose response (Figure 5B), in which there was a main effect of CVS (p=0.002), but no effect of mild food restriction (p=0.76) and no CVS × food restriction interaction (p=0.40). Again, post-hoc analysis revealed that the CVS-induced reduction in integrated blood glucose levels occurred primarily in the ad libitum rats.
Figure 5.

Clearance of an injected (ip) glucose bolus was improved in rats with a history of CVS regardless of mild food restriction. For rats with access to chow, a water bottle, and a second bottle containing 30% sucrose, both the time course of blood glucose levels (A) and the integrated incremental blood glucose (B) were reduced in rats that received CVS, and unaffected by mild food restriction. Similarly, both the time course of plasma insulin levels (C) and the integrated incremental plasma insulin (D) were reduced in rats that received CVS, and unaffected by mild food restriction. n = 8–13/group. *p<0.05 vs. NOCVS. CVS and mild food restriction did not affect overall body adiposity, however CVS shifted fat to a more visceral distribution. For rats with access to chow, a water bottle, and a second bottle containing 30% sucrose, (E) percent body fat increased between experiment onset (Pre) and day 17 (Post; after completion of CVS and/or mild food restriction and the Day 16 ipGTT), and this increase was unaffected by a history of CVS or mild food restriction. #p<0.05 vs. Pre. (F) Percentage of total body fat stored in the viscera was increased by CVS and unaffected by mild food restriction. n = 12–13/group. *p<0.05 vs. NOCVS.
The time course of the plasma insulin response (Figure 5C) revealed a main effect of time (p<0.001) and a CVS × time interaction (p<0.001), but no effect of mild food restriction (p=0.247) and no other interactions (p>0.38 for all). Post-hoc analysis revealed that CVS reduced the plasma insulin response at 60 min post-injection, and this occurred in both ad libitum and food restricted rats. CVS similarly reduced the integrated incremental plasma insulin response (Figure 5D). There was a main effect of CVS (p=0.003), but no effect of mild food restriction (p=0.44) and no CVS × food restriction interaction (p=0.10). Post-hoc analysis revealed that the CVS-induced reduction in integrated plasma insulin levels occurred primarily in the ad libitum rats.
Effects of chronic variable stress on body composition
The percent body fat (Figure 5E) was affected by time (p<0.001) but not by CVS (p=0.55) or mild food restriction (p=0.99), with no interactive effects (p>0.27 for all). Post-hoc analysis revealed that percent body fat increased throughout the experiment in all treatment groups.
After termination of the experiment on Day 21, carcasses were pelted to determine the proportion of total body fat stored in the viscera (Figure 5F). The percentage of body fat stored in the viscera was increased by CVS (p=0.029), but not affected by mild food restriction (p=0.98), with no CVS × food restriction interaction (p=0.43). Post-hoc analysis revealed that the CVS-induced increase in visceral distribution occurred primarily in ad libitum rats.
Effects of chronic variable stress on terminal metabolic hormone levels
On Day 21, plasma ACTH was not affected by a history of CVS (p=0.81), or mild food restriction (p=0.076), with no CVS × food restriction interaction (p=0.87; Table 1). Plasma corticosterone was not affected by CVS (p=0.26), or mild food restriction (p=0.99), with no CVS × food restriction interaction (p=0.11; Table 1). Plasma leptin was not affected by CVS (p=0.72), or mild food restriction (p=0.09), with no CVS × food restriction interaction (p=0.43; Table 1). Plasma adiponectin was not affected by CVS (p=0.62), or mild food restriction (p=0.22), with no CVS × food restriction interaction (p=0.68; Table 1). Plasma leptin and adiponectin positively and significantly correlated with terminal body weight (p=0.0099 for leptin and p=0.0270 for adiponectin). Lastly, plasma IL-6, IL1β and IL-10 were below the minimum detection level of the respective assays in all groups.
Table 1.
Basal plasma hormone levels in rats consuming a chow/sucrose diet are unaltered by a prior history of chronic variable stress (CVS) and/or mild food restriction (FR).
| NOCVS-AL (n=13) | CVS-AL (n=12) | NOCVS-FR (n=13) | CVS-FR (n=12) | |
|---|---|---|---|---|
| ACTH (pg/ml) | 38.7 ± 7.3 | 39.2 ± 5.1 | 49.3 ± 6.9 | 51.9 ± 5.7 |
| Corticosterone (ng/ml) | 197 ± 53 | 177 ± 33 | 129 ± 31 | 245 ± 45 |
| Leptin (ng/ml) | 5.9 ± 0.4 | 5.5 ± 0.5 | 6.1 ± 0.5 | 5.0 ± 0.3 |
| Adiponectin (ng/ml) | 2.1 ± 0.3 | 2.4 ± 0.5 | 2.7 ± 0.4 | 2.7 ± 0.3 |
Data are shown as mean ± SEM. Samples were collected at 13:00 h on day 21 from fed rats. There are no statistical differences.
Discussion
We generated a dietary model of the prediabetic state in rats. Animals were given ad libitum access to 30% sucrose, which after a brief time caused impaired glucose tolerance despite elevated insulin levels, mimicking the prediabetic state. As stress may be linked with the progression of diabetes in human patients, we investigated the effects of chronic stress on metabolic outcomes in sucrose-fed rats. Chronic stress improved glucose tolerance in prediabetic rats independent of the chronic stress-induced reductions in food intake and body weight gain. This finding suggests that chronic stress can attenuate prediabetes disease progression.
Sucrose intake is linked with the development of T2D in humans (Consortium, 2013; Malik et al., 2010), suggesting that unlimited sucrose intake may be an ethologically-relevant approach to model the prediabetic state in experimental animals. As such, the present work nicely characterizes a dietary model of the prediabetic state with rats having free access to sucrose in addition to normal chow and water and with appropriate controls. Rats with sucrose access drank readily and compensated for the increased caloric input from sucrose by decreasing their chow intake resulting in no overall effect on body weight for the duration of the experiment. After only 9–14 d of drinking sucrose, blood glucose and plasma insulin were both increased following both ipGTT and oGTT compared to controls. Thus, animals given free access to sucrose develop a prediabetic phenotype with decreased glucose tolerance despite elevated insulin levels and presumed insulin resistance (Abdul-Ghani, 2006). Moreover, similar results for the ipGTT and oGTT suggest that impaired glucose tolerance following unlimited sucrose intake does not depend on the incretin response to oro-gastric glucose. Notably, this glucose intolerance occurred despite an equivalent body weight, suggesting that this paradigm may be ideal for studying factors that contribute to the development of T2D independent from increased body weight. Previously, a similar prediabetic model with 9-weeks access to a 35% sucrose solution also resulted in hyperinsulinemia and impaired glucose tolerance (Nunes et al., 2013). The present findings demonstrate that these characteristics can emerge at shorter durations of sucrose exposure, which may be particularly important when a shortened experimental time course is needed. Overall, the present work characterizes an ethologically-relevant, diet-based model of the prediabetic state in rats, in which glucose intolerance develops quickly and occurs without accompanying increases in body weight. We expect that this model will be useful for investigating factors and mechanisms that influence the development of T2D, particularly those that are independent from increases in body weight.
Using this newly characterized model, we assessed the effect of chronic stress on the progression of the prediabetic phenotype. CVS exposure improved glucose clearance in an ipGTT, and it was accomplished with lowered plasma insulin. Importantly, the beneficial effects of CVS were not due to changes in fasting basal or peak levels of glucose or insulin, but rather to a faster subsequent clearance of the glucose. Thus, these findings suggest that CVS may be protective against sucrose-induced prediabetes. This finding is consistent with previous reports using genetic models of T2D and other types of chronic stress. For instance, repeated immobilization delayed the progression of T2D in OLETF rats (Kai et al., 2000), as did repeated restraint or swim stress in ZDF rats (Bates et al., 2008, 2007; Király et al., 2007). This suggests that the beneficial effects of chronic stress occur across different models of T2D. Moreover, these improvements occur regardless of whether habituating repeated stress or non-habituating variable stress paradigms are used. Collectively, this work strongly suggests that some forms of chronic stress retard the development of T2D in rodents.
The mechanism by which chronic stress improves glucose tolerance in rodents is not known. However, chronic stress has numerous effects on the brain and body many of which have the potential to influence glucose metabolism, including decreased food intake and body weight gain, increased sympathetic and HPA activity, increased inflammation, and increased visceral fat deposition. As with previous CVS studies, animals exposed to CVS had decreased body weight gain compared to no CVS controls (Ulrich-Lai et al., 2006). CVS animals ate less chow and maintained sucrose intake at pre-CVS levels. Nonetheless, the inclusion of pair-fed controls demonstrated that a mild food restriction equivalent to the extent of CVS-induced anorexia was not sufficient to improve glucose tolerance. Moreover, CVS-induced reductions in body weight gain are unlikely to contribute since mild food restriction similarly reduced body weight without improving glucose tolerance. Percent body fat increased to the same extent in all treatment groups, suggesting that improved glucose tolerance by CVS was not secondary to reductions in body fat. In addition, CVS increased the percentage of total body fat stored in the viscera. However, increased visceral adiposity is linked with worsened glucose tolerance (Foster et al., 2013), so one would expect that this fat distribution may have actually limited the CVS-induced improvements. Taken together, our data suggest that improved glucose tolerance by CVS is not mediated via CVS-induced anorexia or reductions in body weight or adiposity.
Chronic stress also increases sympathetic and HPA tone (Ulrich-Lai and Herman, 2009), and the sympathetic and HPA systems profoundly influence energy metabolism, suggesting that they are possible mediators of the metabolic changes that occur following chronic stress. Moreover, this CVS paradigm is known to elicit repeated episodes of HPA and sympathetic activation that accompany each stressor exposure (Flak et al., 2011; Herman et al., 1995; Ulrich-Lai and Herman, 2009). However, epinephrine and glucocorticoids typically decrease glucose tolerance (Deibert and DeFronzo, 1980; Fransson et al., 2014), suggesting that such episodes of HPA and sympathetic activation are unlikely to mediate improvements in glucose clearance. Moreover, the present data demonstrate that the CVS paradigm did not produce enduring changes in basal HPA tone, as neither ACTH nor corticosterone were altered at 6 days following the end of CVS. Taken together, this suggests that neither altered basal nor stressor-evoked HPA and sympathetic tone are likely to mediate CVS-induced improvements in glucose tolerance.
The progression of glucose intolerance and T2D can be affected by metabolic hormones. For instance, leptin and adiponectin provide feedback from adipocytes to the brain to influence energy intake and expenditure and improve glucose tolerance (Rosen and Spiegelman, 2006). It is possible that CVS may alter levels of these regulatory hormones thereby improving metabolic outcomes. However, measurement of leptin and adiponectin in the plasma collected at the end of the experiment indicated no differences between groups, suggesting that CVS does not have enduring effects on these metabolic hormones. (Note- CVS may have altered leptin and adiponectin at earlier time points, but if so, these effects did not persist through the end of the experiment). Both leptin and adiponectin levels correlated significantly with terminal body weights, suggesting that these metabolic hormones may be relative to overall body size (Cnop et al., 2003; Iwamoto et al., 2011; Mastronardi et al., 2002; Smith et al., 2006). As discussed above, the effects of CVS on glucose clearance were not secondary to effects on body size/adiposity, suggesting that leptin and adiponectin are unlikely to be the means by which CVS improves glucose management. However, future work can address this possibility more directly.
The mechanisms by which chronic stress improves glucose tolerance in prediabetic rodents remain elusive, particularly since stress in T2D patients does not improve disease outcomes. However, a cumulative history of higher glucocorticoid exposure during chronic stress in rodents (relative to people) could provide for a greater net glucocorticoid action. These high levels of glucocorticoids may be protective in part due to their anti-inflammatory actions. The prediabetic state induces a pro-inflammatory environment. Cytokines such as IL-6 and IL-1β have been implicated as potential sources of damage to pancreatic β-cells or as means to lead to damaging neuroinflammation increasing the risk of developing T2D (Alexandraki et al., 2006; De Souza et al., 2005; Kleinridders et al., 2009; Zhang et al., 2008; Ziegler, 2005). Indeed, prediabetic patients may benefit from salicylate treatment, an aspirin derivative with anti-inflammatory effects (Faghihimani et al., 2012). High glucocorticoid levels as a result of CVS could help to blunt this inflammatory response. This suggests that protection from T2D by chronic stress in rodents may occur via reduced inflammatory processes. Circulating cytokines were not detectable in the present work suggesting that systemic inflammation likely does not occur in sucrose-fed rats at this time point. We conclude that chronic stress did not improve glucose tolerance in the present work via reducing systemic inflammation. However, future work is needed to determine whether chronic stress acts via reducing inflammatory processes at other time points, involving other inflammatory pathways or occurring on a more localized scale (in brain or peripheral tissues) rather than systemic circulation.
During periods of chronic stress, people have highly variable responses, with many people eating less food and losing weight, while others over-eat and gain weight, and still others have no net change in body weight (Epel et al., 2004; Oliver and Wardle, 1999; Torres and Nowson, 2007; Weinstein et al., 1997). This high degree of variance is mirrored in the clinical research, in which the effects of stress on glucose tolerance seem to depend on numerous factors, including the individual and the type of stress (Bradley, 1979; Duong et al., 2012; Faulenbach et al., 2012; Griffith et al., 1990; Manenschijn et al., 2013; Naliboff et al., 1985; Pibernik-Okanović et al., 1993; Reynolds et al., 2010; Roglić et al., 1993). The present data from experimental rats seems to resemble the segment of the population that responds to stress by eating less and losing weight, suggesting that this work may have particularly important implications for this segment of the population (Dallman et al., 2003; Ulrich-Lai and Ryan, 2014).
In summary, this work puts forth a dietary model of the prediabetic state in rats induced by unlimited access to sucrose. The model can be utilized to further investigate the factors leading to the development of T2D. Employing this model, we found that chronic stress appears beneficial and improves metabolic outcomes such as glucose tolerance and insulin resistance. Mechanistically, the beneficial effect of CVS was not due to CVS-induced improvements in body weight, food intake, adiposity, visceral fat deposition, adipokines, or circulating cytokines. Although these results may seem surprising given the suggested associations between stress and T2D progression in humans (Duong et al., 2012; Faulenbach et al., 2012; Manenschijn et al., 2013; Reynolds et al., 2010), they provide an opportunity for discovery. Identifying and capitalizing on the beneficial aspects of the CVS paradigm could lead to new treatments or medical recommendations for prediabetic patients.
Acknowledgements
The authors thank Christal Holloway, Amanda Jones and Samantha Peña for their technical assistance. Dr. William C. Engeland, PhD (University of Minnesota) generously provided the antiserum for the ACTH radioimmunoassay.
Grants This work was supported by K01 DK078906 (YMU) and R01 DK091425 (YMU).
Footnotes
Publisher's Disclaimer: This is a PDF file of an unedited manuscript that has been accepted for publication. As a service to our customers we are providing this early version of the manuscript. The manuscript will undergo copyediting, typesetting, and review of the resulting proof before it is published in its final citable form. Please note that during the production process errors may be discovered which could affect the content, and all legal disclaimers that apply to the journal pertain.
Author Contributions Amy E. B. Packard performed experiments, interpreted data, and wrote the manuscript
Sriparna Ghosal performed experiments, analyzed data, and edited the manuscript
James P. Herman interpreted data and edited the manuscript
Stephen C. Woods interpreted data and edited the manuscript
Yvonne M. Ulrich-Lai planned and performed experiments, interpreted data, and wrote and edited the manuscript
Disclosures We have no conflicts of interest to disclose.
References
- Abdul-Ghani M. a. Contributions of Cell Dysfunction and Insulin Resistance to the Pathogenesis of Impaired Glucose Tolerance and Impaired Fasting Glucose. Diabetes Care. 2006;29:1130–1139. doi: 10.2337/diacare.2951130. doi:10.2337/dc05-2179. [DOI] [PubMed] [Google Scholar]
- Alexandraki K, Piperi C, Kalofoutis C, Singh J, Alaveras A, Kalofoutis A. Inflammatory process in type 2 diabetes: The role of cytokines. Ann. N. Y. Acad. Sci. 2006;1084:89–117. doi: 10.1196/annals.1372.039. doi:10.1196/annals.1372.039. [DOI] [PubMed] [Google Scholar]
- Bates HE, Kiraly M. a, Yue JTY, Goche Montes D, Elliott ME, Riddell MC, Matthews SG, Vranic M. Recurrent intermittent restraint delays fed and glucose tolerance tests in the Zucker diabetic fatty rat--role of food intake and corticosterone. Metabolism. 2007;56:1065–75. doi: 10.1016/j.metabol.2007.03.015. doi:10.1016/j.metabol.2007.03.015. [DOI] [PubMed] [Google Scholar]
- Bates HE, Sirek AS, Kiràly M. a, Yue JTY, Goche Montes D, Matthews SG, Vranic M. Adaptation to mild, intermittent stress delays development of hyperglycemia in the Zucker diabetic Fatty rat independent of food intake: role of habituation of the hypothalamic-pituitary-adrenal axis. Endocrinology. 2008;149:2990–3001. doi: 10.1210/en.2007-1473. doi:10.1210/en.2007-1473. [DOI] [PubMed] [Google Scholar]
- Bradley C. Life events and the control of diabetes mellitus. J. Psychosom. Res. 1979;23:159–162. doi: 10.1016/0022-3999(79)90021-7. [DOI] [PubMed] [Google Scholar]
- Centers for Disease Control, Prevention National Diabetes Fact Sheet: national estimates and general information on diabetes and prediabetes in the United States. Centers Dis. Control Prev. 2011 [Google Scholar]
- Cherrington A. Control of glucose uptake and release by the liver in vivo. Diabetes. 1999;48:1198–1214. doi: 10.2337/diabetes.48.5.1198. [DOI] [PubMed] [Google Scholar]
- Cnop M, Havel PJ, Utzschneider KM, Carr DB, Sinha MK, Boyko EJ, Retzlaff BM, Knopp RH, Brunzell JD, Kahn SE. Relationship of adiponectin to body fat distribution, insulin sensitivity and plasma lipoproteins: evidence for independent roles of age and sex. Diabetologia. 2003;46:459–69. doi: 10.1007/s00125-003-1074-z. doi:10.1007/s00125-003-1074-z. [DOI] [PubMed] [Google Scholar]
- Consortium TI. Consumption of sweet beverages and type 2 diabetes incidence in European adults: results from EPIC-InterAct. Diabetologia. 2013;56:1520–30. doi: 10.1007/s00125-013-2899-8. doi:10.1007/s00125-013-2899-8. [DOI] [PubMed] [Google Scholar]
- Dallman MF, Pecoraro N, Akana SF, La Fleur SE, Gomez F, Houshyar H, Bell ME, Bhatnagar S, Laugero KD, Manalo S. Chronic stress and obesity: a new view of “comfort food”. Proc. Natl. Acad. Sci. U. S. A. 2003;100:11696–701. doi: 10.1073/pnas.1934666100. doi:10.1073/pnas.1934666100. [DOI] [PMC free article] [PubMed] [Google Scholar]
- De Souza CT, Araujo EP, Bordin S, Ashimine R, Zollner RL, Boschero AC, Saad M.J. a, Velloso L. a. Consumption of a fat-rich diet activates a proinflammatory response and induces insulin resistance in the hypothalamus. Endocrinology. 2005;146:4192–9. doi: 10.1210/en.2004-1520. doi:10.1210/en.2004-1520. [DOI] [PubMed] [Google Scholar]
- Deibert DC, DeFronzo R. a. Epinephrine-induced insulin resistance in man. J. Clin. Invest. 1980;65:717–21. doi: 10.1172/JCI109718. doi:10.1172/JCI109718. [DOI] [PMC free article] [PubMed] [Google Scholar]
- Duong M, Cohen JI, Convit A. High cortisol levels are associated with low quality food choice in type 2 diabetes. Endocrine. 2012;41:76–81. doi: 10.1007/s12020-011-9527-5. doi:10.1007/s12020-011-9527-5. [DOI] [PMC free article] [PubMed] [Google Scholar]
- Epel E, Jimenez S, Brownell K, Stroud L, Stoney C, Niaura R. Are stress eaters at risk for the metabolic syndrome? Ann. N. Y. Acad. Sci. 2004;1032:208–10. doi: 10.1196/annals.1314.022. doi:10.1196/annals.1314.022. [DOI] [PubMed] [Google Scholar]
- Escrivá F, Rodríguez C, Cacho J, Alvarez C, Portha B, Pascual-Leone a M. Glucose utilization and insulin action in adult rats submitted to prolonged food restriction. Am. J. Physiol. 1992;263:E1–7. doi: 10.1152/ajpendo.1992.263.1.E1. [DOI] [PubMed] [Google Scholar]
- Faghihimani E, Aminorroaya A, Rezvanian H, Adibi P, Ismail-Beigi F, Amini M. Reduction of insulin resistance and plasma glucose level by salsalate treatment in persons with prediabetes. Endocr. Pract. 2012;18:826–33. doi: 10.4158/EP12064.OR. doi:10.4158/EP12064.OR. [DOI] [PubMed] [Google Scholar]
- Faulenbach M, Uthoff H, Schwegler K, Spinas G. a, Schmid C, Wiesli P. Effect of psychological stress on glucose control in patients with Type 2 diabetes. Diabet. Med. 2012;29:128–31. doi: 10.1111/j.1464-5491.2011.03431.x. doi:10.1111/j.1464-5491.2011.03431.x. [DOI] [PubMed] [Google Scholar]
- Flak JN, Jankord R, Solomon MB, Krause EG, Herman JP. Opposing effects of chronic stress and weight restriction on cardiovascular, neuroendocrine and metabolic function. Physiol. Behav. 2011;104:228–34. doi: 10.1016/j.physbeh.2011.03.002. doi:10.1016/j.physbeh.2011.03.002. [DOI] [PMC free article] [PubMed] [Google Scholar]
- Foster MT, Softic S, Caldwell J, Kohli R, de Kloet a D., Seeley RJ. Subcutaneous Adipose Tissue Transplantation in Diet-Induced Obese Mice Attenuates Metabolic Dysregulation While Removal Exacerbates It. Physiol. Rep. 2013;1:1–12. doi: 10.1002/phy2.15. doi:10.1002/phy2.15. [DOI] [PMC free article] [PubMed] [Google Scholar]
- Fransson L, Dos Santos C, Wolbert P, Sjöholm A, Rafacho A, Ortsäter H. Liraglutide counteracts obesity and glucose intolerance in a mouse model of glucocorticoid-induced metabolic syndrome. Diabetol. Metab. Syndr. 2014;6:3. doi: 10.1186/1758-5996-6-3. doi:10.1186/1758-5996-6-3. [DOI] [PMC free article] [PubMed] [Google Scholar]
- Griffith LS, Field BJ, Lustman PJ. Life stress and social support in diabetes: association with glycemic control. Int. J. Psychiatry Med. 1990;20:365–72. doi: 10.2190/APH4-YMBG-NVRL-VLWD. [DOI] [PubMed] [Google Scholar]
- Guillaume-Gentil C, Rohner-Jeanrenaud F, Abramo F, Bestetti GE, Rossi GL, Jeanrenaud B. Abnormal regulation of the hypothalamo-pituitary-adrenal axis in the genetically obese fa/fa rat. Endocrinology. 1990;126:1873–9. doi: 10.1210/endo-126-4-1873. doi:10.1210/endo-126-4-1873. [DOI] [PubMed] [Google Scholar]
- Herman JP, Adams D, Prewitt C. Regulatory changes in neuroendocrine stress-integrative circuitry produced by a variable stress paradigm. Neuroendocrinology. 1995;61:180–90. doi: 10.1159/000126839. [DOI] [PubMed] [Google Scholar]
- Iwamoto J, Takeda T, Sato Y, Matsumoto H. Serum leptin concentration positively correlates with body weight and total fat mass in postmenopausal Japanese women with osteoarthritis of the knee. Arthritis. 2011;2011:580632. doi: 10.1155/2011/580632. doi:10.1155/2011/580632. [DOI] [PMC free article] [PubMed] [Google Scholar]
- Jasper M, Engeland W. Synchronous ultradian rhythms in adrenocortical secretion detected by microdialysis in awake rats. Am. J. Physiol. 1991;261:R1257–R1268. doi: 10.1152/ajpregu.1991.261.5.R1257. [DOI] [PubMed] [Google Scholar]
- Kai K, Morimoto I, Morita E, Okada Y, Yamamoto S, Kanda K, Uriu K, Eto S. Environmental stress modifies glycemic control and diabetes onset in type 2 diabetes prone Otsuka Long Evans Tokushima Fatty (OLETF) rats. Physiol. Behav. 2000;68:445–52. doi: 10.1016/s0031-9384(99)00187-0. [DOI] [PubMed] [Google Scholar]
- Király M. a, Bates HE, Yue JTY, Goche-Montes D, Fediuc S, Park E, Matthews SG, Vranic M, Riddell MC. Attenuation of type 2 diabetes mellitus in the male Zucker diabetic fatty rat: the effects of stress and non-volitional exercise. Metabolism. 2007;56:732–44. doi: 10.1016/j.metabol.2006.12.022. doi:10.1016/j.metabol.2006.12.022. [DOI] [PubMed] [Google Scholar]
- Kleinridders A, Schenten D, Könner a C., Belgardt BF, Mauer J, Okamura T, Wunderlich FT, Medzhitov R, Brüning JC. MyD88 signaling in the CNS is required for development of fatty acid-induced leptin resistance and diet-induced obesity. Cell Metab. 2009;10:249–59. doi: 10.1016/j.cmet.2009.08.013. doi:10.1016/j.cmet.2009.08.013. [DOI] [PMC free article] [PubMed] [Google Scholar]
- Levin BE, Dunn-meynell AA. Defense of body weight against chronic caloric restriction in obesity-prone and -resistant rats. Am. J. Physiol. Regul. Integr. Comp. Physiol. 2000;278:R231–R237. doi: 10.1152/ajpregu.2000.278.1.R231. [DOI] [PubMed] [Google Scholar]
- Malik V, Popkin B, Bray G. Sugar-Sweetened Beverages and Risk of Metabolic Syndrome and Type 2 Diabetes A meta-analysis. Diabetes Care. 2010;33:2477–2483. doi: 10.2337/dc10-1079. doi:10.2337/dc10-1079. [DOI] [PMC free article] [PubMed] [Google Scholar]
- Manenschijn L, Schaap L, van Schoor NM, van der Pas S, Peeters GMEE, Lips P, Koper JW, van Rossum EFC. High long-term cortisol levels, measured in scalp hair, are associated with a history of cardiovascular disease. J. Clin. Endocrinol. Metab. 2013;98:2078–83. doi: 10.1210/jc.2012-3663. doi:10.1210/jc.2012-3663. [DOI] [PubMed] [Google Scholar]
- Mastronardi C. a, Yu WH, McCann SM. Resting and circadian release of nitric oxide is controlled by leptin in male rats. Proc. Natl. Acad. Sci. U. S. A. 2002;99:5721–6. doi: 10.1073/pnas.082098499. doi:10.1073/pnas.082098499. [DOI] [PMC free article] [PubMed] [Google Scholar]
- Naliboff BD, Cohen MJ, Sowers JD. Physiological and metabolic responses to brief stress in non-insulin dependent diabetic and control subjects. J. Psychosom. Res. 1985;29:367–74. doi: 10.1016/0022-3999(85)90022-4. [DOI] [PubMed] [Google Scholar]
- Nunes S, Soares E, Fernandes J, Viana S, Carvalho E, Pereira FC, Reis F. Early cardiac changes in a rat model of prediabetes: brain natriuretic peptide overexpression seems to be the best marker. Cardiovasc. Diabetol. 2013;12:44. doi: 10.1186/1475-2840-12-44. doi:10.1186/1475-2840-12-44. [DOI] [PMC free article] [PubMed] [Google Scholar]
- Oliver G, Wardle J. Perceived effects of stress on food choice. Physiol. Behav. 1999;66:511–5. doi: 10.1016/s0031-9384(98)00322-9. [DOI] [PubMed] [Google Scholar]
- Pibernik-Okanović M, Roglić G, Prasek M, Metelko Z. War-induced prolonged stress and metabolic control in type 2 diabetic patients. Psychol. Med. 1993;23:645–51. doi: 10.1017/s0033291700025423. [DOI] [PubMed] [Google Scholar]
- Reynolds RM, Labad J, Strachan MWJ, Braun A, Fowkes FGR, Lee AJ, Frier BM, Seckl JR, Walker BR, Price JF. Elevated fasting plasma cortisol is associated with ischemic heart disease and its risk factors in people with type 2 diabetes: the Edinburgh type 2 diabetes study. J. Clin. Endocrinol. Metab. 2010;95:1602–8. doi: 10.1210/jc.2009-2112. doi:10.1210/jc.2009-2112. [DOI] [PMC free article] [PubMed] [Google Scholar]
- Roglić G, Pibernik-Okanović M, Prasek M, Metelko Z. Effect of war-induced prolonged stress on cortisol of persons with type II diabetes mellitus. Behav. Med. 1993;19:53–9. doi: 10.1080/08964289.1993.9937565. doi:10.1080/08964289.1993.9937565. [DOI] [PubMed] [Google Scholar]
- Rosen ED, Spiegelman BM. Adipocytes as regulators of energy balance and glucose homeostasis. Nature. 2006;444:847–53. doi: 10.1038/nature05483. doi:10.1038/nature05483. [DOI] [PMC free article] [PubMed] [Google Scholar]
- Rowland NE, Nasrallah N, Robertson KL. Accurate caloric compensation in rats for electively consumed ethanol-beer or ethanol-polycose mixtures. Pharmacol. Biochem. Behav. 2005;80:109–14. doi: 10.1016/j.pbb.2004.10.010. doi:10.1016/j.pbb.2004.10.010. [DOI] [PubMed] [Google Scholar]
- Smith J, Al-Amri M, Sniderman A, Cianflone K. Leptin and adiponectin in relation to body fat percentage, waist to hip ratio and the apoB/apoA1 ratio in Asian Indian and Caucasian men and women. Nutr. Metab. (Lond) 2006;3:18. doi: 10.1186/1743-7075-3-18. doi:10.1186/1743-7075-3-18. [DOI] [PMC free article] [PubMed] [Google Scholar]
- Torres SJ, Nowson C. a. Relationship between stress, eating behavior, and obesity. Nutrition. 2007;23:887–94. doi: 10.1016/j.nut.2007.08.008. doi:10.1016/j.nut.2007.08.008. [DOI] [PubMed] [Google Scholar]
- Ulrich-Lai YM, Figueiredo HF, Ostrander MM, Choi DC, Engeland WC, Herman JP. Chronic stress induces adrenal hyperplasia and hypertrophy in a subregion-specific manner. Am. J. Physiol. Endocrinol. Metab. 2006;291:E965–73. doi: 10.1152/ajpendo.00070.2006. doi:10.1152/ajpendo.00070.2006. [DOI] [PubMed] [Google Scholar]
- Ulrich-Lai YM, Herman JP. Neural regulation of endocrine and autonomic stress responses. Nat. Rev. Neurosci. 2009;10:397–409. doi: 10.1038/nrn2647. doi:10.1038/nrn2647. [DOI] [PMC free article] [PubMed] [Google Scholar]
- Ulrich-Lai YM, Ryan KK. Neuroendocrine Circuits Governing Energy Balance and Stress Regulation: Functional Overlap and Therapeutic Implications. Cell Metab. 2014 doi: 10.1016/j.cmet.2014.01.020. doi:10.1016/j.cmet.2014.01.020. [DOI] [PMC free article] [PubMed] [Google Scholar]
- Vahl TP, Drazen DL, Seeley RJ, D'Alessio D. a, Woods SC. Meal-anticipatory glucagon-like peptide-1 secretion in rats. Endocrinology. 2010;151:569–75. doi: 10.1210/en.2009-1002. doi:10.1210/en.2009-1002. [DOI] [PMC free article] [PubMed] [Google Scholar]
- Weinstein SE, Shide DJ, Rolls BJ. Changes in food intake in response to stress in men and women: psychological factors. Appetite. 1997;28:7–18. doi: 10.1006/appe.1996.0056. doi:10.1006/appe.1996.0056. [DOI] [PubMed] [Google Scholar]
- Zhang X, Zhang G, Zhang H, Karin M, Bai H, Cai D. Hypothalamic IKKbeta/NF-kappaB and ER stress link overnutrition to energy imbalance and obesity. Cell. 2008;135:61–73. doi: 10.1016/j.cell.2008.07.043. doi:10.1016/j.cell.2008.07.043. [DOI] [PMC free article] [PubMed] [Google Scholar]
- Ziegler D. Type 2 diabetes as an inflammatory cardiovascular disorder. Curr. Mol. Med. 2005;5:309–22. doi: 10.2174/1566524053766095. [DOI] [PubMed] [Google Scholar]