Abstract
High-performance liquid chromatographic and UV spectrophotometric methods were developed and validated for the quantitative determination of pirfenidone, a novel antifibrotic agent used in idiopathic pulmonary fibrosis. Chromatography was carried out by isocratic technique on a reversed-phase C18 Zorbax Eclipse plus column with mobile phase consisting of acetonitrile:water (35:65 %v/v) at flow rate of 0.7 ml/min. The UV spectrophotometric determinations were performed at 317 nm using methanol as a solvent. The proposed methods were validated according to International Conference on Harmonization ICH Q2 (R1) guidelines. The linearity range for pirfenidone was 0.2-5.0 and 3-25 μg/ml for HPLC and UV method, respectively. Both the methods were accurate and precise with recoveries in the range of 98 and 102 % and relative standard deviation <2 %. The developed methods were successfully applied for determination of pirfenidone in tablets.
Keywords: Pharmaceutical formulation, pirfenidone, RP-HPLC, UV
Pirfenidone is a novel antifibrotic agent approved for mild to moderate Idiopathic pulmonary fibrosis (IPF) as orphan drug in Japan and Europe[1,2]. IPF is a rare incurable disease, often fatal; which mostly affects geriatric patients causing fibrosing interstitial pneumonia of unknown etiology[3]. Pirfenidone is the only drug which has been approved for the treatment of IPF. Pirfenidone is a small non-peptide molecule of low molecular weight (185.2 daltons) with the chemical name of 5-methyl-1-phenyl-2-(1H)-pyridone (fig. 1).
Fig. 1.
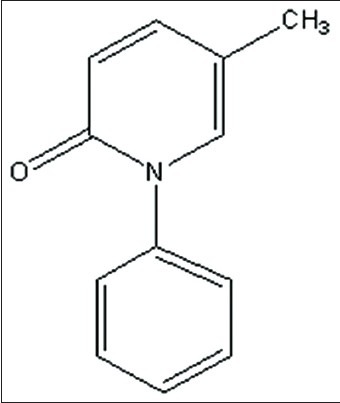
Chemical structure of pirfenidone.
A survey of literature revealed that LC-MS/MS[4] and HPLC[5,6,7] methods are reported for determination of pirfenidone from biological fluids. No methods have been reported for the estimation of pirfenidone in pharmaceutical dosage form. Oral tablet formulation containing active pirfenidone equivalent to 200 mg is available in the territorial markets of Japan, Taiwan, Korea and India. Capsule formulation containing active drug equivalent to 267 mg is available all over Europe. No monograph of pirfenidone or its formulation is available yet in any pharmacopoeia. Hence, the present work is taken up to develop and validate assay methods for routine quality control of pirfenidone formulations.
A gratis sample of pirfenidone (98.3 % w/w purity) was received from Cadila Healthcare Limited, Ankaleshwar, India. Methanol AR, acetonitrile HPLC andwater HPLC grade was purchased from Merck Specialities Private Limited, India. Film coated tablets of pirfenidone (Pirfenex®, Cipla Ltd., Ahmedabad, India) were procured from local market. Capsules filled with physical mixture of drug and excipients such as microcrystalline cellulose, povidone, croscarmellose sodium, magnesium stearate were prepared in the laboratory.
The chromatographic system comprised of an Agilent 1260 series HPLC system (Agilent Technologies, USA) equipped with quaternary pump VL 400 bar, a vacuum-degasser unit and a PDA detector. The data was acquired and processed using Agilent Open Lab CDS (EZChrome edition, version A.04.02) software. Pre-filtered samples were injected into a Zorbax Eclipse plus C18 column (4.6×100 mm, 3.5 μm particle size) protected by a Agilent Zorbax Reliance Cartridge Guard Column (4.6×12.5 mm L, 5 μm particle size packing) using Rheodyne syringe loading sample injector (Rheodyne, Cotati, CA). The mobile phase consisted of acetonitrile-water (65:35,%v/v). Samples were analyzed using following parameters: flow rate, 0.7 ml/min; injection volume, 20 μl; run time, 4 min.; temperature, 25±1°; detection wavelength, 317 nm.
Accurately weighed 100 mg of pirfenidone was transferred into 100 ml volumetric flask, dissolved and diluted up to the mark with mobile phase to obtain stock solution containing 1.0 mg/ml of pirfenidone. Aliquots from stock solution were diluted with mobile phase to get the calibration standard solutions over the range of 0.2 to 5.0 μg/ml of pirfenidone for HPLC method. Calibration standards were analyzed by HPLC method (n=5). The calibration curve was constructed by plotting peak area of pirfenidone against respective concentrations.
Twenty tablets/capsules containing pirfenidone were accurately weighed. Tablets were finely powdered. Capsules were emptied and mixed homogenously. Accurately weighed amount of powder equivalent to 100 mg of pirfenidone was transferred to 100 ml volumetric flask and 50 ml of methanol was added. The mixture was sonicated for 30 min, diluted to mark with methanol and filtered through Whatman filter paper no. 41. From the stock solution, 1.0 ml was accurately transferred to 100 ml volumetric flask and diluted with mobile phase to obtain an intermediate solution of 10 μg/ml of pirfenidone. Aliquot of 1.0 ml of this solution was accurately diluted 10 ml with diluent to obtain the final sample solution containing 1.0 μg/ml of pirfenidone. This was filtered through 0.45 μm Nylon filter, degassed by sonication and volume of 20 μl was injected in chromatographic system. Sample solution was injected in developed HPLC system and area of the peak was measured and % assay was calculated.
A double beam Shimadzu UV/Vis spectrophotometer, UV-1800 having two matched quartz cells with 1 cm light path equipped with Shimadzu UV Probe 2.35 software was employed in spectrophotometric analysis of pirfenidone samples. Aliquots from stock solution were diluted with methanol to get the calibration standard solutions over the range of 3 to 25 μg/ml of pirfenidone for UV spectrophotometric method. Calibration standards were analyzed by UV spectrophotometric method (n=5). The calibration curve was constructed by plotting absorbance of pirfenidone against respective concentrations.
Twenty tablets/capsules containing pirfenidone were accurately weighed, finely powdered and mixed homogenously. The stock solution was prepared using an accurately weighed amount of powder equivalent to 100 mg of pirfenidone that was dissolved and diluted to 100 ml using methanol (1.0 mg/ml of pirfenidone). From the stock solution, 5 ml was accurately transferred to 50 ml volumetric flask and diluted with same diluent to obtain an intermediate solution of 100 μg/ml of pirfenidone. Aliquot of 1.0 ml of the resulting solution was accurately diluted 10 ml with methanol to obtain the final sample solution containing 10 μg/ml of pirfenidone. The absorbance value of sample solution was measured at 317 nm. The % assay was calculated using averaged linear regression equation obtained by UV spectrophotometric method.
The proposed methods were validated according to International Conference on Harmonization ICH Q2 (R1) guidelines[8]. The optimized HPLC conditions for assay of pirfenidone was isocratic mode acetonitrile-water (65:35%v/v) at flow rate 0.7 ml/min in a total run time of four minutes and was used to check the system suitability study. Fig. 2(a) shows the corresponding chromatogram of standard pirfenidone in optimized HPLC conditions showing retention time for pirfenidone at 2.02 min. The system suitability and validation parameters for determination of pirfenidone by HPLC method are depicted in Table 1.
Fig. 2.
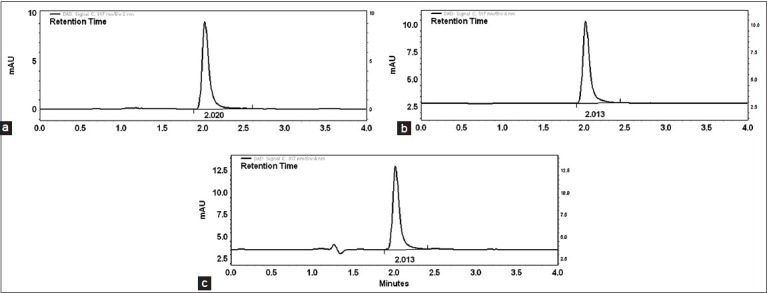
HPLC chromatograms of pirfenidone.
The chromatograms of pirfenidone represent (a) standard solution (b) tablet formulation and (c) capsule formulation prepared in laboratory
TABLE 1.
VALIDATION PARAMETERS FOR DETERMINATION OF PIRFENIDONE BY PROPOSED HPLC METHOD
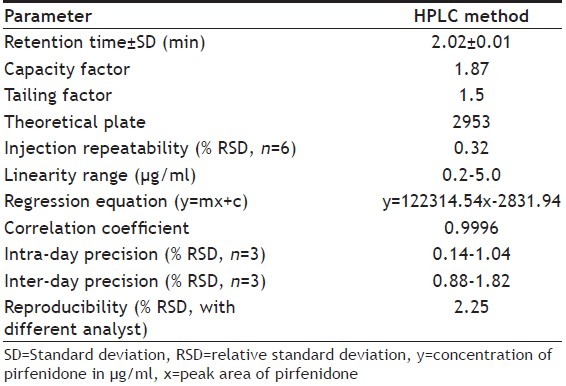
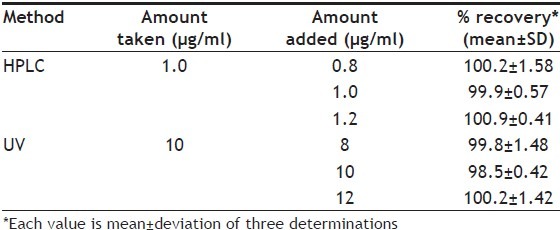
Linear correlation was found between peak areas versus concentration of pirfenidone in the range of 0.2-5.0 μg/ml. The results of injection repeatability (RSD<1%), intraday and interday precision (RSD<2%) and method reproducibility (RSD<3%) proved the method to be precise. The % recovery was found to be in the range of 99.87-100.91% (Table 2). The limit of detection (LOD) and limit of quantification (LOQ) was found to be 0.04 and 0.14 μg/ml of pirfenidone, respectively. The specificity of the method was assessed by comparing chromatograms of pirfenidone obtained from standard solution of drug and that obtained from formulation sample solutions (fig. 2). The retention times of the drug from standard solution and from sample solutions were identical. The comparison of chromatograms confirmed that the excipients did not interfere in the separation of pirfenidone. Peak purity check of pirfenidone peaks obtained from standard solution was found to be 0.9964, confirming the specificity of the method. This was further supported by good correlation (r=0.9997) between the PDA spectrum of pirfenidone from standard solution and that from sample solution of formulation. The change (%5) in proportion of organic solvent and flow rate did not show significant variation in the area for pirfenidone (%RSD<1). The stability of working standard solution of pirfenidone was evaluated to verify that any spontaneous degradation occur when the samples were prepared. The stability profile for standard solution of pirfenidone was studied at 8 and 25° for 24, 48 and 72 h. The results were expressed as percentage of drug remaining. The data obtained showed that sample solutions were stable during 72 h when stored at 8 and 25° with degradation less than 2%.
TABLE 2.
RECOVERY STUDIES FOR PIRFENIDONE IN TABLETS
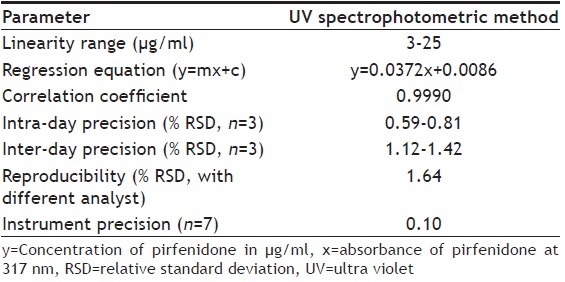
The UV absorption spectrum of pirfenidone in methanol depicted λmax at 317 nm and a shoulder peak at 222 nm (fig. 3). The wavelength showing the maximum absorbance 317 nm was selected for measurement of absorbance. The Beer's range was found to be in the range of 3-25 μg/ml of pirfenidone. The results of regression analysis and validation for determination of pirfenidone by UV method are shown in Table 3. The variability in the precision study was found within limits proving the method to be precise. The % recovery in accuracy study was found to be 98.45-100.15%. The limit of detection (LOD) and limit of quantitation (LOQ) was found to be 0.08and 0.24μg/ml, respectively. The working solutions of pirfenidone in methanol were found to be stable for at least five days.
Fig. 3.
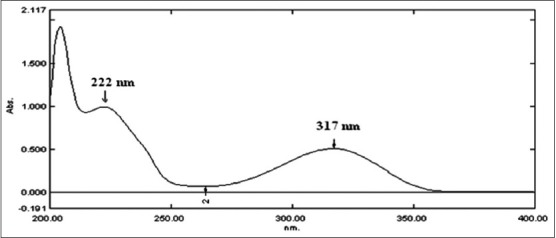
UV spectrum of pirfenidone.
The UV spectrum represents standard solution of pirfenidone (10 ìg/ml).
TABLE 3.
VALIDATION PARAMETERS FOR DETERMINATION OF PIRFENIDONE BY UV METHOD
The formulation powder was sonicated with methanol for 30 min to ensure complete dissolution of pirfenidone. The developed HPLC and UV spectrophotometric methods were applied to determine content of pirfenidone in marketed tablet formulation and the capsule formulation prepared in our laboratory. The amount of pirfenidone was calculated using the respective regression equation obtained from calibration graphs of HPLC and UV methods. Results of analysis of pharmaceutical formulations containing pirfenidone are shown in Table 4. The proposed analytical methods were compared using statistical analysis. The Student's t-test was applied and does not reveal significant difference between the experimental values obtained in the sample analysis by the two methods. The calculated t-value (tcalc=1.102) was found to be less than the critical t-value (tcrit=2.228) at 5 % significance level.
TABLE 4.
ASSAY RESULTS FOR PIRFENIDONE TABLET AND CAPSULE

A limited number of analytical methods[4,5,6,7] have been reported for determination of pirfenidone. The reported methods are for pharmacokinetic analysis of pirfenidone from rat plasma. The reported HPLC methods required liquid-liquid extraction for the isolation of pirfenidone from plasma, followed by isocratic or in most cases gradient elution with high retention time and less precision (greater than 4.5 % RSD). The proposed HPLC method utilizes an isocratic elution technique at room temperature with PDA detection for the determination of pirfenidone from marketed formulations without tedious sample preparation procedure. The real advantage of the proposed HPLC method is low retention times: 2.02 min for pirfenidone. It reduces total run time, leads to low solvent consumption and makes the method more economical.
The HPLC method and the UV spectrophotometric method for the determination of pirfenidone in pharmaceutical formulations were found to be simple, rapid, precise, accurate and sensitive. Moreover, the UV method offers a cost effective and time saving alternative to HPLC method of analysis for pirfenidone from formulations. The HPLC method enables faster quantification of pirfenidone within run time of four minutes without interference of excipients. In summary, the proposed methods can be used for routine quality control of pharmaceutical formulation containing pirfenidone.
Footnotes
Parmar, et al.: HPLC and UV Methods for Estimation of Pirfenidone
REFERENCES
- 1.Ministry of Health, Labor and Welfare; 2008. Report on deliberation results. Nonproprietary Name: Pirfenidone Evaluation and licensing division, Pharmaceutical and food safety Bureau. Available from: http://www.pmda.go . [Google Scholar]
- 2.CHMP assessment report. International Nonproprietary Name: Pirfenidone Procedure no. EMEA/H/C/002154. European Medicines Agency. 2010. [Last accessed on Dec 2008]. Available from: http://www.ema.europa.eu .
- 3.Raghu G, Collard HR, Egan JJ, Martinez FJ, Behr J, Brown KK, et al. An official ATS/ERS/JRS/ALAT statement: Idiopathic pulmonary fibrosis: Evidence-based guidelines for diagnosis and management. Am J Respir Crit Care Med. 2011;183:788–824. doi: 10.1164/rccm.2009-040GL. [DOI] [PMC free article] [PubMed] [Google Scholar]
- 4.Tong S, Wang X, Jiang H, Xuegu X, Pan Y, Kunming C, et al. Determination of pirfenidone in rat plasma by LC–MS-MS and its application to a pharmacokinetic study. Chromatographia. 2010;71:709–13. [Google Scholar]
- 5.Shi S, Wu J, Shi S, Wu J, Zeng F. Development and validation of an improved LC method for the simultaneous determination of pirfenidone and its carboxylic acid metabolite in human plasma. Chromatographia. 2008;69:459–63. [Google Scholar]
- 6.Wang Y, Zhao X, Zhong J, Chen Y, Liu X, Wang G. Simple determination of Pirfenidone in rat plasma via high-performance liquid chromatography. Biomed Chromatogr. 2006;20:1375–9. doi: 10.1002/bmc.708. [DOI] [PubMed] [Google Scholar]
- 7.Tamilselvi N, Krurian DS. Bioanalytical method development and validation of pirfenidone by RP-HPLC method and its application to the determination of drug food interaction study in wister rats. Int J Pharm Biomed Res. 2012;3:132–42. [Google Scholar]
- 8.Geneva: IFPMA; 2005. International Conference on Harmonization. Guidance on validation of analytical procedure: Text and methodology. ICH – Q2 (R1) [Google Scholar]


