

Abstract
Droplet-based microfluidic techniques can form and process micrometer scale droplets at thousands per second. Each droplet can house an individual biochemical reaction, allowing millions of reactions to be performed in minutes with small amounts of total reagent. This versatile approach has been used for engineering enzymes, quantifying concentrations of DNA in solution, and screening protein crystallization conditions. Here, we use it to read the sequences of DNA molecules with a FRET-based assay. Using probes of different sequences, we interrogate a target DNA molecule for polymorphisms. With a larger probe set, additional polymorphisms can be interrogated as well as targets of arbitrary sequence.
Introduction
DNA analysis is needed throughout biological research, for identifying driver mutations in cancer, characterizing the diversity of the human antibody repertoire, and characterizing heterogeneous samples of microbes, among many other examples.1–4 There are several techniques for analyzing DNA, including using arrays of probes of known sequence, and by performing de novo sequencing with Next Generation platforms.5,6 A property of these technologies that makes them powerful is that they use chip-based arrays to maximize the number of molecules that can be analyzed in parallel. This is powerful because the molecules are arrayed at fixed locations so that location can be used to label the sequence analyzed at each position. For example, in microarray-based methods, each position tests for the presence of a specific sequence in the template. In most Next Generation Sequencing platforms, molecules are arrayed on a surface at fixed positions and do not move during the sequencing reactions; this allows multiple bases of each molecule to be read consecutively by repeating the sequencing reaction. Another advantage of chip-based approaches is that they are scalable; in Next Generation Sequencing, hundreds of millions of molecules can be arrayed on a chip, allowing hundreds of millions of molecules to be sequenced in parallel. Similar parallelization schemes enable microarrays to interrogate tens of thousands of unique sequences in a population, and are key to the steadily lowering cost and increasing capacity of these techniques. A challenge of arrays, however, is that even though the number of positions is large, it is finite, limiting the number of sequences that can be analyzed. In addition, to perform the sequence analysis reactions, reagents must be introduced onto the chip, requiring systems for handling fluids and mixing reagents. Ultimately, the need to controllably flow reagents over the array adds steps to the process that limit total throughput. Finally, these sequencers only achieve a low cost per base when the entire array is used; this often requires samples to be batched together and processed in parallel to realize the low cost of these methods. While this is often possible with methods like barcoding, it adds time-consuming steps into the sequencing workflow.
Microfluidic devices can be tailored to handle minute volumes of fluid with precision and speed.7–9 Microfluidic devices thus hold potential for increasing the throughput of DNA analysis. Droplet-based microfluidic techniques, for example, can generate and sort picoliter-volume drops at rates of thousands per second.10–12 Each drop, in essence, serves as a compartment in which a specific reaction can be performed. This has been used, for example, to count molecules using quantitative digital PCR, screen protein crystallization conditions, and characterize gene expression in individual mammalian cells.13–18 However, in contrast to spots on a chip-based array, drops move through microchannels, making it impossible to use their location as a marker for what reactions are contained within them, and necessitating alternative labeling methods. Nevertheless, the ability to flow reactors through channels sequentially and at very high throughput has advantages over fixed arrays: the number of reactions performed scales with the droplet rate and inversely to the droplet volume, allowing it to be adjusted to the needs of the sample being analyzed. In addition, microfluidic techniques can perform hundreds of millions of reactions using only hundreds of microliters of total reagent, making them exceptionally efficient and cost effective.
In this paper, we describe a droplet-based microfluidic system that can analyze DNA molecules dispersed in a solution. Our approach is analogous to a microarray in which each position on the array tests for a specific 15 base sequence; however, rather than performing the reactions on a physical array, our system performs them in sequential sets of flowing microdroplets. To identify the contents of the drops, we have developed a labeling scheme using fluorescent dyes. Our method enables affordable, high throughput DNA sequence analysis.
Experimental
Device fabrication
Our devices are fabricated in PDMS using the techniques of soft lithography.19 The photoresist SU8 3050 (MicroChem) is spun onto a 3″ silicon wafer at 3000 rpm, producing a coating thickness of 50 μm. After photomask exposure, baking, and development with propylene glycol methyl ether acetate, a 50 μm tall positive master of the device is formed on the silicon wafer. To fabricate the PDMS devices, PDMS elastomer (Sylgard 184) mixed at a crosslinker-to-elastomer concentration of 1: 10 is poured onto the master and baked for 2 h at 65 °C. The cured PDMS replicates are sliced and peeled from the master and holes for inlet ports are punched using a 0.75 mm biopsy punch (Harris Unicore). The devices are washed with isopropanol, dried with pressurized air, and bonded to 50 × 75 mm glass slides using oxygen plasma treatment.
To enable the formation of aqueous-in-oil emulsions, the microfluidic channels must be made hydrophobic, which we accomplish with Aquapel (PPG Industries). The bonded devices are removed from the oven and ~10 μL of Aquapel is flushed into them; the channels are immediately dried with pressurized air and baked for 60 min, making them permanently hydrophobic. To stabilize our droplets against coalescence, we use EA surfactant donated by RainDance Technologies. The surfactant is dissolved in the fluorinated carrier oil Novec HFE-7500 at a concentration of 2 wt%. To introduce these reagents into the microfluidic devices we use Harvard Apparatus PhD 2000 syringe pumps. For the picoinjection device, electrodes must be microfabricated onto the device. We fabricate empty PDMS channels in the shape and position desired for the electrodes. A 0.1 M solution of 3-mercaptotrimethoxysilane (Gelest Product #: SIM6476.0) in acetonitrile is flushed through the channels and then blown out with pressurized air. The device is then heated to 80 °C and a low melting point solder (Indalloy 19 (52 In, 32.5 Bi, 16.5 Sn) 0.020″ diameter wire, Indium Corp.) is introduced into the electrode channels, followed by a terminal block with male pins. The device is cooled producing a solid electrode in the shape of the channel. Electrical contacts are made with alligator clips connected to a high voltage amplifier (Trek) and function generator (LabVIEW FPGA).
FRET probes and template DNA
To analyze the sequences of DNA molecules, our microfluidic system utilizes a ligation assay. The ligation assay uses 6 bp and 9 bp probes that anneal adjacent to one another on the target molecule. Both probes are purchased from Integrated DNA Technologies (IDT) and diluted in PBS buffer to working concentrations of 10 μM prior to use. The DNA template consisting of 64 bases of the LacZ gene was also purchased from IDT. The probes are labeled with a FRET dye pair, an Iowa Black quencher on the 3′ end of the 3′ probe and FAM on the 5′ end of the 5′ probe. When these probes are mixed in solution, their average distance of separation is larger than the Förster radius of the dyes; consequently, no FRET quenching occurs and the FAM emission is bright. However, when a target molecule is present that is complementary to both probes, the probes anneal adjacent to one another and are covalently linked by ligase; this brings the two dyes within the Förster radius, leading to FRET quenching of the FAM and a loss of fluorescence of the drop at 530 nm. The probe-containing solution consists of 400 nM quencher-labeled oligos, 200 nM FAM-labeled oligos, and 0.2 mg ml−1 BSA in 1× ligation buffer. The picoinjection solution consists of 400 nM template, 2% ligase stock solution (NEB T4 Quick DNA Ligase kit #M2200L) and 0.4 mg ml−1 BSA in 1× ligation buffer. By repeating this process with different probes, we are able to test for different sequences. The set of 15 probes used in this study are listed in Fig. 1a. With an expanded set including all possible sequence permutations, our system could be extended to detect target molecules of arbitrary sequence.
Fig. 1.

Schematic of FRET ligation assay used to read the sequences of a target molecule. The target is a synthetic 64 base molecule containing a sequence that is close to the end of the LacZ gene of Escherichia coli APEC O1. The list of probes used with associated identification numbers is shown in (A) and a schematic of the “virtual array” we used for our probe sets is shown in (B). Each of the probe sets is loaded into a well on a plate with fluorescent dyes mixed at concentrations so as to denote their position on the array. A schematic of our FRET ligation assay is shown in (C). For the FRET dye pair, we use FAM and Iowa Black Quencher; these dyes have the property that when in close proximity, the FAM emission is quenched, resulting in a loss of intensity. To use this to detect ligation, the 6mer probes are labeled with the quencher and the 9mer probes with FAM. If the probes are ligated, the dyes are brought into close proximity, resulting in a detectable quenching. The types of mismatches tested in our experiment are shown in (D). * denotes a probe composition expected to give a negative signal, and letters in bold represent single base pair mismatch.
Preparation of emulsion library
We use microfluidic drop formation to prepare monodisperse microdrops in which each microdrop contains only one element of the probe library (one set of 5′ and 3′ probes).20 This allows us to perform the ligation reactions with the different probes independently so that we determine which tested sequences are present in the target and which are not. However, this necessitates a strategy for labeling the droplets so that we know which probe is being tested in a given drop. To label the drops, we employ a “virtual array” strategy in which fluorescent dyes are loaded at controlled concentration combinations into the different probe-containing drops. We use two tandem dyes, R-phycoerythrin conjugated with Alexafluor 610 and 680 (Invitrogen A20981 and A-20984), which excite at 488 nm and emit at 630 and 702 nm, respectively. We prepare these solutions by pipetting them into different wells on a well plate, as depicted in Fig. 1b. After the dye combinations are loaded into the wells, the probe pairs are added. The solutions are then sequentially emulsified using a microfluidic drop maker: a long piece of PE/2 tubing is attached to a 1 mL BD syringe filled with 100 μL of HFE-7500 oil. The open end of the tube is dipped into the first well and, using a syringe pump running in reverse, 50 μL of the solution is sipped into the tube. After this, ~15 μL of air is loaded into the tube and then 50 μL of the next solution is added. This is repeated for all solutions, loading them sequentially as spatially-segregated plugs into the tube.
The plugs are then emulsified using a flow focus microfluidic drop maker.20 The drop maker consists of a cross-junction into which our oil and surfactant mix is injected at a flow rate of 1550 μL h−1 into the side channels; simultaneously, the reagent plugs are introduced into the center channel of the drop maker at a flow rate of 800 μL h−1, forming monodisperse drops 50 μm in diameter. The drops for all plugs are collected into a 5 ml syringe tube, forming an “emulsion library” consisting of droplets of the different probe solutions labeled with fluorescent dyes.
Results and discussion
Operation of microfluidic system
To use our system to analyze the sequences of DNA molecules dispersed in a solution, the solution must be injected into the drops containing the probes, which we accomplish using picoinjection,21–24 as shown in Fig. 2a. High speed camera movies of the picoinjection process are shown in Fig. 3a. The picoinjection device consists of a spacing junction followed by an injection point, where the target solution is added. The emulsion library is introduced into the picoinjector through a syringe at a flow rate of 100 μL h−1. The spacing junction is initially 70 μm wide and then narrows to 35 μm. The wide initial dimensions allow the drops to be spaced by the oil without breaking into smaller drops. The narrow channel that follows ensures that the drops flow as plugs at constant velocity, well separated by gaps of oil. This causes them to pass the picoinjector one at a time so that a controlled amount of target-containing solution can be added to each of them. The picoinjector consists of a T-shaped junction in which the target solution is injected into the drops through a 10 μm wide orifice, Fig. 2a and 3a. Electrodes opposite the injection channel (black channels, Fig. 2a) apply an electric field that triggers merger of the drops with the target solution. The electric field is generated by applying AC voltage at a frequency of 30 kHz to the electrodes. The voltage is tuned using the input voltage of an inverter circuit (BXA-12579/MOD5, JKL components) around 100 V peak-to-peak, such that the droplet interface is sufficiently destabilized to allow picoinjection. At a template solution flow rate of 100 μL h−1, the picoinjector adds ~16 pL to each drop, which increases the drop size to ~54 μm. The picoinjected drops are collected into an Eppendorf tube and incubated at room temperature for 1 h for the ligation reaction (Fig. 2b).
Fig. 2.

Microfluidic system for analyzing the sequences of target molecules dispersed in a solution. Drops containing the probe sets are introduced into the microfluidic device and spaced by injection of oil, (A). The spaced drops then pass the picoinjector, where the solution containing the target DNA is injected. The injected drops are collected into a vial and incubated at room temperature for 1 h to allow the ligation reaction to complete, (B). They are then re-introduced into a droplet cytometer that spaces the drops and flows them through a laser, during which their fluorescence amplitudes are measured, (C). The drops are ~50 μm in diameter.
Fig. 3.
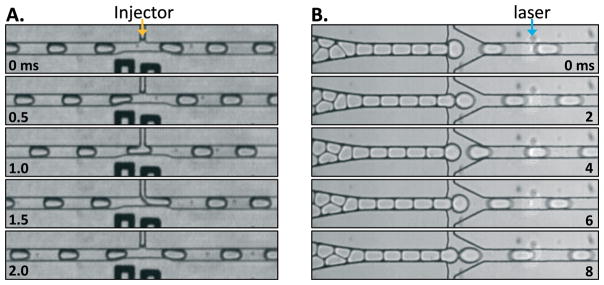
Image sequences recorded with a high-speed camera of the picoinjector (A) and the droplet cytometer (B). The drops are ~50 μm in diameter.
If the probes in a given drop are complementary to the target, they hybridize adjacent to one another and are ligated; this produces a FRET signal we can detect optically, as illustrated in Fig. 1c. By contrast, if the probes are not complementary to the target, ligation does not occur and no FRET signal is produced, as shown in Fig. 1c, right. In this way, by measuring the intensity of the drop at the appropriate FRET wavelength, we are able to determine whether ligation occurred and, thus, if a given sequence exists within the target. To measure the droplet intensities, the incubated emulsion is re-introduced into a droplet cytometer device consisting of a spacing junction and narrow channel; the drops are injected at a flow rate of 200 μL h−1 and the spacing oil at a flow rate of 300 μL h−1 (Fig. 2c). Shortly after the drops are spaced they are optically scanned to read the label dyes and the quenching of the FAM dye. We use this to test for six perfect matches and nine mismatches: a single-base mismatch, a gap mismatch in which the probes are complementary to the target separated by one base, and an overlap mismatch, in which the probes overlap by one base, as illustrated in Fig. 1d.
Our assay is designed to have fluorescence at three key wavelengths: 530 nm for the FRET assay, and 630 and 702 nm for the label dyes. To excite all dyes with a single laser beam, we use phycoerythrin-conjugated dyes for the labels, which have the valuable property that, while they emit over different wavelengths depending on the dyes conjugated to them, they can all be excited at 488 nm, which is also the excitation wavelength of FAM, the dye we use to detect ligation. The drops are flowed through an ~15 μm laser spot focused through a 40× objective, Fig. 2c and 3b. As the drops pass through the laser, the emitted fluorescent light is captured by the 40× objective and filtered through dichroic mirrors and bandpass filters to separate it according to color, and the different colors are imaged onto three photomultiplier tubes (PMTs) with peak measurement bands at 536/40, 632/22 and 716/40 nm, matching our dyes. The PMT signals are monitored by a computer running LabVIEW FPGA which acquires PMT voltage measurements at a rate of 200 kHz. A 140 ms snapshot of intensity time traces for 24 drops is shown in Fig. 4. The baselines of the time traces are aligned to zero so that the fluorescently-bright drops appear as peaks as a function of time in the three different channels, as shown in Fig. 4. The first droplet measured, shown to the far left in the plot, has a bright signal at the assay wavelength (green) and low signals at both dye wavelengths (red and purple). The drops that follow have amplitudes in these channels corresponding to the particular concentrations of their label dyes and the outcomes of the FRET assays performed within them.
Fig. 4.
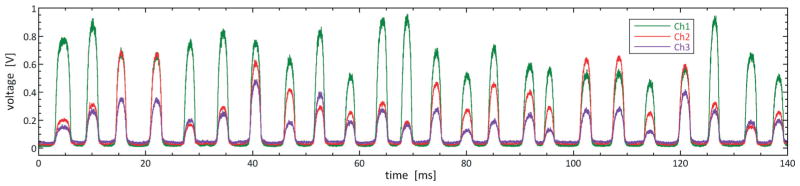
Intensity time traces of drops after incubation and the completion of the ligation assay. The time traces for the assay (green, channel 1), and label dyes (red and purple, channels 2 and 3) are plotted on top of each other. The drops appear as peaks in intensity as a function of time, separated by dim gaps corresponding to the passage of the non-fluorescent interstitial oil. The amplitudes of the peaks for a given drop depend on the dye label values and the outcome of the ligation assay.
The time traces represent the rawest form of the sequence data collected by our system and must be processed to determine which probes are tested in a given drop and whether the FRET assay for a given probe set is positive or negative. This is accomplished using a peak analysis algorithm programmed onto the FPGA card. The peak analysis algorithm measures the maximum and average intensity amplitudes of each drop for all three colors and the widths (time durations) of the peaks, related to the drop size. Drops that are too big are likely the result of coalescence and are discarded from the analysis. The peak measurements are stored for offline processing.
After the peak data is captured, we analyze it to identify the label of each drop, relating which probe set is being tested in each drop. This is accomplished by creating a 2D histogram of the drop intensities as a function of the 632 and 716 nm channels, Fig. 5a. The histogram shows the data for 42 000 drops, color coded according to the number of drops (darker) falling within a particular pixel bin. Using a particle-finding algorithm, we identify each cluster and determine the bounding box encapsulating all of its points, Fig. 5b. The numbers printed next to the boxes represent the probe set identification code (Fig. 1a) corresponding to that cluster. Once the cluster boundaries are determined, each detected drop is placed into one of the clusters based on its intensity values for the label dyes. Drops that do not fall within a cluster are discarded from the analysis and represent ~8% of all drops detected.
Fig. 5.

(A) Two-dimensional histogram of drops detected in our experiment. The horizontal axis corresponds to the intensity of the drops on channel 2 (632 nm), while the vertical axis corresponds to the intensity on channel 3 (716 nm). The color of each bin corresponds to the number of drops detected with those two intensity levels. (B) The bounding boxes used to identify drops as belonging to a particular cluster are drawn around the center of each cluster.
The droplet intensities at 532 nm relate whether a given sequence was present in the target, plotted as a function of cluster identification number in Fig. 6. We designed the probe library so that the probes matching the target occupied identification numbers 1–6 and all mismatching probes numbers 7–15. The points denote the cluster average at 536 nm and the error bars the standard deviation. Since in our assay a ligation corresponds to a match and results in quenching of the 536 emission, drops with matching probes should have a lower intensity than those with mismatching probes; indeed, this is what we observe, as shown in Fig. 6. While the separation of the brightest matching probe (1) and dimmest mismatching probe (11) is small, all matches are less than all mismatches and most are unambiguously separated. We suspect that the suboptimal separation between matching and mismatching probes is due to probe design since, after ligation, the FRET dyes are attached to opposite ends of the combined probe. This brings the probes closer than they would be when in solution, but they are still separated by the full 15 bases of the ligated probed. To increase the signal of our assay, the dyes could be moved closer to the point of ligation. Other optimization of the biological assay including the use of other enzymes and FRET pairs may also increase the signal difference between matching and mismatching probes. Nevertheless, even with our current probes, we are able to achieve sufficient discrimination so as to identify perfect matches along the full length of the template and single-base pair mismatches up to five bases from the point of ligation.
Fig. 6.

(A) Average intensity at 536 nm for all clusters detected in our experiment, with error bars corresponding to the standard deviation. All matching probes are grouped to the left and mismatching probes to the right. A single threshold can be drawn to distinguish all matching probes from all mismatching probes, horizontal dotted line. (B) Tiling of our matching probes to reconstruct a portion of the LacZ gene.
Conclusions
We have presented a droplet-based microfluidic platform that can analyze DNA molecules using a FRET ligation assay. Our system is able to discriminate between probes that perfectly complement a target molecule and that are not complementary to the target molecule, even due to a single-base mismatch. Hence, in its present form, our system enables rapid and inexpensive genotyping analysis. With an expanded probe set incorporating universal bases and containing all permutations of probes of a given length, our system could be used for targets of arbitrary, unknown sequence, forming the basis for a fast and low-cost DNA sequencing platform.
Acknowledgments
This work was supported by the National Science Foundation (NSF) (DMR-1006546), the National Institutes of Health (NIH) (P01GM096971 and 5R01EB014703-02), the Harvard Materials Science Research and Engineering Center (DMR-0820484). R. A. S. gratefully acknowledges financial support from German Research Foundation (grant SP1282/1-1).
References
- 1.Stratton MR, Campbell PJ, Futreal PA. Nature. 2009;458(7239):719–724. doi: 10.1038/nature07943. [DOI] [PMC free article] [PubMed] [Google Scholar]
- 2.Tomlinson IM, Walter G, Marks JD, Llewelyn MB, Winter G. J Mol Biol. 1992;227(3):776–798. doi: 10.1016/0022-2836(92)90223-7. [DOI] [PubMed] [Google Scholar]
- 3.de Wildt RMT, Hoet RMA, van Venrooij WJ, Tomlinson IM, Winter G. J Mol Biol. 1999;285(3):895–901. doi: 10.1006/jmbi.1998.2396. [DOI] [PubMed] [Google Scholar]
- 4.Tringe SG, von Mering C, Kobayashi A, Salamov AA, Chen K, Chang HW, Podar M, Short JM, Mathur EJ, Detter JC, Bork P, Hugenholtz P, Rubin EM. Science. 2005;308(5721):554–557. doi: 10.1126/science.1107851. [DOI] [PubMed] [Google Scholar]
- 5.Heller MJ. Annu Rev Biomed Eng. 2002;4:129–153. doi: 10.1146/annurev.bioeng.4.020702.153438. [DOI] [PubMed] [Google Scholar]
- 6.Shendure J, Ji HL. Nat Biotechnol. 2008;26(10):1135–1145. doi: 10.1038/nbt1486. [DOI] [PubMed] [Google Scholar]
- 7.Beebe DJ, Mensing GA, Walker GM. Annu Rev Biomed Eng. 2002;4:261–286. doi: 10.1146/annurev.bioeng.4.112601.125916. [DOI] [PubMed] [Google Scholar]
- 8.Squires TM, Quake SR. Rev Mod Phys. 2005;77(3):977–1026. [Google Scholar]
- 9.Whitesides GM. Nature. 2006;442(7101):368–373. doi: 10.1038/nature05058. [DOI] [PubMed] [Google Scholar]
- 10.Teh SY, Lin R, Hung LH, Lee AP. Lab Chip. 2008;8(2):198–220. doi: 10.1039/b715524g. [DOI] [PubMed] [Google Scholar]
- 11.Guo MT, Rotem A, Heyman JA, Weitz DA. Lab Chip. 2012;12(12):2146–2155. doi: 10.1039/c2lc21147e. [DOI] [PubMed] [Google Scholar]
- 12.Tran TM, Lan F, Thompson CS, Abate AR. J Phys D: Appl Phys. 2013;46:114004. [Google Scholar]
- 13.Zheng B, Roach LS, Ismagilov RF. J Am Chem Soc. 2003;125(37):11170–11171. doi: 10.1021/ja037166v. [DOI] [PubMed] [Google Scholar]
- 14.Song H, Chen DL, Ismagilov RF. Angew Chem, Int Ed. 2006;45(44):7336–7356. doi: 10.1002/anie.200601554. [DOI] [PMC free article] [PubMed] [Google Scholar]
- 15.Huebner A, Srisa-Art M, Holt D, Abell C, Hollfelder F, Demello AJ, Edel JB. Chem Commun. 2007;12:1218–1220. doi: 10.1039/b618570c. [DOI] [PubMed] [Google Scholar]
- 16.Brouzes E, Medkova M, Savenelli N, Marran D, Twardowski M, Hutchison JB, Rothberg JM, Link DR, Perrimon N, Samuels ML. Proc Natl Acad Sci U S A. 2009;106(34):14195–14200. doi: 10.1073/pnas.0903542106. [DOI] [PMC free article] [PubMed] [Google Scholar]
- 17.Mazutis L, Araghi AF, Miller OJ, Baret JC, Frenz L, Janoshazi A, Taly V, Miller BJ, Hutchison JB, Link D, Griffiths AD, Ryckelynck M. Anal Chem. 2009;81(12):4813–4821. doi: 10.1021/ac900403z. [DOI] [PubMed] [Google Scholar]
- 18.Eastburn DJ, Sciambi A, Abate AR. Anal Chem. 2013;85(16):8016–8021. doi: 10.1021/ac402057q. [DOI] [PubMed] [Google Scholar]
- 19.Xia YN, Whitesides GM. Angew Chem, Int Ed. 1998;37(5):551–575. doi: 10.1002/(SICI)1521-3773(19980316)37:5<550::AID-ANIE550>3.0.CO;2-G. [DOI] [PubMed] [Google Scholar]
- 20.Anna SL, Bontoux N, Stone HA. Appl Phys Lett. 2003;82(3):364–366. [Google Scholar]
- 21.Abate AR, Hung T, Mary P, Agresti JJ, Weitz DA. Proc Natl Acad Sci U S A. 2010;107(45):19163–19166. doi: 10.1073/pnas.1006888107. [DOI] [PMC free article] [PubMed] [Google Scholar]
- 22.O’Donovan B, Eastburn DJ, Abate AR. Lab Chip. 2012;12(20):4029–4032. doi: 10.1039/c2lc40693d. [DOI] [PubMed] [Google Scholar]
- 23.Eastburn DJ, Sciambi A, Abate AR. PLoS One. 2013;8(4):e62961. doi: 10.1371/journal.pone.0062961. [DOI] [PMC free article] [PubMed] [Google Scholar]
- 24.Sjostrom SL, Joensson HN, Svahn HA. Lab Chip. 2013;13(9):1754–1761. doi: 10.1039/c3lc41398e. [DOI] [PubMed] [Google Scholar]