

Abstract
APO866, an inhibitor of NAD biosynthesis, exhibits potent antitumor properties in various malignancies. Recently, it has been shown that APO866 induces apoptosis and autophagy in human hematological cancer cells, but the role of autophagy in APO866-induced cell death remains unclear. Here, we report studies on the molecular mechanisms underlying APO866-induced cell death with emphasis on autophagy. Treatment of leukemia and lymphoma cells with APO866 induced both autophagy, as evidenced by an increase in autophagosome formation and in SQSTM1/p62 degradation, but also increased caspase activation as revealed by CASP3/caspase 3 cleavage. As an underlying mechanism, APO866-mediated autophagy was found to deplete CAT/catalase, a reactive oxygen species (ROS) scavenger, thus promoting ROS production and cell death. Inhibition of autophagy by ATG5 or ATG7 silencing prevented CAT degradation, ROS production, caspase activation, and APO866-induced cell death. Finally, supplementation with exogenous CAT also abolished APO866 cytotoxic activity. Altogether, our results indicated that autophagy is essential for APO866 cytotoxic activity on cells from hematological malignancies and also indicate an autophagy-dependent CAT degradation, a novel mechanism for APO866-mediated cell killing. Autophagy-modulating approaches could be a new way to enhance the antitumor activity of APO866 and related agents.
Keywords: NAD, ATG, CATALASE, ROS, autophagy, APO866, lymphoma, leukemia, therapy
Introduction
Inhibition of tumor growth by depleting the cellular energy stores through a decrease in nicotinamide and adenosine triphosphate (ATP) has been theorized to be an important way of inducing cell death, originally and particularly through influencing of the apoptotic biochemical cascade.1 In this respect, several recent studies2-5 report the antitumor activities of a novel agent, APO866 that inhibits specifically nicotinamide phosphoribosyltransferase (NAMPT), a rate-limiting enzyme in the mammalian salvaging pathway for the synthesis of nicotinamide adenine dinucleotide (NAD).6,7 NAD plays a crucial role as a cofactor/substrate in numerous biochemical and biological processes, including those catalyzed by PARP1 (poly[ADP-ribose]polymerase 1), sirtuins, and ADP-ribosyl cyclase 1-6. NAMPT activity is essential for replenishing cellular NAD levels in mammalian cells. In particular, NAMPT activity appears to be crucial in cancer cells, which exhibit increased NAD turnover due to genomic instability and persistent PARP1-dependent DNA repair.8,9 Thus, NAMPT represents an attractive therapeutic target for the development of new anticancer agents. Mechanistic studies revealed that APO866-mediated cell death involves NAD and ATP depletion, the loss of mitochondria membrane potential (MMP), caspase activation and autophagy-associated cell death.2,3,10,11 However, direct evidence for the implication of autophagy in APO866-induced cell death is limited.
Macroautophagy (hereafter called autophagy) is a physiological and essential self-digestion process for degradation of long-lived proteins and organelles and recycling of intracellular components. During autophagy, portions of cytosol containing the cellular material that need to be degraded are engulfed in multimembrane vesicles termed autophagosomes. The mature autophagosomes then fuse with lysosomes, which contain the acidic hydrolases necessary for autophagic degradation creating large compartments named autolysosomes.12 Autophagic degradation is important for basic homeostasis and for the generation of amino acids and fatty acids used during protein synthesis and energy production. Autophagy is thus often involved in cell survival when activated under starvation conditions. However, in other stress conditions enhanced autophagy can be implicated in promoting cell death as a mediator of apoptosis or necrosis or as an independent mechanism of death termed autophagy-mediated cell death or programmed cell death type II.13,14 To provide evidence of a prodeath role of autophagy, the commonest strategy has been to show that its inhibition protects or at least delays the cell death.15 Thus, several recent studies have shown that certain forms of cell death are prevented either by pharmacological inhibition of autophagy inhibitors or by reduced expression of autophagy-related (ATG) genes, a group of autophagy-regulating genes that are conserved from yeast to humans,16 indicating that autophagy participates directly in the death process. Billington et al.,10 and Cea et al.,17 report that inhibition of NAD synthesis induces autophagy in neuroblastoma and multiple myeloma cells, respectively. In addition, we have previously shown that APO866-induced cell death in hematological malignant cells is attenuated in the presence of pharmacological autophagy inhibitors.3 These findings suggest that autophagy might be involved in APO866-induced cell death. However, due to the low specificity of these inhibitors, a definitive conclusion could not be drawn.
To define the role of autophagy in APO866-induced cell death and to identify molecular mechanisms by which autophagy can be involved in leukemia/lymphoma cells death, we used in the present study specific inhibition of autophagy by lentiviral-mediated transduction of shRNAs targeting 3 important ATG proteins: ATG7, ATG5, and BECN1/BECLIN 1 (the homolog of yeast Vps30/Atg6). We now provide clear evidence that treatment of human leukemia/lymphoma cells with APO866 induces a BECN1-independent autophagy with selective degradation of CAT, one of the main cellular antioxidants. Consequent depletion of CAT results in increased ROS production and cell death. Inhibition of autophagy by downregulation of ATG5 and ATG7 or extracellular CAT supplementation abrogates the APO866-induced cell death.
Results
APO866 enhances autophagy in hematological malignant cells
APO866 triggers cell death in different types of malignant cells through NAD and ATP depletion. Importantly, APO866 eliminates malignant cells without affecting normal hematopoietic progenitor cells.3 Several studies suggested various modes of cell death mechanisms induced by APO866, including apoptotic2,18-21 and autophagic10,17,22-27 pathways.
In the present study, we examined whether APO866-induced cell death in leukemia/lymphoma cells is dependent on autophagic and/or apoptotic pathways. To this end, 10 nM APO866 was chosen to induce cell death in various hematological malignant cells based on the following reasons: i) in our previous study,3 we demonstrate that 10 nM APO866 is the drug concentration that is required to reach the maximum killing effect on various hematopoietic malignant cells, ii) APO866 concentration at 10 nM was chosen as the test concentration nearest to the steady-state plasma level of 14 nM measured at the maximum tolerated dose in patients in the phase 1 clinical trial.28 iii) Lastly, of interest, 10 nM APO866 is not toxic on healthy human progenitor cells.3 To provide evidence for autophagy induction in APO866-treated leukemia cells, Jurkat cells were treated with or without APO866 and autophagic activity was determined by measuring i) conversion of the cytoplasmic form of LC3 (LC3-I, 18 kDa) to the preautophagosomal and autophagosomal membrane-bound form of LC3 (LC3-II, 16 kDa) by western blot, ii) formation of LC3-positive vesicles by LC3 immunolabeling using confocal microscopy and iii) degradation of SQSTM1, a protein that is selectively degraded by autophagy.29-31 Initially, APO866 induced a decrease in LC3-II level 24 h after drug application. However this reduction was followed by a significant increase in LC3-II at 48 h, while at 72 h and 96 h of incubation, LC3-II declined, suggesting that APO866 induces a transient activation of autophagy at 48 h, of incubation in Jurkat cells (Fig. 1A). Similar data were obtained in another APO866-treated cell line, Ramos cells (derived from a Burkitt’s lymphoma) (Fig. S1A). Increased autophagosome formation was confirmed by a rise in LC3-positive dots in Jurkat cells treated with APO866 for 48 h compared with control conditions (Fig. 1B). Moreover, both LC3-II levels and LC3+ dots detected at 72 h were significantly higher compared with 24 h suggesting that APO866 induced an increase in autophagosomes from 24 h to 72 h after APO866 treatment. To clarify whether increased autophagosome presence was due to enhanced autophagy flux or to reduced degradation of autophagosomes by defective lysosomal activity in APO866-treated cells, we examined the expression level of SQSTM1. Western blot analyses showed a progressive decrease in SQSTM1 expression levels in both Jurkat and Ramos cells (Fig. 1C; Fig. S1B), suggesting that APO866 induced SQSTM1 degradation. Furthermore, to confirm that APO866 treatment increases the autophagic flux, we monitored LC3-II conversion in the presence of an inhibitor of autophagosome-lysosome fusion, chloroquine (CQ), in Jurkat cells. CQ treatment markedly increased LC3-II expression levels in APO866 treated-cells (Fig. 1D), indicating an enhancement of autophagic flux in Jurkat cells (enhanced autophagosome formation and active lysosomal degradation). Collectively, these findings support induction of autophagy in leukemia/lymphoma cells after treatment with APO866.

Figure 1. APO866 induces autophagy in Jurkat cells. (A) Western blot analysis and corresponding quantification of LC3-II form in untreated control cells (ct) and Jurkat cells treated with APO866 (10 nM) at different time points. n ≥ 7. (B) Confocal images of Jurkat cells immunolabeled for LC3 (in red) and Hoechst-stained (nuclei) with quantification of the number of LC3-positive dots (autophagosomes) per cell per µm2 after exposure to APO866 at different time points. Scale bar: 10 µm. n = 40 cells per condition. (C) Western blot analysis and corresponding quantification of SQSTM1 protein in untreated control cells and treated Jurkat cells with APO866 (10 nM) for different time points. n ≥ 5. (D) Western blot analysis and corresponding quantification of LC3-II form in untreated control cells and treated Jurkat cells in the presence of CQ, a lysosomal inhibitor, and/or APO866. Jurkat cells were pretreated with 25 µM for 1 h before 72 h of APO866 (10 nM) treatment to evaluate APO866-induced autophagososme formation. n ≥ 5. Data are mean ± SD **P < 0.01, ***P < 0.001.
APO866 induces caspase-dependent apoptosis in hematological malignant cells
This observation led us to examine whether apoptosis is also involved in the antileukemia/lymphoma effects of APO866. To this end, a time-course analysis of caspase activation, a hallmark of apoptosis, was evaluated in APO866-treated Jurkat cells. The caspases, a family of cysteine proteases, were subdivided into 2 groups: a) initiator caspases, such as CASP8 and CASP9,32 and b) executioner caspases, such as CASP3, CASP6, and CASP7.33 Western blot assay showed a steady increase of cleaved CASP3 triggered by APO866 treatment in a time-dependent manner, reaching a maximum at 72 h in Jurkat cells (Fig. 2A). This observation suggests the involvement of caspase-dependent apoptotic pathway in the antileukemia effects of APO866. To further extend these observations, we then assessed the activation of various caspases including CASP8, CASP9, and CASP3, on Jurkat cells treated for 72 h with 10 nM APO866 using the specific CaspGLOW™ Red Active for each caspase and flow cytometry. APO866 treatment strikingly increases CASP8, CASP9, and CASP3 activities in Jurkat cells compared with the basal level of apoptosis observed in untreated control cells corresponding to the small cell population positive for activated caspases (Fig. 2B). These results indicate that caspase-dependent apoptosis is also involved in the antileukemia effects of APO866. To examine whether the apoptosis induced by APO866 is restricted to Jurkat cells, hematopoietic cancer cells from 2 additional cell lines (Ramos and ML2: acute myeloid leukemia M4) from different hematological malignancies were incubated with APO866 for 72 h, and caspase activities detected as described above. APO866 also elicited a high level of caspases activity in Ramos and ML2 cells (Fig. S2A and S2B), confirming that apoptosis is involved in the antitumor activities exerted by APO866 in various types of hematopoietic tumor cells. Unlike results reported for multiple myeloma cells,17 these results indicated that APO866 can induce both autophagy and apoptosis in human leukemia/lymphoma cells.

Figure 2. APO866 activates caspases in Jurkat cells. (A) Western blot and corresponding quantification of the 19 and 17 kDa fragments of CASPASE 3 (CASP3) in untreated control cells (ct) and at different time points after APO866 (10 nM) treatment. Data are mean ± SD, n ≥ 5; ***P < 0.001. (B) Detection of fluorescent-activated caspases. Jurkat cells were treated with 10 nM APO866 for 72 h and activated forms of CASP3, CASP8 and CASP9 were detected using a fluorescent specific probe for each caspase and flow cytometry. Data are representative of at least 3 independent experiments.
BECN1-independent autophagy is required for antileukemia/lymphoma effects of APO866
We previously showed that lipid-kinase inhibitors (3-methyladenine, wortmannin, and LY294002) are capable of attenuating APO866-induced cell death in hematological malignancies, suggesting a contribution of autophagy in this process.3 However, these inhibitors may affect both the class I phosphoinositide 3-kinase and class III phosphatidylinositol 3-kinase, which are implicated in various biological pathways. To provide strong evidence of a specific implication of autophagy in APO866-induced cell death, we attempted to inhibit autophagy using lentiviral-mediated transduction of shRNAs targeting ATG5, ATG7, or BECN1 whose expressions are generally required to form autophagosomes. To provide evidence that autophagy-mediated cell death was not cell-type dependent, the cytotoxic effect of APO866 was investigated in 2 selected (Jurkat and Ramos) cell lines from different hematological malignancies. If autophagy is involved in APO866-induced cell death, then inhibiting autophagy by silencing of autophagy genes will provide protection against APO866 treatment. Decreased BECN1, ATG5, and ATG7 expressions in transduced-Jurkat (Fig. 3A–C) and Ramos (Fig. S3A–S3C) cells were confirmed by either western blot or Q-RT-PCR. Downregulation of ATG5, ATG7, and BECN1 were not cytotoxic in basal conditions as confirmed by no significant effect on basal activation of CASP3 (Fig. S4). Lentiviral vectors delivering shRNA against BECN1, ATG5, and ATG7 clearly decreased LC3-II accumulation produced after 6 h in the presence of CQ in Jurkat (Fig. S5) and Ramos cells (Fig. S3D), showing that basal autophagosome formation was reduced in these transduced malignant cells. Interestingly, APO866-mediated autophagy appeared to be BECN1-independent since only ATG5 and ATG7 downregulation prevented the LC3-II increase from 24 h to 48 h after APO866 treatment (Fig. 4A; Fig. S3E) and SQSTM1 degradation at 72 h (Fig. 4B). Importantly, downregulating the expression of ATG5 and ATG7, but not of BECN1 abrogated APO866-induced cell death in Jurkat (Fig. 5A) and Ramos cells (Fig. S6A). To support evidence of protective effects provided by downregulation of ATG5 and ATG7 in drug-treated hematopoietic malignant cells, we examined the effect of APO866 treatment on cell growth. To this end, 10x6 untransduced Jurkat cells (hereafter called WT) or with knocked down ATG genes were cultured in presence or absence of 10 nM APO866 and cell number was counted after a 72 h drug exposure. As shown in Figure 5B, in all untreated conditions, cell number increased at least 2 times over plated cells. No cell growth was observed in treated-WT, scrambled shRNA- and BECN1-transduced Jurkat cells and, in addition, APO866 reduced cell viability in the latter cell lines to 22%, 18%, and 11% compared with 95%, 94%, and 92% in untreated ones. In accordance with the above-mentioned data on cell death using ANXA5 and 7AAD staining, downregulation of ATG5 and ATG7 fully prevented APO866 inhibitory effects on cell growth in term of cell number as well as cell viability (Fig. 5B). Remarkably, this protection could still be observed 10 d after drug treatment (Fig. 5C; Fig. S6B). These results clearly indicate that autophagy is required in APO866-induced cell death in leukemia/lymphoma cells.
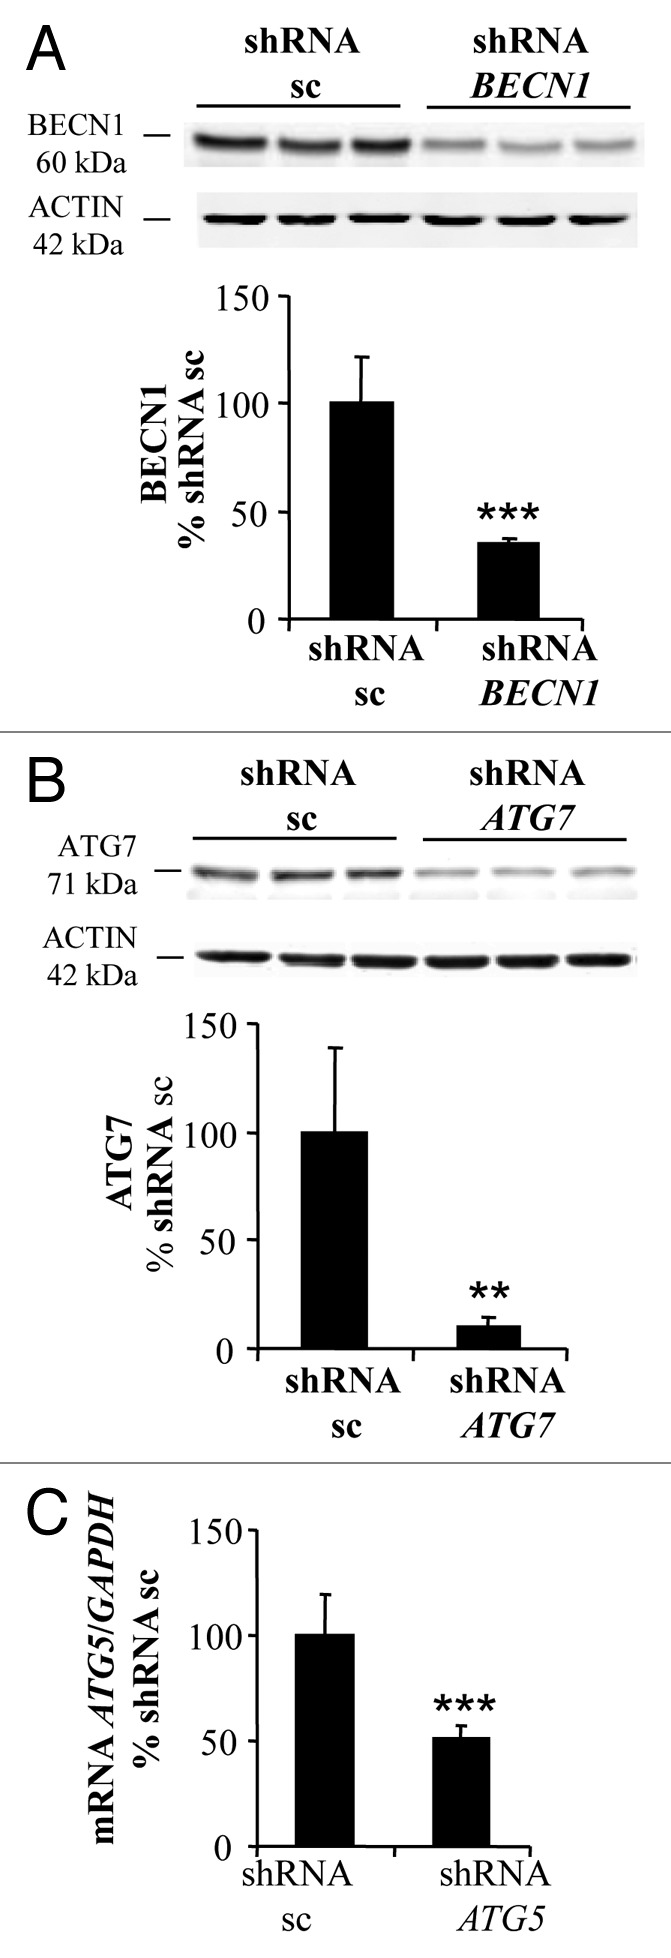
Figure 3. BECN1, ATG7, and ATG5 are efficiently downregulated in Jurkat cells. Jurkat cells were stably transduced with lentiviral vectors delivering either control scrambled (sc) shRNA or shRNAs targeting BECN1, ATG5, and ATG7. Western blot analysis and corresponding quantifications of BECN1 (A) and ATG7 (B) protein expression level or Q-RT-PCR assays for ATG5 mRNA (C) were performed to confirm the efficiency of the downregulation. Data are mean ± SD, n = 6; **P < 0.01, ***P < 0.001.

Figure 4. ATG7 and ATG5 downregulation prevents APO866-induced autophagy in Jurkat cells. (A) Western blot analysis and corresponding quantification of LC3-II in Jurkat cells stably transduced with scrambled shRNA (sc) or shRNAs targeting BECN1, ATG5, and ATG7 and treated with APO866 (10 nM) for 24 h and 48 h or untreated (ct). n ≥ 4. (B) Western blot analysis and corresponding quantification of SQSTM1 in transduced cells treated with APO866 (10 nM) for 72 h. n ≥ 9. Data are mean ± SD; *P < 0.05, **P < 0.01, ***P < 0.001. NS = nonsignificant.

Figure 5. Autophagy is required for APO866-induced cell death. Cytotoxicity induced by APO866 on Jurkat cells, either wild type (WT) or lentivirally transduced with scrambled (sc) shRNA or shRNAs targeting BECN1, ATG5, and ATG7. Cell death after 72 h (A) and 240 h (C) of APO866 (10 nM) treatments as well as cell growth after 72 h-drug exposure (B) were assessed by flow cytometry using ANXA5 and 7-aminoactinomycin D (7AAD) staining and trypan blue exclusion test. The percentage of early apoptotic cells (ANXA5+ 7AAD−) or live (unstained with trypan blue dye) cells are shown as white columns and that of late apoptotic cells (ANXA5+ 7AAD+) or dead (trypan blue stained) cells are shown as solid black columns. Data are mean ± SD, n ≥ 3; ***P < 0.001.
Since caspase activation was detected in APO866-treated leukemia/lymphoma cells, we next examined whether APO866-induced cell death was also caspase-dependent. To this end, Jurkat, Ramos, and ML2 were treated with APO866 at different time points, and in the presence or absence of a broad caspase inhibitor, zVAD.fmk (Fig. 6A). Our results revealed that caspase inhibition delayed but did not prevent APO866-induced cell death (Fig. 6A; Fig. S7), which suggests that caspases inhibition alone, is not effective to prevent APO866-induced cytotoxicity. Interestingly when CASP3 activation was assessed by western blot in Jurkat cells that were knocked down for ATG5 and ATG7, cleavage of CASP3 was fully prevented 72 h after APO866 treatment unlike cells infected with control vector or BECN1 shRNA-transduced cells (Fig. 6B). This result suggests that autophagy induction acts upstream of CASP3 and contributes to its activation.

Figure 6. Autophagy contributes to APO866-induced CASP3 activation in Jurkat cells. (A) Time-course analysis of cell death induced by APO866 (10 nM) on Jurkat cells in the presence of pancaspase inhibitor, zVAD.fmk (100 µM). Cell death was assessed as described in Figure 5. Data are mean ± SD, n ≥ 3; **P < 0.01 (vs APO866-treated cells). (B) Western blot analyses and corresponding quantifications of cleaved CASP3 in Jurkat cells lentivirally transduced with scrambled (sc) shRNA or shRNAs targeting BECN1, ATG5, and ATG7 and exposed to APO866 (10 nM) for 72 h. Data are mean ± SD, n ≥ 10; *P < 0.05, ***P < 0.001.
Taken together, these results strongly suggest that APO866-induced cell death is i) highly dependent on autophagy, and ii) involves activation of caspases, which iii) is regulated by autophagy. Nevertheless, caspase activity appears to be dispensable for the occurrence of APO866-induced cell death and its significance is unclear.
APO866 induces ROS generation through autophagy-dependent CAT degradation
We and others demonstrated that APO866 is a highly potent NAD depleting agents in various malignant cells.2,3,11,17,18,22 The intracellular content of NAD(P)H/NAD(P)+ plays a crucial role in numerous redox reactions. Cellular redox status is one of the main mechanisms involved in control and regulation of cell death pathways, including apoptotic, autophagic, and necrotic processes. Depleting NAD is expected to perturb the NAD(P)H/NAD(P)+ ratio which will result in the production of high levels of ROS that would lead to cell death. We then hypothesized that NAD depletion induced by APO866 in hematological malignant cells would result in increased ROS production that would lead to cell damage and finally to cell death. To test this issue, cytosolic and mitochondrial superoxide productions as well as intracellular hydrogen peroxide were monitored in leukemia/lymphoma cells treated with APO866 using DHE and MitoSOX as well as the carboxy-H2DCFDA probe, respectively. As expected, APO866 caused an increase level of both cytosolic and mitochondrial ROS in all treated cell types (Fig. 7A; Fig. S8A–S8C). This finding is in accordance with a recent study that reports ROS production in glioblastoma cells treated with another NAMPT inhibitor.34 As excessive ROS generation leads to mitochondrial damage, these findings are consistent with our previous study that reports the mitochondrial depolarization in APO866-treated leukemia/lymphoma cells.3 ROS accumulation may be caused by either an increase in ROS production or decreased ROS degradation. To explain the increase in ROS production in APO866-treated leukemia/lymphoma cells, we investigated whether APO866 would affect the expression of CAT, one of the key enzymatic ROS scavengers, in leukemia/lymphoma cells. Indeed, western blot analysis demonstrated a time-dependent decrease in CAT expression in response to APO866 in all of the cell lines that were analyzed (Fig. 7B; Fig. S8D), suggesting an involvement of CAT degradation in ROS production.

Figure 7. APO866 induces ROS generation and CATALASE (CAT) degradation in Jurkat cells. (A) Detection of ROS production in Jurkat cells treated with APO866 (10 nM) for 72 h. Cytosolic, mitochondrial superoxide, and hydrogen peroxide were detected by flow cytometry using DHE, MitoSOX, and DCFDA fluorescent probe, respectively. Data are mean ± SD, n ≥ 3. (B) Western blot analysis and corresponding quantifications of CAT expression in wild-type Jurkat cells untreated (ct) and treated with APO866 (10 nM) at different time points. Data are mean ± SD, n ≥ 9; *P < 0.05, **P < 0.01, ***P < 0.001.
Autophagy acts upstream of ROS production and mitochondrial depolarization in APO866-treated malignant cells
It has been shown that autophagy can be in some cases regulated by ROS35,36 and in other cases be involved in ROS production.37 To determine whether ROS accumulation in APO866-treated hematopoietic tumor cells is upstream or downstream of autophagy induction, we investigated the effect of ATG5 and ATG7 downregulation on ROS production. If ROS is acting upstream of autophagy induction, inhibition of autophagy with genetic approaches will have no effect on ROS accumulation. Otherwise, autophagy inhibition will decrease or prevent ROS production. To determine the role played by autophagy in APO866-induced ROS production, shRNA-transduced Jurkat and Ramos cells were exposed to APO866 for various time and intracellular ROS production was measured using MitoSOX, carboxy-H2DCFDA and flow cytometry. Our data showed that downregulation of ATG5 or ATG7 strongly reduced the APO866-induced ROS accumulation compared with control vector and BECN1 shRNA-transduced (Fig. 8A and B; Fig. S9A and S9B) or WT cells (Fig. 7A; Fig. S8A–S8C). This argues for autophagy induction upstream of ROS production.

Figure 8. Autophagy is a key player in APO866-induced ROS generation in Jurkat cells. Detection of ROS production in Jurkat cells stably transduced with scrambled shRNA (sc) or shRNAs targeting BECN1, ATG5, and ATG7 and treated with APO866 (10 nM) at different time points. Mitochondrial superoxide (A) and hydrogen peroxide (B) were detected by flow cytometry using MitoSOX and DHE. Data are mean ± SD, n ≥ 3; ***P < 0.001 (vs APO866-treated, sc shRNA-transduced cells).
Autophagy selectively degrades CAT in APO866-treated malignant cells
CAT was reported to be a selective substrate of autophagy in a condition of autophagy-mediated cell death.38 CAT degradation in APO866-treated hematological malignant cells might then be a way for autophagy to regulate ROS production. To test this hypothesis, Jurkat cells downregulated for BECN1, ATG5 and ATG7 were incubated with or without APO866 for 72 h and the expression level of CAT was determined by western blot assay. Whereas inhibition of autophagy by transduction of ATG5, ATG7 and BECN1 shRNA had no significant effect on CAT expression in basal conditions (Fig. S4), downregulation of ATG5 or ATG7 completely abrogated APO866-induced CAT depletion. The transduction of BECN1 shRNA or control vector had no such effect (Fig. 9A; Fig. S4). Consequently, inhibition of BECN1-independent autophagy also prevented the mitochondrial depolarization induced by APO866 treatment (Fig. 9B; Fig. S9C). Altogether, these data strongly suggest that APO866-induced autophagy is responsible for CAT degradation and subsequent excessive ROS accumulation which leads to a loss of MMP and ultimately to cell death.

Figure 9. Autophagy is involved in APO866-induced CAT degradation in Jurkat cells. (A) Western blot analysis and corresponding quantifications of CAT expression in Jurkat cells lentivirally transduced with scrambled (sc) shRNA or shRNAs targeting BECN1, ATG5, and ATG7 and exposed to APO866 (10 nM) for 72 h. Data are mean ± SD, n ≥ 8; ***P < 0.001. (B) Detection of mitochondrial membrane potential (MMP) in Jurkat cells transduced with sc shRNA or shRNAs targeting BECN1, ATG5, or ATG7, and exposed to APO866 (10 nM) for 72 h. MMP was measured using JC-1 and flow cytometry staining red vs. green fluorescence as described in Materials and Methods. Data are mean ± SD, n ≥ 3; ***P < 0.001.
Exogenous addition of CAT abrogates the antileukemic/lymphoma effects of APO866
The above results suggest that CAT degradation plays a pivotal role in APO86-induced cell death in leukemia/lymphoma cells. To provide evidence for this, we treated cells from lines and primary cells from patients diagnosed with various hematological malignancies with or without APO866 in the presence or absence of exogenous addition of CAT. Cell death was monitored using ANXA5 and 7AAD, using flow cytometry. As predicted, the extracellular addition of CAT completely blocked APO866-induced cell death in all analyzed tumor cells, independently of hematological malignancies (Fig. 10A; Fig. 11), highlighting its essential role in APO866-antitumor activities. Importantly, the CAT protective effects were still observable more than a week after APO866 treatment (Fig. 10B). This finding confirms that CAT degradation in response to APO866 plays a major role in the cytotoxic activity of this NAMPT inhibitor.

Figure 10. Extracellular addition of CAT prevents APO866-mediated cell death in various hematopoietic malignant cell lines. Cells were incubated with or without CAT (500 or 1000 U/ml) in the presence or absence of APO866 (10 nM). Cell death was assessed (A) 72 h and (B) 168 h after drug exposure and as described in Figure 5. Data are derived from at least 3 independent experiments.

Figure 11. Exogenous addition of CAT abrogates APO866-induced cell death in various primary hematopoietic malignant cells from patients. Cells were incubated with or without CAT (500 U/ml) in the presence or absence of APO866 (10 nM). Cell death was assessed 72 h after drug exposure and as described in Figure 5.
Discussion
In the present study, we showed that treatment of leukemia/lymphoma cells with APO866 induces both autophagy and apoptosis, and that suppression of autophagy prevents APO866-induced caspase activation, CAT degradation, ROS production, and cell death in hematopoietic malignant cells. This suggests a crosstalk between autophagy and apoptosis.
Apoptosis was revealed by observing increases in the activation of CASP8, CASP9, and CASP3 in APO866-treated malignant cells. Our data further reveals that pancaspase inhibitor could not prevent, but only delayed, APO866-induced cell death, suggesting that both caspase-dependent and -independent cell death modes are involved. These results are in line with previous studies indicating that apoptosis is a mechanism acting in APO866-induced cell death,2,4,18,20 but suggest that its role in the mediation of the death is only moderate in the hematological cancers studied here.
We confirm here a key role of autophagy in cell death that occurs as a consequence of NAMPT inhibition. Evidence for autophagy induction in leukemia/lymphoma cells treated with APO866 were provided by i) western blot assays showing an accumulation of LC3-II and degradation of SQSTM1; ii) immunocytochemistry showing increased formation of LC3-positive dots. The validity of these autophagic markers was confirmed by the fact that they were inhibited as result of knockdown of ATG5 or ATG7, but not BECN1, in hematopoietic malignant cells. The occurrence of noncanonical autophagy that is dependent on ATG5 and ATG7, but not BECN1 has been reported previously.26,39 Strikingly, the knockdowns that inhibited autophagy (ATG5 or ATG7) completely blocked APO866-induced cell death, whereas the BECN1 knockdown, which failed to reduce autophagy, also failed to reduce cell death. This is strong evidence for the implication of autophagy in APO866-induced leukemia/lymphoma effects of APO866.
In the past decade, autophagy has been extensively studied.12,16,40 In most studies, autophagy functions as a survival mechanism under stress conditions41-44 and its role in cell death is less well established. In efforts to elucidate the molecular mechanisms by which APO866 triggers autophagy-mediated cell death in leukemia/lymphoma cells, our results demonstrated that APO866 treatment in various hematopoietic malignant cells increases autophagic activities that result in CAT degradation. Thus, depletion of CAT led to ROS (cytosolic and mitochondrial superoxide as well as intracellular hydrogen peroxide) accumulation and, ultimately to cell death. To delineate the importance of CAT depletion in APO866-induced cell death, we showed that exogenous addition of CAT totally blocked the APO866 killing effects in various hematological malignant cells. These findings show for the first time the crucial role of antioxidants (CAT) in autophagy-mediated cell death in APO866-treated hematopoietic malignant cells. However, based on our results, we cannot rule out the implication of other antioxidant enzymes in this process. Indeed, there are other antioxidants playing a similar role to CAT in cell detoxification, i.e., glutathione peroxidase, and peroxiredoxin III. All these enzymes convert H2O2 to H2O. Additionally, extracellular addition of CAT has been reported to lower the concentration of superoxide anions, thereby masking the effects of superoxide dismutase depletion.35,45 Further experiments are warranted to specifically elucidate mechanisms by which APO866 degrades CAT expression and to also explore the effects of APO866 treatment on all antioxidant enzymes in tumor cells.
Our findings are consistent with previous studies indicating the involvement of autophagy in APO866-induced cell death.10,17,22 However, they extend these observations to leukemia and lymphoma cells and also show for the first time that autophagy induction by APO866 is required for the initiation of the caspase cascade in response to the same agent. Autophagy may control apoptosis in APO866-treated leukemia/lymphoma cells through ROS production. We provide evidence that APO866 triggers a tremendous increase of ROS production via antioxidant depletion. A high level of ROS production is known to be deleterious for cell health, since it oxidizes proteins, lipids, and cell organelles, including mitochondria, leading to cell death. This explains the depolarization of mitochondria observed in APO866-treated hematopoietic malignant cells. Furthermore, accumulation of ROS in mitochondria is known to impair ATP production, induce membrane permeabilization, and lead to apoptosis. Consequently, inhibition of autophagy will preserve the cellular antioxidant contents, which will block APO866-induced ROS production, and thereby avoiding apoptosis. Importantly, unlike previous studies published elsewhere, autophagy induced by APO866 treatment in leukemia/lymphoma is upstream of ROS production. Notably, here, we did not address how APO866 initiates autophagy in leukemia/lymphoma cells although a likely mechanism is through ATP depletion with consequent mTORC1 inhibition and via TFEB pathways, as it has been shown in multiple myeloma cells.27 Whether the pathway is similar in leukemia/lymphoma cells needs to be clarified.
In conclusion, we demonstrated induction of autophagy and apoptosis upon APO866 treatment in leukemia/lymphoma cells. Apoptosis was induced by both caspase-dependent and -independent pathways and was under the control of autophagy. Autophagy-mediated cell death in response to the NAMPT inhibitor was likely induced via noncanonical pathways that are ATG5 and ATG7-dependent but BECN1-independent. These findings open up a new approach to enhancing the antitumor activities of APO866 by modulating the autophagic machinery. Efforts to unravel the molecular mechanisms underlying APO866-induced cytotoxicity are expected to greatly improve our understanding of the effects of NAD depletion in cancer cells and aid in the development of novel anticancer therapy approaches.
Materials and Methods
Cell lines and culture conditions
Seven hematological cancer cell lines were purchased from DSMZ (German Collection of Microorganisms and Cell Cultures) or ATCC and include: Jurkat and Molt-4 (T-acute lymphoblasic leukemia); ML-2, MV4-11, and NOMO-1 (acute myeloid leukemia); Ramos (Burkitt lymphoma); and RPMI8226 (multiple myeloma).
Primary cells from 6 patients were also analyzed. Study protocols were approved by the ethics committee at the University of Lausanne. Primary cells were collected from peripheral blood (purity > 90%) from patients with acute myeloid leukemia (n = 1); and B-chronic lymphocytic leukemia (n = 5).
All cells were cultured in RPMI (Invitrogen AG, 61870-01) supplemented with 10% heat inactivated fetal calf serum (Amimed, 2-01F30-I) and 1% penicillin/streptomycin at 37 °C (Amimed, 4-01F00-H) in a humidified atmosphere of 95% air and 5% CO2.
Flow cytometry analyses
Various cellular effects induced by clinical grade APO866, (kindly provided by TopoTarget), on hematopoietic malignant cells were evaluated using a Beckman Coulter Cytomics FC500 flow cytometer (Beckman Coulter International S.A.) and included following functional cell parameters: cell death, caspase activation status, ROS production, and MMP.
Cell death analysis
APO866-induced cell death was determined using ANXA5/ANNEXIN-V (eBioscience, BMS306FI/300) and 7-aminoactinomycin D (7AAD, Immunotech, A07704) staining as described by the manufacturer and analyzed using flow cytometry. Dead cells were identified as ANXA5+ and/or 7AAD+.
Detection of caspase activation
Activation of various caspases was assessed using flow cytometry and specific CaspGLOW™ Red Active for following caspases: CASP3 (BioVision Inc., BV-K193-100), CASPASE 8 (CASP8; BioVision Inc., BV-K198-100), and CASPASE 9 (CASP9; BioVision Inc., BV-K199-25). The CaspGLOW assays offer a convenient way for measuring activated caspases in living cells. The assay uses a specific inhibitor for each caspase conjugated to sulfo-rhodamine as fluorescent marker, which is cell permeable, nontoxic, and irreversibly binds in specific manner to activated caspase in apoptotic cells. The red fluorescence label allows for direct detection of activated caspase in apoptotic cells by flow cytometry. Cell staining was performed according to manufacturer’s information and analyzed using flow cytometry.
Assessment of mitochondrial membrane potential
MMP was determined using flow cytometry after cell staining with 5,5′,6,6′-tetrachloro-1,1′,3,3′-tetraethylbenzimididazolyl-carbocyanine iodide (JC-1, Calbiochem, 420200-5). JC-1 is a cell permeant, fluorescent dye that readily accumulates in active mitochondria due to their relative negative charge. JC-1 accumulates in the mitochondria, showing green fluorescence at a low MMP and forming red fluorescent J-aggregates at higher MMP. A drop in MMP is indicated by a decrease in the ratio of the red signal to the green signal. Briefly, cells were cultured in the presence or absence of APO866 for 24 to 96 h. Cells were centrifuged, resuspended in phosphate-buffered saline (PBS) containing 5 µM JC-1, and were then incubated at 37 °C for 15 min in the dark. The cells were washed twice with prewarmed PBS, and immediately analyzed using flow cytometry.
Detection of cellular and mitochondrial ROS
Intracellular levels of cytosolic and mitochondrial superoxide as well as hydrogen peroxide production were determined in APO866- and control-treated hematological malignant cells by flow cytometry using live-cell permeant-specific fluorogenic probes, dihydroethidium (DHE; Marker Gene Technologies Inc, MGT-M1241-M010), MitoSOX (Molecular Probes, M36008, and 6-carboxy-2′,7′-dichlorodihydrofluorescein diacetate (carboxy-H2DCFDA; Molecular Probes, C-400), respectively. DHE is oxidized to red fluorescent ethidium by cytosolic superoxide and MitoSOX is selectively targeted to mitochondria, where it is oxidized by superoxide and exhibits red fluorescence. Carboxy-H2DCFDA is cleaved by esterase to yield DCFH, a polar nonfluorescent product, but in presence of hydrogen peroxide the latter is oxidized to green fluorescent product, dichlorofluorescent (DCF). For cell staining, cells were centrifuged and the pellets were resuspended in PBS with a final concentration of 5 μM for each probe. The mixture was incubated in the dark at 37 °C for 15 min. Then, the cell suspension was analyzed using flow cytometry within 20 min.
Assessment of cell number using Trypan blue exclusion assay
Hematological malignant cells in the exponential growth phase were plated in triplicates in 24-well plates at a density of 1 × 10⁶ cells/well in 1ml media in presence or absence of 10 nM APO866 for 72 h. Cells from each sample were incubated with 10 µl TC10TM trypan blue dye (BIO-RAD 145-0013; at a 1:1 ratio [vol/vol] for 1 min). Cell number was counted using TC20TM Automated Cell counter (BIO-RAD, 145-0102). Dead cells are defined as stained (in blue) cells and live cells as unstained cells.
Lentiviral vectors and virus production
Recombinant lentiviruses delivering anti-ATG shRNAs specific for human genes from TRC (the RNAi consortium) library in pLKO lentiviral vectors were used as follows: TRCN0000099431 for ATG5 (GenBankTM NM_004849), TRCN0000033552 for BECN1 (GenBankTM NM_003766), and TRCN0000007584 for ATG7 (GenBankTM NM_006395) (Openbiosystems). Self-inactivating lentiviral vectors were produced by cotransfecting 293T cells with the lentiviral expression plasmid, and packaging plasmids using the calcium phosphate method. Infectious lentiviruses were harvested at 48 h post-transfection, the supernatant was collected, filtered, concentrated by ultracentrifugation, resuspended in 1% bovine serum albumin in PBS and then stored at −80 °C until use as described previously.46 Viral particle content was assayed for the p24 core antigen by using the p24 antigen enzyme-linked immunosorbent assay (RETROtek, Gentaur) according to the manufacturer’s instructions.
Infection and generation of stable knockdown cell lines
To establish Jurkat or Ramos cell lines stably expressing a specific shRNA against ATGs, 6 × 10⁶ Jurkat or Ramos cells were seeded in a T25 cell culture flask and transduced with 50 ng of p24/ml culture medium for each vector. In parallel, Jurkat or Ramos cells were transduced with a lentiviral vector encoding a scrambled shRNA (sc shRNA) as an infection control. After 48 h, the transduced cells were selected by adding 10 μg/ml puromycin (Invitrogen) for 3 d.
Immunoblotting
Protein samples were harvested in lysis buffer containing 20 mmol/L HEPES, pH 7.4, 10 mmol/L NaCl, 3 mmol/L MgCl2, 2.5 mmol/L EGTA, 0.1 mmol/L dithiothreitol, 50 mmol/L NaF, 1 mmol/L Na3VO4 or for LC3 expression analysis in a Tris-HCl buffer, pH 7.4, containing 150 mM NaCl, 5 mM EDTA, 1% triton X-100, 2 mM sodium orthovanadate, 0.5 mM phenylmethylsulphonyl fluoride, 0.05% aprotinin (w/v), and 1 mM dithiotreitol. A protease inhibitor cocktail (Roche, 11873580001) was added. Lysates were sonicated and protein concentration was determined using a Bradford assay. Proteins (25–40 μg) were separated by SDS-PAGE on an 8, 10, or 14% polyacrylamide gel, and analyzed by immunoblotting. The following primary antibodies were used for protein immunodetection: anti-APG7 (sc-33211, 1/1000) rabbit polyclonal, anti-BECN1 (sc-11427, 1/1000) and anti-ACTA/α-ACTIN (MAB1501, 1/1000) mouse monoclonal antibodies from Millipore, anti-BECN1 (sc-11427, 1/1000) from Santa Cruz Biotechnology; anti-LC3 (NB100-2220, 1/1000) rabbit polyclonal antibody from Novus Biologicals; anti-CAT (AF3398, 1/2000) goat polyclonal antibody from R&D Systems, anti-active CASP3 (9661, 1/1,000) rabbit polyclonal antibodies from Cell Signaling Technology; anti-SQSTM1/p62 (P0067, 1/1,000) rabbit polyclonal antibody from Sigma-Aldrich. After incubation with primary antibody, the following secondary antibodies were applied: polyclonal goat anti-mouse or goat anti-rabbit IgG conjugated with IRDye 680 (LI-COR, B70920-02) or IRDye 800 (LI-COR, 926-32210). Protein bands were visualized using the Odyssey Infrared Imaging System (LI-COR). Odyssey v1.2 software (LI-COR) was used for densitometric analysis. OD values were normalized according to Ponceau staining as loading control because the level of expression of classical single-protein loading controls such as ACT/ACTIN or GAPDH (not shown) are significantly modified by APO866 treatment from 72 h. Data were expressed as a percentage of values obtained for control untreated cells (uninfected or infected with control vector transducing the scrambled shRNA) (100%).
Immunocytochemistry and quantification of LC3-positive dots
Jurkat cells cultured in 6-well plates were centrifuged, fixed with 4% paraformaldehyde in PBS (pH 7.4) for 20 min on ice and then plated on poly-l-lysine coated glass slides. Jurkat cells were first incubated for blocking and permeabilization in PBS with 10% donkey serum and 0.1% Triton X-100 for 30 min. Then, cells were incubated with the anti-LC3 rabbit polyclonal antibody (Abcam, ab48394, 1/100) diluted in 1.5% of donkey serum in PBS overnight at 4 °C. Alexa Fluor 488 donkey-anti-rabbit (Invitrogen, A21206) or Alexa Fluor 594 donkey-anti-rabbit (Invitrogen) secondary antibodies, diluted in PBS with 1% of donkey serum (1/200), were applied for 2 h at room temperature. After several washes in PBS, Hoechst staining was done to reveal cell nuclei and slides were mounted with FluoroSave (Calbiochem, 345-789-20). Confocal images of immunocytochemistry against LC3 were acquired using a Zeiss LSM 710 confocal laser scanning microscope (Carl Zeiss) and images were then processed with Adobe Photoshop 5.0. LC3-positive dots were analyzed using ImageJ software and expressed as the number of LC3-positive dots per cell per μm2.
Quantitative Real-Time-Polymerase Chain Reaction (Q-RT-PCR)
Because the different antibodies tested to evaluate ATG5 expression by western blot were not convincing in term of specificity in our hands, Q-RT-PCR was used to demonstrate the efficiency of ATG5 shRNA. Total RNA was extracted using RNeasy Mini kit (Qiagen). Eluted RNA was analyzed (quantity and quality) using Agilent RNA 6000 Nano kit (Agilent Technologies). RNA was reverse transcribed to cDNA with the High Capacity cDNA Reverse Transcription kit (Applied Biosystem). Then, Q-RT-PCR was performed with the MyiQ Single Color RT-PCR detection system using iQ SyBR Green Supermix (Biorad) as described by Berta et al.47 The following primers were used for human ATG5: forward 5′-CCTTGGAACA TCACAGTACA T-3′, reverse 5′- CATCTTCAGG ATCAATAGCA G-3′; human GAPDH: forward 5′-CCCCCAATGT ATCCGTTGTG-3′, reverse 5′-TAGCCCAGGA TGCCCTTTAG T-3′.
Statistical analysis
All assays were performed in triplicate and expressed as the mean and standard deviation (SD). All pair-wise comparisons were analyzed by Tukey-Kramer multiple comparisons test or by one-way ANOVA followed by the Student t test (2-tailed, 2-sample and unequal variance). GraphPad Prism version 6.00 (GraphPad Software) was used for statistical analysis. P values < 0.05 were considered statistically significant.
Supplementary Material
Disclosure of Potential Conflicts of Interest
No potential conflicts of interest were disclosed.
Acknowledgments
We thank TopoTarget for kindly providing us with clinical grade APO866. We also thank Peter GH Clarke for critical reading of the manuscript. This work was supported by a grant from the Faculty of Biology and Medicine of the University of Lausanne (A Nahimana, J Puyal), the Fondation Dr Henri Dubois-Ferrière Dinu Lipatti (A Nahimana), the Swiss National Science Foundation (J Puyal), the AIRC (A Nencioni), and the FP7 project PANACREAS (A Nahimana, A Nencioni, MA Duchosal).
Glossary
Abbreviations:
- 7AAD
7-aminoactinomycin
- ANXA5
annexin AV
- ATG5
autophagy related 5
- ATG7
autophagy related 7
- ATP
adenosine triphosphate
- BECN1
Beclin 1, autophagy related
- carboxy-H2DCFDA
6-carboxy-2′,7′-dichlorodihydrofluorescein diacetate
- CASP3
caspase 3, apoptosis-related cysteine peptidase
- CASP8
caspase 8, apoptosis-related cysteine peptidase
- CASP9
caspase 9, apoptosis-related cysteine peptidase
- CAT
catalase
- CQ
chloroquine
- DHE
dihydroethidium
- MAP1LC3 (LC3)
microtubule-associated protein 1 light chain 3
- MMP
mitochondria membrane potential
- NAD
nicotinamide adenine dinucleotide
- NAMPT
nicotinamide phosphoribosyltransferase
- PARP1
poly(ADP-ribose) polymerase 1
- PBS
phosphate-buffered saline
- ROS
reactive oxygen species
- shRNA
short/small hairpin ribonucleic acid
- Q-RT-PCR
quantitative real-time–polymerase chain reaction
- SQSTM1/p62
sequestosome 1
- zVAD.fmk
carbobenzoxy-valyl-alanyl-aspartyl-O-methyl-fluoromethylketone
Reference
- 1.Martin DS, Schwartz GK. Chemotherapeutically induced DNA damage, ATP depletion, and the apoptotic biochemical cascade. Oncol Res. 1997;9:1–5. [PubMed] [Google Scholar]
- 2.Hasmann M, Schemainda I. FK866, a highly specific noncompetitive inhibitor of nicotinamide phosphoribosyltransferase, represents a novel mechanism for induction of tumor cell apoptosis. Cancer Res. 2003;63:7436–42. [PubMed] [Google Scholar]
- 3.Nahimana A, Attinger A, Aubry D, Greaney P, Ireson C, Thougaard AV, Tjørnelund J, Dawson KM, Dupuis M, Duchosal MA. The NAD biosynthesis inhibitor APO866 has potent antitumor activity against hematologic malignancies. Blood. 2009;113:3276–86. doi: 10.1182/blood-2008-08-173369. [DOI] [PubMed] [Google Scholar]
- 4.Zhang LY, Liu LY, Qie LL, Ling KN, Xu LH, Wang F, Fang SH, Lu YB, Hu H, Wei EQ, et al. Anti-proliferation effect of APO866 on C6 glioblastoma cells by inhibiting nicotinamide phosphoribosyltransferase. Eur J Pharmacol. 2012;674:163–70. doi: 10.1016/j.ejphar.2011.11.017. [DOI] [PubMed] [Google Scholar]
- 5.Zoppoli G, Cea M, Soncini D, Fruscione F, Rudner J, Moran E, Caffa I, Bedognetti D, Motta G, Ghio R, et al. Potent synergistic interaction between the Nampt inhibitor APO866 and the apoptosis activator TRAIL in human leukemia cells. Exp Hematol. 2010;38:979–88. doi: 10.1016/j.exphem.2010.07.013. [DOI] [PubMed] [Google Scholar]
- 6.Berger F, Lau C, Dahlmann M, Ziegler M. Subcellular compartmentation and differential catalytic properties of the three human nicotinamide mononucleotide adenylyltransferase isoforms. J Biol Chem. 2005;280:36334–41. doi: 10.1074/jbc.M508660200. [DOI] [PubMed] [Google Scholar]
- 7.Revollo JR, Grimm AA, Imai S. The regulation of nicotinamide adenine dinucleotide biosynthesis by Nampt/PBEF/visfatin in mammals. Curr Opin Gastroenterol. 2007;23:164–70. doi: 10.1097/MOG.0b013e32801b3c8f. [DOI] [PubMed] [Google Scholar]
- 8.Hufton SE, Moerkerk PT, Brandwijk R, de Bruïne AP, Arends JW, Hoogenboom HR. A profile of differentially expressed genes in primary colorectal cancer using suppression subtractive hybridization. FEBS Lett. 1999;463:77–82. doi: 10.1016/S0014-5793(99)01578-1. [DOI] [PubMed] [Google Scholar]
- 9.Van Beijnum JR, Moerkerk PT, Gerbers AJ, De Bruïne AP, Arends JW, Hoogenboom HR, Hufton SE. Target validation for genomics using peptide-specific phage antibodies: a study of five gene products overexpressed in colorectal cancer. Int J Cancer. 2002;101:118–27. doi: 10.1002/ijc.10584. [DOI] [PubMed] [Google Scholar]
- 10.Billington RA, Genazzani AA, Travelli C, Condorelli F. NAD depletion by FK866 induces autophagy. Autophagy. 2008;4:385–7. doi: 10.4161/auto.5635. [DOI] [PubMed] [Google Scholar]
- 11.Bruzzone S, Fruscione F, Morando S, Ferrando T, Poggi A, Garuti A, D’Urso A, Selmo M, Benvenuto F, Cea M, et al. Catastrophic NAD+ depletion in activated T lymphocytes through Nampt inhibition reduces demyelination and disability in EAE. PLoS One. 2009;4:e7897. doi: 10.1371/journal.pone.0007897. [DOI] [PMC free article] [PubMed] [Google Scholar]
- 12.Klionsky DJ, Emr SD. Autophagy as a regulated pathway of cellular degradation. Science. 2000;290:1717–21. doi: 10.1126/science.290.5497.1717. [DOI] [PMC free article] [PubMed] [Google Scholar]
- 13.Clarke PG, Puyal J. Autophagic cell death exists. Autophagy. 2012;8:867–9. doi: 10.4161/auto.20380. [DOI] [PMC free article] [PubMed] [Google Scholar]
- 14.Clarke PG. Developmental cell death: morphological diversity and multiple mechanisms. Anat Embryol (Berl) 1990;181:195–213. doi: 10.1007/BF00174615. [DOI] [PubMed] [Google Scholar]
- 15.Lenardo MJ, McPhee CK, Yu L. Autophagic cell death. Methods Enzymol. 2009;453:17–31. doi: 10.1016/S0076-6879(08)04002-0. [DOI] [PMC free article] [PubMed] [Google Scholar]
- 16.Ohsumi Y. Molecular dissection of autophagy: two ubiquitin-like systems. Nat Rev Mol Cell Biol. 2001;2:211–6. doi: 10.1038/35056522. [DOI] [PubMed] [Google Scholar]
- 17.Cea M, Cagnetta A, Fulciniti M, Tai YT, Hideshima T, Chauhan D, Roccaro A, Sacco A, Calimeri T, Cottini F, et al. Targeting NAD+ salvage pathway induces autophagy in multiple myeloma cells via mTORC1 and extracellular signal-regulated kinase (ERK1/2) inhibition. Blood. 2012;120:3519–29. doi: 10.1182/blood-2012-03-416776. [DOI] [PMC free article] [PubMed] [Google Scholar]
- 18.Thakur BK, Dittrich T, Chandra P, Becker A, Kuehnau W, Klusmann JH, Reinhardt D, Welte K. Involvement of p53 in the cytotoxic activity of the NAMPT inhibitor FK866 in myeloid leukemic cells. Int J Cancer. 2013;132:766–74. doi: 10.1002/ijc.27726. [DOI] [PMC free article] [PubMed] [Google Scholar]
- 19.Okumura S, Sasaki T, Minami Y, Ohsaki Y. Nicotinamide phosphoribosyltransferase: a potent therapeutic target in non-small cell lung cancer with epidermal growth factor receptor-gene mutation. J Thorac Oncol. 2012;7:49–56. doi: 10.1097/JTO.0b013e318233d686. [DOI] [PubMed] [Google Scholar]
- 20.Muruganandham M, Alfieri AA, Matei C, Chen Y, Sukenick G, Schemainda I, Hasmann M, Saltz LB, Koutcher JA. Metabolic signatures associated with a NAD synthesis inhibitor-induced tumor apoptosis identified by 1H-decoupled-31P magnetic resonance spectroscopy. Clin Cancer Res. 2005;11:3503–13. doi: 10.1158/1078-0432.CCR-04-1399. [DOI] [PubMed] [Google Scholar]
- 21.Thakur BK, Dittrich T, Chandra P, Becker A, Lippka Y, Selvakumar D, Klusmann JH, Reinhardt D, Welte K. Inhibition of NAMPT pathway by FK866 activates the function of p53 in HEK293T cells. Biochem Biophys Res Commun. 2012;424:371–7. doi: 10.1016/j.bbrc.2012.06.075. [DOI] [PubMed] [Google Scholar]
- 22.Travelli C, Drago V, Maldi E, Kaludercic N, Galli U, Boldorini R, Di Lisa F, Tron GC, Canonico PL, Genazzani AA. Reciprocal potentiation of the antitumoral activities of FK866, an inhibitor of nicotinamide phosphoribosyltransferase, and etoposide or cisplatin in neuroblastoma cells. J Pharmacol Exp Ther. 2011;338:829–40. doi: 10.1124/jpet.111.184630. [DOI] [PubMed] [Google Scholar]
- 23.Chen SY, Chiu LY, Maa MC, Wang JS, Chien CL, Lin WW. zVAD-induced autophagic cell death requires c-Src-dependent ERK and JNK activation and reactive oxygen species generation. Autophagy. 2011;7:217–28. doi: 10.4161/auto.7.2.14212. [DOI] [PMC free article] [PubMed] [Google Scholar]
- 24.Seo G, Kim SK, Byun YJ, Oh E, Jeong SW, Chae GT, Lee SB. Hydrogen peroxide induces Beclin 1-independent autophagic cell death by suppressing the mTOR pathway via promoting the ubiquitination and degradation of Rheb in GSH-depleted RAW 264.7 cells. Free Radic Res. 2011;45:389–99. doi: 10.3109/10715762.2010.535530. [DOI] [PubMed] [Google Scholar]
- 25.Shimizu S, Konishi A, Nishida Y, Mizuta T, Nishina H, Yamamoto A, Tsujimoto Y. Involvement of JNK in the regulation of autophagic cell death. Oncogene. 2010;29:2070–82. doi: 10.1038/onc.2009.487. [DOI] [PubMed] [Google Scholar]
- 26.Grishchuk Y, Ginet V, Truttmann AC, Clarke PG, Puyal J. Beclin 1-independent autophagy contributes to apoptosis in cortical neurons. Autophagy. 2011;7:1115–31. doi: 10.4161/auto.7.10.16608. [DOI] [PubMed] [Google Scholar]
- 27.Cea M, Cagnetta A, Patrone F, Nencioni A, Gobbi M, Anderson KC. Intracellular NAD(+) depletion induces autophagic death in multiple myeloma cells. Autophagy. 2013;9:410–2. doi: 10.4161/auto.22866. [DOI] [PMC free article] [PubMed] [Google Scholar]
- 28.Holen K, Saltz LB, Hollywood E, Burk K, Hanauske AR. The pharmacokinetics, toxicities, and biologic effects of FK866, a nicotinamide adenine dinucleotide biosynthesis inhibitor. Invest New Drugs. 2008;26:45–51. doi: 10.1007/s10637-007-9083-2. [DOI] [PubMed] [Google Scholar]
- 29.Bjørkøy G, Lamark T, Brech A, Outzen H, Perander M, Overvatn A, Stenmark H, Johansen T. p62/SQSTM1 forms protein aggregates degraded by autophagy and has a protective effect on huntingtin-induced cell death. J Cell Biol. 2005;171:603–14. doi: 10.1083/jcb.200507002. [DOI] [PMC free article] [PubMed] [Google Scholar]
- 30.Pankiv S, Clausen TH, Lamark T, Brech A, Bruun JA, Outzen H, Øvervatn A, Bjørkøy G, Johansen T. p62/SQSTM1 binds directly to Atg8/LC3 to facilitate degradation of ubiquitinated protein aggregates by autophagy. J Biol Chem. 2007;282:24131–45. doi: 10.1074/jbc.M702824200. [DOI] [PubMed] [Google Scholar]
- 31.Ichimura Y, Kumanomidou T, Sou YS, Mizushima T, Ezaki J, Ueno T, Kominami E, Yamane T, Tanaka K, Komatsu M. Structural basis for sorting mechanism of p62 in selective autophagy. J Biol Chem. 2008;283:22847–57. doi: 10.1074/jbc.M802182200. [DOI] [PubMed] [Google Scholar]
- 32.Wang ZB, Liu YQ, Cui YF. Pathways to caspase activation. Cell Biol Int. 2005;29:489–96. doi: 10.1016/j.cellbi.2005.04.001. [DOI] [PubMed] [Google Scholar]
- 33.Creagh EM, Conroy H, Martin SJ. Caspase-activation pathways in apoptosis and immunity. Immunol Rev. 2003;193:10–21. doi: 10.1034/j.1600-065X.2003.00048.x. [DOI] [PubMed] [Google Scholar]
- 34.Cerna D, Li H, Flaherty S, Takebe N, Coleman CN, Yoo SS. Inhibition of nicotinamide phosphoribosyltransferase (NAMPT) activity by small molecule GMX1778 regulates reactive oxygen species (ROS)-mediated cytotoxicity in a p53- and nicotinic acid phosphoribosyltransferase1 (NAPRT1)-dependent manner. J Biol Chem. 2012;287:22408–17. doi: 10.1074/jbc.M112.357301. [DOI] [PMC free article] [PubMed] [Google Scholar]
- 35.Chen Y, Azad MB, Gibson SB. Superoxide is the major reactive oxygen species regulating autophagy. Cell Death Differ. 2009;16:1040–52. doi: 10.1038/cdd.2009.49. [DOI] [PubMed] [Google Scholar]
- 36.Scherz-Shouval R, Shvets E, Fass E, Shorer H, Gil L, Elazar Z. Reactive oxygen species are essential for autophagy and specifically regulate the activity of Atg4. EMBO J. 2007;26:1749–60. doi: 10.1038/sj.emboj.7601623. [DOI] [PMC free article] [PubMed] [Google Scholar]
- 37.Kubota C, Torii S, Hou N, Saito N, Yoshimoto Y, Imai H, Takeuchi T. Constitutive reactive oxygen species generation from autophagosome/lysosome in neuronal oxidative toxicity. J Biol Chem. 2010;285:667–74. doi: 10.1074/jbc.M109.053058. [DOI] [PMC free article] [PubMed] [Google Scholar]
- 38.Yu L, Wan F, Dutta S, Welsh S, Liu Z, Freundt E, Baehrecke EH, Lenardo M. Autophagic programmed cell death by selective catalase degradation. Proc Natl Acad Sci U S A. 2006;103:4952–7. doi: 10.1073/pnas.0511288103. [DOI] [PMC free article] [PubMed] [Google Scholar]
- 39.Puissant A, Robert G, Fenouille N, Luciano F, Cassuto JP, Raynaud S, Auberger P. Resveratrol promotes autophagic cell death in chronic myelogenous leukemia cells via JNK-mediated p62/SQSTM1 expression and AMPK activation. Cancer Res. 2010;70:1042–52. doi: 10.1158/0008-5472.CAN-09-3537. [DOI] [PubMed] [Google Scholar]
- 40.Kuma A, Hatano M, Matsui M, Yamamoto A, Nakaya H, Yoshimori T, Ohsumi Y, Tokuhisa T, Mizushima N. The role of autophagy during the early neonatal starvation period. Nature. 2004;432:1032–6. doi: 10.1038/nature03029. [DOI] [PubMed] [Google Scholar]
- 41.Codogno P, Meijer AJ. Autophagy and signaling: their role in cell survival and cell death. Cell Death Differ. 2005;12(Suppl 2):1509–18. doi: 10.1038/sj.cdd.4401751. [DOI] [PubMed] [Google Scholar]
- 42.Meijer AJ, Codogno P. Regulation and role of autophagy in mammalian cells. Int J Biochem Cell Biol. 2004;36:2445–62. doi: 10.1016/j.biocel.2004.02.002. [DOI] [PubMed] [Google Scholar]
- 43.Gozuacik D, Kimchi A. Autophagy as a cell death and tumor suppressor mechanism. Oncogene. 2004;23:2891–906. doi: 10.1038/sj.onc.1207521. [DOI] [PubMed] [Google Scholar]
- 44.Levine B, Yuan J. Autophagy in cell death: an innocent convict? J Clin Invest. 2005;115:2679–88. doi: 10.1172/JCI26390. [DOI] [PMC free article] [PubMed] [Google Scholar]
- 45.Chen Y, Gibson SB. Is mitochondrial generation of reactive oxygen species a trigger for autophagy? Autophagy. 2008;4:246–8. doi: 10.4161/auto.5432. [DOI] [PubMed] [Google Scholar]
- 46.Perrin V, Régulier E, Abbas-Terki T, Hassig R, Brouillet E, Aebischer P, Luthi-Carter R, Déglon N. Neuroprotection by Hsp104 and Hsp27 in lentiviral-based rat models of Huntington’s disease. Mol Ther. 2007;15:903–11. doi: 10.1038/mt.sj.6300141. [DOI] [PubMed] [Google Scholar]
- 47.Berta T, Poirot O, Pertin M, Ji RR, Kellenberger S, Decosterd I. Transcriptional and functional profiles of voltage-gated Na(+) channels in injured and non-injured DRG neurons in the SNI model of neuropathic pain. Mol Cell Neurosci. 2008;37:196–208. doi: 10.1016/j.mcn.2007.09.007. [DOI] [PubMed] [Google Scholar]
Associated Data
This section collects any data citations, data availability statements, or supplementary materials included in this article.