

Abstract
Skeletal muscle atrophy is thought to result from hyperactivation of intracellular protein degradation pathways, including autophagy and the ubiquitin–proteasome system. However, the precise contributions of these pathways to muscle atrophy are unclear. Here, we show that an autophagy deficiency in denervated slow-twitch soleus muscles delayed skeletal muscle atrophy, reduced mitochondrial activity, and induced oxidative stress and accumulation of PARK2/Parkin, which participates in mitochondrial quality control (PARK2-mediated mitophagy), in mitochondria. Soleus muscles from denervated Park2 knockout mice also showed resistance to denervation, reduced mitochondrial activities, and increased oxidative stress. In both autophagy-deficient and Park2-deficient soleus muscles, denervation caused the accumulation of polyubiquitinated proteins. Denervation induced proteasomal activation via NFE2L1 nuclear translocation in control mice, whereas it had little effect in autophagy-deficient and Park2-deficient mice. These results suggest that PARK2-mediated mitophagy plays an essential role in the activation of proteasomes during denervation atrophy in slow-twitch muscles.
Keywords: PARK2-mediated mitophagy, skeletal muscle atrophy, proteasome, NFE2L1, slow-twitch muscle, autophagy, mitochondria, knockout mouse
Introduction
Skeletal muscles occupy up to 55% of total body mass in mammals, and generate motile forces and heat. They are a major site for carbohydrate and fatty acid metabolism and are categorized into 2 types exhibiting distinct contractile and metabolic properties: slow-twitch, oxidative fatigue-resistant muscles and fast-twitch, glycolytic fatigue-susceptible muscles. The slow-twitch muscle fibers typically display a 2- to 3-fold higher mitochondrial density and substantially lower capacity for nonoxidative ATP synthesis compared with the fast-twitch muscle fibers.
Maintenance of muscle mass depends on a balance between protein synthesis and degradation. Innervation of skeletal muscle fibers by motor neurons is essential for maintenance of muscle size, structure, and function. Numerous disorders, including amyotrophic lateral sclerosis, Guillain-Barre syndrome, polio, and polyneuropathy, disrupt the nerve supply to muscle, causing loss of muscle mass strength and endurance (referred to as neurogenic atrophy).1,2 Other pathological states and systemic disorders, including cancer, diabetes, fasting, sepsis, and disuse, also cause muscle atrophy. The resulting loss of muscle mass in these conditions involves an activation of intracellular protein degradation and a decrease in protein synthesis. The ubiquitin-proteasome system (UPS) and autophagy are the 2 major pathways leading to intracellular degradation, and, when upregulated by the activation of FOXO transcription factors, both systems can contribute to skeletal muscle atrophy.3-6
The UPS is responsible for biologically important cellular processes including cell cycle progression, DNA repair, signaling cascades, cell death, immunity, developmental programs, and protein quality control by catalyzing selective degradation of regulatory proteins and damaged proteins.7,8 Macroautophagy (hereafter referred to as autophagy) is a membrane dynamic process in which cytoplasmic components including macromolecules and organelles are sequestered into double-membrane structures called autophagosomes and delivered to lysosomes for degradation.9,10 Autophagy participates not only in supplying amino acids under nutrient-poor environments, but also in the clearance of misfolded or aggregated proteins, damaged organelles, and pathogens. Currently, the differences between the contributions of the UPS and autophagy to the process of muscle atrophy are not clear.
Results
Autophagy is required for the early steps of denervation atrophy in soleus muscle
To ascertain whether autophagy is activated in atrophying muscles, we subjected GFP-LC3 transgenic mice11 to denervation of the sciatic nerve, a model of skeletal muscle atrophy (Fig. 1A; Fig. S1A). Many GFP-LC3 puncta were observed in both slow-twitch soleus muscles and fast-twitch plantaris muscles of mice at 7 and 14 d after denervation. In the initial stage (within 48 h) of denervation atrophy, autophagy is suppressed by the proteasome-dependent MTORC1 activation.12 However, these results show that autophagy is activated in atrophying hind-limb muscles. As previously reported, autophagy deficiency in skeletal muscle causes more muscle loss owing to denervation than occurs in the control situation with normal autophagy, and autophagy is required to maintain muscle mass.4 However the contribution of autophagy to the process of muscle atrophy is not clear. We generated mice with a skeletal muscle-specific Atg7 (an essential gene for autophagy) knockout under the control of the tamoxifen-inducible human skeletal actin (HSA) promoter (Atg7Flox/Flox: HSA-Cre-ERT2, hereinafter referred to as Atg7 KO mice), and subjected them to denervation. The plantaris muscles, a fast-twitch glycolytic skeletal muscle, from both Atg7 KO and control (Atg7Flox/Flox) mice, were atrophied to almost the same extent by denervation (Fig. S1B). In contrast, the soleus muscle, a slow-twitch oxidative skeletal muscle, from Atg7 KO mice, showed resistance to denervation at 7 d after denervation (Fig. 1B–D; Fig. S2A). However, the soleus muscles from Atg7 KO mice and control mice exhibited comparable muscle mass and myofiber size at 14 d after denervation. Notably, dead myofibers were frequently observed in the Atg7 KO soleus muscles at 14 d (Fig. 1C). The enhanced cell death at 14 d most likely contributes to the shrinking of the soleus muscle of Atg7 KO mice. The phenotypes of soleus muscles of Atg7 KO mice at 14 d after denervation are coincident with the previous study.4 However, the phenotypes at a period earlier than 14 d after denervation were not investigated in that study. Thus, our finding seemed to reflect a more direct effect of autophagy-deficiency on muscle atrophy. These results indicated that autophagy contributes to the early stage of denervation atrophy and that autophagy deficiency delays atrophy in soleus muscle. In contrast, autophagy in fast-twitch muscles seems not to play an important role in the early stage of denervation atrophy, in spite of its activation by denervation in GFP-LC mice.
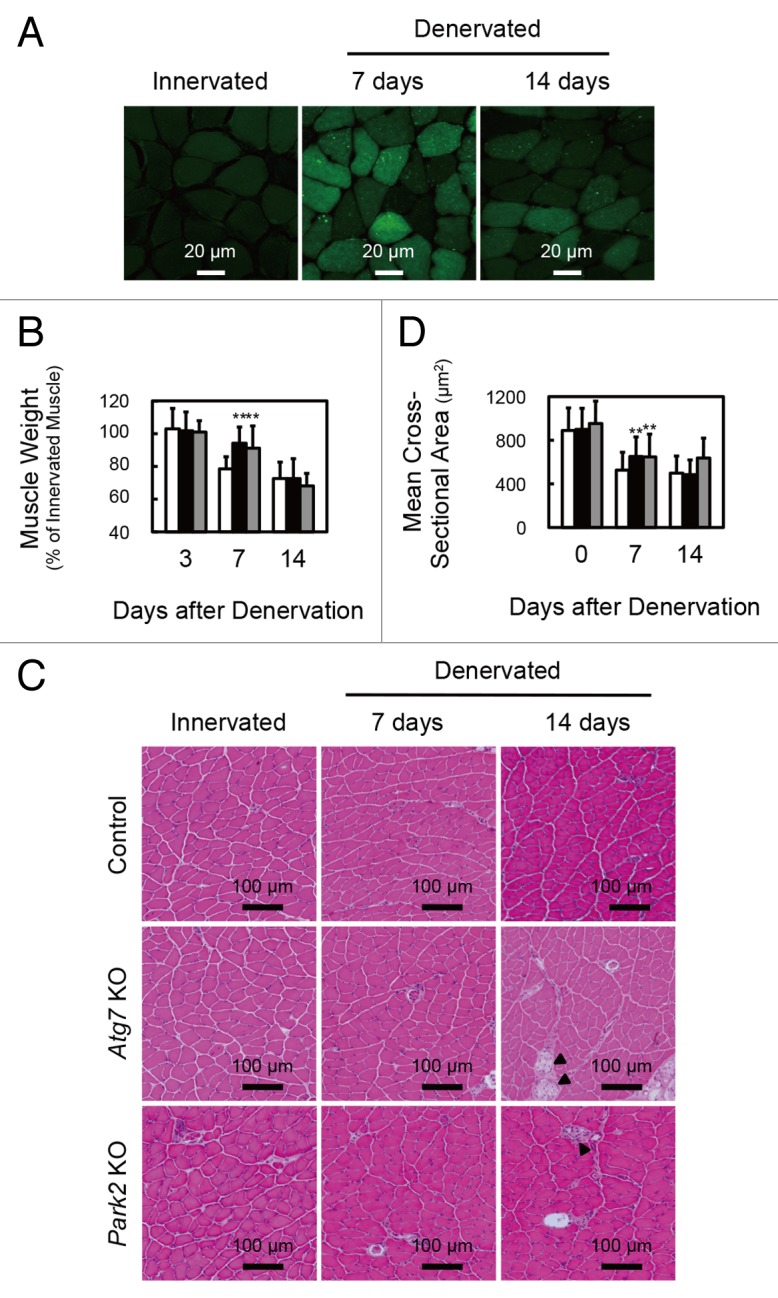
Figure 1. Delay of denervation atrophy in autophagy-deficient and PARK2-deficient soleus muscle. (A) Representative images of soleus muscles from GFP-LC3 transgenic mice at 0 (innervated), 7 and 14 d after denervation. Scale bar: 20 µm. (B) Time course of weight loss in the soleus muscles of denervated mice. For the denervation procedure, the left sciatic nerves of control mice (open bar: day 3, n = 9; day 7, n = 28; day 14, n = 19), Atg7 KO mice (closed bar: day 3, n = 12; day 7, n = 30; day 14, n = 14) or Park2 KO mice (gray bar: day 3, n = 3; day 7, n = 13; day 14, n = 7) were cut in the mid-thigh region, leading to denervation of the lower limb muscles. Denervated muscle weight data are shown as the percentage of the weight of the contralateral innervated muscle from the right limb. Data are shown as the means ± s.d. **P < 0.01 vs control mice at the same time. (C) Histological analysis of control, Atg7 KO and Park2 KO soleus muscles. Cryosections were stained with hematoxylin and eosin. Arrowheads, dead myofibers. Scale bars: 100 µm. (D) Quantification of the cross-sectional areas of myofibers. Values are the means ± s.d. vs control mice at the same time, **P < 0.01.
Denervated soleus muscle from Atg7 KO mice shows mitochondrial dysfunction
To elucidate the precise phenotypes of the soleus muscles of denervated Atg7 KO mice at 7 d after denervation, histological analyses were performed (Fig. 2A). The ratio of type I to type II muscle fibers in both innervated and denervated soleus muscles was almost the same in control and Atg7 KO mice. Meanwhile, denervated soleus muscles from Atg7 KO mice exhibited reduced staining for succinate dehydrogenase (SDH; complex II) and cytochrome c oxidase (Cox; complex IV) compared with denervated soleus muscles from control mice (Fig. 2A and B), indicating that the respiratory chain activities of denervated soleus muscles of Atg7 KO mice were significantly decreased. The reduction of respiratory chain activities was not observed in denervated plantaris muscles from Atg7 KO mice (Fig. S1D). As frequently reported for other autophagy-deficient mice, electron microscopy analysis revealed that abnormally swollen mitochondria were observed in the soleus muscles of denervated Atg7 KO mice (Fig. 2C),13-16 whereas, most of the mitochondria were morphologically normal in the soleus muscles of denervated Atg7 KO mice. As was the case in GFP-LC3 mice, denervation induced formation of autophagic vacuoles (AVs) in the soleus muscles of control mice, whereas AVs were rarely observed in denervated soleus muscles of Atg7 KO mice (Fig. 2C). These results indicated that autophagy deficiency leads to abnormal accumulation of mitochondria in the denervated soleus muscles. However, the expression levels of marker proteins for the outer membrane (e.g., TOMM20/Tom20), the intermembrane space (e.g., CYCS/cytochrome c), the inner membrane (e.g., OPA1), and the matrix (e.g., PDHΑ1/pyruvate dehydrogenase α1;) of mitochondria, and PPARGC1A/PGC1α, a master regulator of mitochondrial biogenesis, in denervated soleus muscles from Atg7 KO mice, were comparable to those in the denervated muscles of control mice (Fig. 2D; Fig. S2B). The expression levels of DNM1L/Drp1 and FIS1/Fis1, which promote the fragmentation of mitochondria (Romanello et al., 2010), were not influenced by denervation. Mitochondrial DNA (mtDNA) copy numbers in denervated Atg7 KO soleus muscles were not different from those in denervated control soleus muscles (Fig. 2E; Fig. S2C). Taken together, these results indicate that the decreased respiratory chain activities of denervated Atg7 KO soleus muscle can be attributed to a qualitative reduction in mitochondrial function, but not to a decreased quantity of mitochondria. It is important to clarify the reason for the reduced mitochondrial function in denervated Atg7 KO soleus muscles. Generally, oxidative stress is inseparably associated with dysregulation or disruption of mitochondrial functions, because mitochondria are both generators and targets of reactive oxygen species (ROS).17 To ascertain whether ROS accumulate in denervated Atg7 KO soleus muscles, we performed immunostaining with an antibody against 8-hydroxydeoxyguanosine (8-OHdG), a marker of ROS (Fig. S3). The denervated Atg7 KO soleus muscles accumulated much more 8-OHdG than did the denervated control or the innervated Atg7 KO soleus muscles. Moreover, the accumulation of carbonylated proteins was greater in denervated Atg KO soleus muscles than in denervated control or innervated Atg7 KO muscles (Fig. 2D). These results suggest that denervated Atg7 KO soleus muscles accumulate damaged mitochondria, which have reduced respiratory chain activities and produce abundant ROS.

Figure 2. Denervation mediates mitochondrial damage in Atg7 KO and Park2 KO soleus muscles. (A) Histological analysis and immunofluorescence analysis of soleus muscles from control, Atg7 KO, and Park2 KO mice 7 d after denervation. Histochemical detection of succinate dehydrogenase (SDH) and cytochrome c oxidase (COX) activities in cryosections of soleus muscles and immunofluorescence images of denervated soleus muscles stained with anti-myosin heavy chain I (MyHC-I, green) and anti-DMD (red) antibodies. Nuclei were visualized with Hoechst 33342 (blue). Scale bars: 100 µm. (B) Quantitative analysis of SDH and COX activities of soleus muscles shown in a. *P < 0.05, **P < 0.01. (C) Electron micrographs of control, Atg7 KO and Park2 KO soleus muscles at 7 d after denervation. Innervated limb and denervated limb are shown. The boxed regions in the middle panels are shown in the next panels on the right. Arrowhead, autophagic vacuole or phagophore membrane; asterisk, abnormal mitochondrion. (D) Western blot analysis of soleus muscles from mice at 7 d after denervation. Whole tissue lysates of the denervated (D) and the contralateral innervated (I) soleus muscles were immunoblotted with antibodies against the indicated proteins. The data shown are representative of at least 3 separate experiments. (E) Changes in mitochondrial DNA (mtDNA) copy numbers caused by denervation of soleus muscles. mtDNA copy numbers were quantified by real-time PCR to detect mtDNA-coded genes. Data are shown as the percentage of the values (mean ± s.d.) obtained from innervated soleus muscles from control mice.
PARK2 is required for denervation atrophy of soleus muscle
The E3 ubiquitin ligase PARK2/Parkin is commonly mutated in autosomal recessive juvenile parkinsonism.18 Upon mitochondrial damage or uncoupling, PARK2 localizes to mitochondria and mediates the ubiquitination of mitochondrial outer membrane proteins and the autophagic elimination of damaged mitochondria (mitophagy), thereby participating in mitochondrial quality control.19,20 Denervation induced PARK2 expression in hind-limb muscles (Fig. 3A and B; Fig. S1C) and the level of PARK2 expression induced by denervation was much higher in soleus muscles than in plantaris muscles. In addition to PARK2 expression, MFN1, a PARK2 substrate, accumulated in denervated soleus muscles from Atg7 KO mice. In contrast, another E3 ubiquitin ligase, MUL1, which is involved in mitophagy during skeletal muscle atrophy,21 was not induced by denervation in soleus and plantaris muscles. Subcellular fractionation experiments revealed that the mitochondrial fraction of the soleus muscles of denervated Atg7 KO mice showed an accumulation of PARK2 (Fig. 3C). Immunofluorescence microscopy of cryosections of soleus muscles revealed colocalization of fragmented mitochondria and PARK2 in perinuclear regions of muscle fibers in denervated Atg7 KO mice (Fig. 3D). These results indicate that damaged mitochondria associated with PARK2 are not eliminated and accumulate in the soleus muscles of denervated Atg7 KO mice because of the deficiency of autophagy, and suggest that the contribution of PARK2 to mitochondrial clearance in denervated slow-twitch soleus muscles is much larger than it is in fast-twitch muscles, probably owing to the abundance of mitochondria. To confirm whether the PARK2-mediated mitophagy is involved in the denervation atrophy in the soleus muscles, we denervated Park2-deficient (Park2 KO) mice.22 Intriguingly, as was the case with Atg7 KO mice, the soleus muscles from Park2 KO mice retained muscle mass 7 d after denervation (Fig. 1). In addition, a reduction in their mitochondrial respiratory chain complex activities and accumulation of ROS were observed 7 d after denervation (Fig. 2A–C; Fig. S3). Together, these results indicate that the PARK2-mediated mitochondrial quality control pathway is required for the early stage of denervation atrophy of soleus muscles. A Drosophila parkin-null mutant shows obvious phenotypes including locomotive defects, muscle degeneration, and mitochondrial swelling in the flight muscles.23-25 Indirect flight muscles, a group of specialized muscles with high mitochondria content, require a high oxygen supply to sustain their respiratory activity for a constant vibration. In mammals, slow-twitch muscles also contain more mitochondria than fast-twitch muscles. Thus, it is possible that mitochondria-rich muscles are more susceptible to the lack of PARK2-mediated mitophagy than other tissues.

Figure 3. PARK2 accumulates in damaged mitochondria in denervated soleus muscles from Atg7 KO mice. (A) Western blot analysis of soleus muscles from mice at 7 d after denervation with antibodies against the indicated proteins. (B) Quantification of Park2 mRNA levels by real-time PCR in soleus muscles. Values are shown as ratios to the mRNA levels in innervated soleus muscles from control mice. The data are means ± s.d. vs. innervated (day 0) muscle from each genotype, **P < 0.01. (C) Western blot analysis of mitochondrial fractions from soleus muscles. Mitochondrial fractions prepared from denervated (D) and innervated (I) soleus muscles of the indicated genotypes at 7 d after denervation and immunoblotted with anti-PARK2 antibody and antibodies against mitochondrial markers. (D) Immunofluorescent micrographs of denervated (7 d) or innervated soleus muscles of the indicated genotypes stained with anti-PARK2 (red) or anti-TOMM20 (mitochondrial marker, green) antibodies and Hoechst 33342 (nucleus, blue). Colocalization of fragmented mitochondria with PARK2 was observed in denervated Atg7 KO soleus muscles. Boxed areas in denervated soleus muscles are shown in the next panels on the right.
PARK2-mediated mitophagy is required for proteasomal activation in denervated soleus muscle
To evaluate the mechanism underlying the delay of soleus muscle atrophy in denervated Atg7 KO and Park2 KO mice, we initially assumed the participation of the GDF8/myostatin signaling pathway and anti-apoptotic BCL2 family members in those phenotypes. However, denervation of wild-type, Atg7 KO, and Park2 KO mice resulted in very similar expression patterns for myostatin, myostatin receptor, and BCL2 family members in soleus muscles, indicating that none of these was related to the mechanism of atrophy (Fig. S2B and S2D). Finally, we noticed the accumulation of polyubiquitinated proteins in the soleus muscles of denervated Atg7 KO and denervated Park2 KO mice (Fig. 4A). In addition, the soleus muscles of denervated Atg7 KO and Park2 KO mice accumulated more polyubiquitinated proteins than did the plantaris muscles of those animals (Fig. S4A). It has been reported that the accumulation of polyubiquitinated proteins is a hallmark of autophagy-deficient tissues,13-16 whereas a similar accumulation has not been reported in Park2-deficient animals. It is also known that the accumulation of unfolded proteins or protein aggregates interferes with proteasome-mediated protein degradation.26,27 Therefore, we suspected that the deficiency of PARK2-mediated mitophagy attenuates the activity of the UPS pathway and results in the delay of soleus muscle atrophy in both Atg7 KO and Park2 KO mice. Because muscle-specific E3 ubiquitin ligases are known to promote protein degradation during skeletal muscle atrophy,28,29 we examined the expression levels of Fbxo32/Mafbx/atrogin-1 and Trim63/Murf1 using real-time quantitative PCR (Fig. 4B). However, the expression levels of Fbxo32 and Trim63 in denervated soleus muscles were comparable in all of the genotypes examined. Next, we measured 26S proteasomal activities in tissue extracts from denervated and innervated soleus muscles. In control mice, denervation induced 26S proteasome activities in extracts from soleus muscles. In contrast, denervation did not induce proteasomal activation in extracts from the soleus muscles of Atg7 KO and Park2 KO mice (Fig. 4C). In addition to proteasomal activities in vitro, we found that denervation increased the levels of the endogenous proteasome substrate TRP53/p53 in the soleus muscles of Atg7 KO and Park2 KO mice compared with those in controls (Fig. 4A). In the plantaris muscles of all genotypes examined, denervation did not induce the accumulation of TRP53 as in the soleus muscles of Atg7 KO and Park2 KO mice (Fig. S4A). These results suggest that, owing to a lack of proteasome activation after denervation in the soleus muscles of Atg7 KO and Park2 KO mice, more TRP53 accumulated, whereas proteasome activation in the soleus muscles of denervated control mice can result in lower levels of TRP53. To ascertain whether the difference in the amount of proteasome activation caused by denervation in control and KO soleus muscles is due to an increase in the number of proteasomes, we examined protein and mRNA levels for proteasome subunits. Western blot analysis revealed that expression of the subunits of 20S proteasomes (components of the α and β rings) was more strongly induced by denervation in the soleus muscles of control mice than it was by denervation in the soleus muscles of Atg7 KO and Park2 KO mice (Fig. 4A and D). The mRNA levels for 20S proteasome subunits in the denervated soleus muscles from control mice were significantly higher than those in the denervated soleus muscles from Atg7 KO and Park2 KO mice (Fig. 4E). These results indicate that the deficiency of PARK2-mediated mitophagy suppresses denervation-induced transcription of 20S proteasome subunit mRNA as well as the de novo synthesis of proteasomes in soleus muscles. Interestingly, denervation induced the expression of proteasome subunits in the plantaris muscle of all genotypes examined (Fig. S4A). Therefore, denervated plantaris muscles of Atg7 KO mice atrophied to almost the same extent seen in denervated plantaris muscles of control mice (Fig. S1A).

Figure 4. PARK2-mediated mitophagy is required for the activation of 26S proteasomes in denervated soleus muscle. (A) Western blot analysis of soleus muscles. Whole-tissue lysates of soleus muscles were immunoblotted with antibodies against the indicated proteins. The data shown are representative of at least 3 separate experiments. (B) Quantification of the mRNA levels for atrophy-related E3 ubiquitin ligases (Fbxo32 and Trim63) in soleus muscles by real-time PCR. Data are shown as the ratios (mean ± s.d.) to the mRNA levels obtained from innervated soleus muscles from control mice. **P < 0.01. (C) Peptide hydrolysis activity of 26S proteasomes. Soleus muscle homogenates from Atg7 KO, Park2 KO, and control mice were used to assay the chymotryptic activity of proteasomes using Suc-LLVY-AMC as a substrate in the absence or presence of 20 µM epoxomicin. Data are shown as the percentage of the activity (mean ± s.d.) obtained from innervated soleus muscles from control mice. **P < 0.01, NS; not significant. (D) Quantitative densitometry of immunoblotting data for the proteasome subunits shown in a. *P < 0.05, **P < 0.01. (E) Quantification of the mRNA levels of proteasome subunits in soleus muscles by real-time PCR. Data are shown as the ratios (mean ± s.d.) to the mRNA levels obtained from innervated soleus muscles from control mice. *P < 0.05, **P < 0.01 vs denervated muscle from control mice. (F) Nuclear levels of NFE2L1 in soleus muscles. Nuclear extracts prepared from denervated and innervated soleus muscles and total tissue lysates were immunoblotted with anti-NFE2L1, anti- NFE2L2, anti-LMNB (as a loading control for nuclear extracts), and GAPDH (as a loading control for tissue lysates) antibodies. The data shown are representative of at least 3 separate experiments.
Accumulation of damaged mitochondria suppresses NFE2L1 transcriptional activity
Nuclear factor erythroid-derived 2-related factors (Nrfs; NFE2L1/Nrf1/TCF11/LCRF1 and NFE2L2/Nrf2), cap’n’collar-type basic leucine zipper (CNC-bZip) protein family members, have been reported to regulate the transcription of proteasome subunits.30-33 Nrfs bind to the antioxidant response element (ARE) in the promoters of its target genes.34 The promoters of all mammalian proteasome subunits contain ARE or ARE-like sequences.32 To ascertain whether there were any differences in the Nrfs levels of the soleus muscles of control and Atg7 or Park2 KO mice, we examined Nrfs levels in tissue lysates and the nuclear extracts of soleus muscles by western blotting analysis (Fig. 4F). Denervation elevated total NFE2L1 levels in the soleus muscles of all genotypes examined, whereas, the NFE2L1 level was high in the nuclear extracts of soleus muscles of denervated control mice, but very low in those of the innervated control and denervated Atg7 or Park2 KO mice. In contrast, little NFE2L2 was detected in total lysate and nuclear extracts from soleus muscles. However, denervation did not influence the NFE2L1 levels in tissue lysates, and decreased nuclear NFE2L1 levels in the plantaris muscles of all genotypes examined (Fig. S4C). Although total NFE2L2 levels in plantaris muscles were comparable to those in soleus muscles, denervation elevated the NFE2L2 level in nuclear extracts of the plantaris muscles of all genotypes examined. These results indicate that 2 different Nrfs, NFE2L1 and NFE2L2, are involved in the denervation-induced expression of proteasome subunits in slow-twitch soleus muscle and fast-twitch plantaris muscle, respectively.
To confirm that the accumulation of damaged (or uncoupled) mitochondria in the soleus muscles of denervated Atg7 KO or Park2 KO mice affects NFE2L1 nuclear translocation, we treated C2C12 cells, a murine myoblast cell line, with the mitochondrial uncoupler carbonyl cyanide m-chlorophenylhydrazone (CCCP) to induce a mimetic condition of damaged mitochondria accumulation, and examined its effect on NFE2L1 transcriptional activity. As previously reported, incubation with several drugs, including proteasome inhibitors (MG-132), tunicamycin and tert-butyl hydroquinone (tBHQ), promotes mRNA expression of proteasome subunits (especially 20S proteasome components)32,33,35,36 (Fig. 5A), and the expression of the 20S proteasome subunits induced by those drugs was suppressed by the addition of CCCP. In addition, siRNA knockdown of Nfe2l1 significantly suppressed MG-132-induced proteasome subunit expression (Fig. 5B) Moreover, MG-132-induced NFE2L1 nuclear translocation was also suppressed by the addition of CCCP in C2C12 and HeLa cells (Fig. 5C and D; Fig. S5C). In addition, the effects of CCCP on MG-132-induced NFE2L1 nuclear translocation and NFE2L1 target-gene expression were blocked by the addition of N-acetyl-cysteine (NAC), an antioxidant. These results indicate that 24 h CCCP treatment induces ROS production from mitochondria in addition to the mitochondrial depolarization. To confirm the effect of ROS on NFE2L1 nuclear translocation, we tested the effects of rotenone, a complex I inhibitor, antimycin, a complex III inhibitor, and H2O2 on nuclear levels of NFE2L1 (Fig. S5A and S5B). As expected, the addition of rotenone, antimycin or H2O2 suppressed the MG-132-induced NFE2L1 nuclear translocation, and the effects of those drugs were invalidated by the addition of NAC. Together, these results indicate that the accumulation of damaged mitochondria producing ROS negatively affects NFE2L1 translocation and the transcription of NFE2L1 target genes.

Figure 5. Effects of mitochondrial depolarization on proteasome subunit expression and NFE2L1 nuclear translocation in C2C12 cells. (A) Quantification of the mRNA levels of proteasome subunits in C2C12 cells incubated with 10 µM MG-132, 1 µg/ml tunicamycin and 50 µM tBHQ in the presence and absence of 10 µM CCCP for 24 h by real-time PCR. Data are shown as the ratios (mean ± s.d.) to the mRNA levels in the vehicle-treated control cells. *P < 0.05, **P < 0.01 (Student t test). (B) Quantification of the mRNA levels of proteasome subunits in siNfe2l1 treated C2C12 cells by real-time PCR. C2C12 cells were transfected with siNfe2l1 or scrambled siRNA, then incubated with 10 µM MG-132 in the presence and absence of 10 µM CCCP for 24 h. *P < 0.05, **P < 0.01, NS; not significant. (C) Western blot analysis of the cell lysates and nuclear extracts of C2C12 cells. Cell lysates and nuclear extracts of C2C12 cells incubated with 10 µM CCCP and/or 10 µM MG-132 in the presence or absence of 10 mM NAC for 24 h were assayed by western blotting using antibodies against the indicated proteins. The data shown are representative of at least 3 separate experiments. (D) Quantitative densitometry of immunoblotting data for the proteasome subunits shown in b. **P < 0.01, NS; not significant.
Discussion
Mitochondria have been postulated to play an important role in triggering signals that contribute to muscle atrophy.37 In this study, we noticed that a similar pattern of mitochondrial dysfunction and soleus muscle atrophy in denervated autophagy-deficient and Park2-deficient mice, and showed the evidence for PARK2-mediated mitophagy playing the important roles in slow-twitch muscle atrophy, which is the first report showing the physiological role of the PARK2-mediated mitophagy in mammalian in vivo model. The accumulation of damaged mitochondria in the PARK2-mediated mitophagy deficient soleus muscle, interferes the expression of proteasome subunits (Fig. S6). The elevation of proteasome expression is the key event in the early stage of slow-twitch muscle atrophy, and that it is regulated by a transcription factor NFE2L1. Under nonstress conditions, NFE2L1 is targeted by its N-terminal putative transmembrane domain to the endoplasmic reticulum (ER) membrane, where it is quickly degraded via ER-associated degradation (ERAD).33,35,38 In response to proteasome inhibition, NFE2L1 translocates from the ER to the nucleus, where it transactivates the transcription of target genes including proteasome subunits. Conversely, NFE2L2, another Nrfs, is constitutively degraded by proteasome because its binding partner KEAP1 (kelch-like ECH-associated protein 1) is a component of the ubiquitin ligase complex in standard conditions.39-42 The oxidative and electrophilic stresses inactivate KEAP1 by the modification of its cysteine residues, and stabilize NFE2L2 to induce the transcription of numerous cytoprotective genes.43-45 In this study, we showed that NFE2L1 nuclear translocation is interfered by oxidative stress, which activates NFE2L2 activity. Therefore, the PARK2-mediated mitochondrial quality control system plays an important role in NFE2L1-dependent slow-twitch muscle atrophy, because of interference in the NFE2L1 system by oxidative stress. Furthermore, fast-twitch plantaris muscles atrophied to the same extent by denervation in the presence and the absence of PARK2-mediated mitophagy, express lower levels of PARK2 and NFE2L1 than slow-twitch muscles during denervation atrophy. Therefore, we speculate that tissues regulated by the NFE2L1 system express more PARK2 to eliminate damaged mitochondria than do other tissues. Our findings highlight the linkage between mitochondria autophagy and the UPS, 2 major intracellular protein degradation systems, and their different roles in slow-twitch skeletal muscle atrophy.
Materials and Methods
Antibodies and reagents
Anti-ATG7 antibodies were described previously.14 Anti-PARK2 (Parkin, 4211), anti-PDHA1 (pyruvate dehydrogenase, 3205), anti-PSMD4 (Rpn10/S5a, 3846), anti-GAPDH (2118), anti-TRP53 (p53, 2524), anti-NFE2L1 (TCF11/Nrf1, 8052), anti-BCL2 (Bcl-2, 2870) and anti-BCL2L1 (Bcl-xL, 2764) antibodies were obtained from Cell Signaling Technology. Anti-PSMA5 (Proteasome 20S α5 subunit, BML-PW8125), anti-PSMB7 (Proteasome 20S β2 subunit, BML-PW9300) and anti-PSMC6 (Proteasome 19S Rpt4 subunit, BML-PW8830) were obtained from Enzo Life Sciences. Anti-OPA1 (612606) and anti-DNM1L (Drp1, 611112) were obtained from BD transduction laboratories. Anti-SQSTM1 (GP62-C) was obtained from Progen. Anti-MYH7(myosin heavy chain I, Clone NOQ7.5.4D, M8421) was obtained from Sigma-Aldrich. Anti-multi ubiquitin (Clone FK2, D058-3) was obtained from MBL. Anti-PPARGC1A (PGC-1, AB3242) was obtained from Millipore. MitoProfile Total OXPHOS Rodent WB Antibody Cocktail (MS604) was obtained from MitoSciences. Anti-TOMM20 (Tom20, sc-11415), anti-CYCS (Cytochrome c, sc-13156), anti-NFE2L1 (Nrf1, H-285, sc-13031, for immunostaining of HeLa cells), anti-NFE2L2 (Nrf2, H-300, sc-13032) and anti-LMNB (Lamin B, sc-6216) were obtained from Santa Cruz Biotechnology. Anti-DMD (Dystrophin, ab15277) and anti-MUL1 (ab84067) were obtained from Abcam. Anti-MFN1 (H00055669-M04) was obtained from Abnova. Anti-FIS1 (10956-1-AP) was obtained from Proteintech. Anti-8-OHdG (MOG-020P) was obtained from the Japan Institute for the Control of Aging, NIKKEN SEIL Co, Ltd. The Protein Carbonyls Western Blot Detection Kit was obtained from SHIMA Laboratories. Alexa 488- and Alexa 594-conjugated secondary antibodies (A11034, A11029, A11037, A11032) were obtained from Molecular Probes. The M.O.M. Immunodetection kit and Texas Red Avidin DCS were obtained from VECTOR Laboratories. Tunicamycin (T7765), tBHQ (112941), CCCP (C-2759), rotenone (R-8875), antimycin (A-8674) and N-acetyl-cysteine (A9165) were obtained from Sigma-Aldrich. MG-132 (474790) was obtained from CALBIOCHEM. Succinyl-Leu-Leu-Val-Tyr-7-amido-4-methylcoumarin (Suc-LLVY-MCA, 3120-v) and epoxomicin (4381-v) were obtained from Peptide Institute, Inc.
Animals
HSA-Cre-ERT2 transgenic mice were a gift from Dr Pierre Chambon. To produce Atg7Flox/Flox: HSA-ERT2-Cre mice, Atg7Flox/Flox mice were bred with HSA-Cre-ERT2 transgenic mice. To delete the floxed Atg7 gene from skeletal muscle, Cre-ERT2 recombinase activity was induced in 4-wk-old mice by i.p. injections of 1 mg tamoxifen for 5 consecutive days. GFP-LC3 transgenic and Park2 knockout mice have been previously described. All mice were maintained in an environmentally controlled room (lights on from 8:00 to 20:00) and were fed a pelleted laboratory diet and tap water ad libitum, unless otherwise stated. Denervation was performed at 4 wk after tamoxifen injections. To standardize autophagic activity in the skeletal muscles, mice were fasted for 24 h before euthanasia. Experimental protocols were approved by the Ethics Review Committee for Animal Experimentation of Juntendo University.
Histological analysis and electron microscopy
Cryosections, 10 µm thick, from mouse hind limbs were stained with hematoxylin and eosin (H&E), stained for succinate dehydrogenase (SDH) or cytochrome c oxidase (COX) activities, or immunolabeled with anti-PARK2, anti-TOMM20, anti-myosin heavy chain I (MYH7), anti-DMD and anti-8-OHdG antibodies. To quantify the SDH or COX activities of soleus muscles, Image J software was used. For EM analysis, soleus muscles were directly fixed with 2% glutaraldehyde in 0.1 M cacodylate buffer on ice. Embedding, sectioning and microphotography were performed by the Hanaichi Electron Microscopic Laboratory, Inc.
Cell culture and siRNA transfection
C2C12 cells and HeLa cells were maintained in DMEM supplemented 10% fetal calf serum and antibiotics. For RNA interference experiments, ON-TARGETplus mouse Nfe2l1 siRNA (Thermo Scientific Dharmacon, L-062252-01-0005) or nontargeting controls (Thermo Scientific Dharmacon, D-001810-01-05) were transfected into C2C12 cells using Lipofectamine RNAiMAX reagent according to the manufacturer's protocols (Invitrogen, 13778075).
Isolation of mitochondrial fractions and nuclear extracts
Mitochondrial fractions of soleus muscles were isolated using the Mitochondria Isolation Kit for Tissue (Pierce, 89801), and nuclear extracts of soleus muscles or C2C12 cells were prepared using NE-PER Nuclear and Cytoplasmic Extraction Reagents (Pierce, 78833) according to the manufacturer’s protocols.
Western blotting
For tissue lysate preparation, mouse skeletal muscles were homogenized in 10 volumes of 50 mM TRIS-HCl (pH 7.4) containing 0.15 M NaCl, 1 mM EDTA, 1% Triton X-100, 0.5% sodium deoxycholate, 0.1% SDS, a protease inhibitor cocktail (Roche Diagnostics, 11836170001), and a phosphatase inhibitor cocktail (Roche Diagnostics, 04906837001), using a motor-driven homogenizer (As One, S-203). For C2C12 cell lysate preparation, cells were lysed with the same buffer. The lysates were centrifuged at 12,000 × g for 10 min at 4 °C to remove debris. The supernatants, mitochondrial fractions, or nuclear extracts were analyzed by western blotting. Densitometric analysis was performed using ImageJ software.
Quantitative real-time PCR analysis
RNA was isolated using TRIzol reagent (Invitrogen, 15596026). cDNA was prepared using the Superscript III first strand synthesis kit (Invitrogen, 18080-044) according to the manufacturer’s protocol. For mtDNA copy number quantification, genomic DNA was prepared. Quantitative real-time PCR was performed using the Fast SYBR Green Master Mix (Applied Biosystems, 4385612). The primers used for gene expression analysis are listed in Table S1 and those used for mtDNA copy number analysis are listed in Table S2.
Measurement of proteasomal activity
Proteasome activities in soleus muscle extracts were measured using a fluorescent substrate, Suc-LLVY-MCA, as described previously.46
Statistics
All data are expressed as means ± s.d. Differences between groups were examined for statistical significance using one-way ANOVA, followed by Tukey-Kramer post hoc test or Student t test. A P value < 0.05 was considered statistically significant.
Supplementary Material
Disclosure of Potential Conflicts of Interest
No potential conflicts of interest were disclosed.
Acknowledgments
We thank Drs Pierre Chambon and Noboru Mizushima for providing the HSA-Cre-ERT2 transgenic and GFP-LC3 transgenic mice, respectively. This work was supported in part by a Grant-in-Aid for Young Scientists (B) (22700656 to NF), a Grant-in-Aid for Scientific Research (C) (24500868 to NF), a Grant-in-Aid for Scientific Research on Priority Areas (18076005 to MK, TU), a Grant-in-Aid for Scientific Research on Innovative Areas (23111003 (NH), a Grant-in-Aid for the “High-Tech Research Center” Project for Private Universities, a matching fund subsidy (SI, NF, TU, and EK) from the Ministry of Education, Culture, Sports, Science and Technology (MEXT) of Japan, the MEXT-Supported Program for the Scientific Research Foundation at Private Universities, 2011–2012 (NF), a Research Grant from the Takeda Science Foundation (TU) and an Intramural Research Grant (23-5) for Neurological and Psychiatric Disorders of NCNP (EA-H).
Glossary
Abbreviations:
- ARE
antioxidant response element
- CCCP
carbonyl cyanide m-chlorophenylhydrazone
- NAC
N-acetyl-cysteine
- NFE2L1
nuclear factor erythroid-derived 2-related factor 1
- NFE2L2
nuclear factor erythroid-derived 2-related factor 2
- ROS
reactive oxygen species
- tBHQ
tert-butyl hydroquinone
References
- 1.Jackman RW, Kandarian SC. The molecular basis of skeletal muscle atrophy. Am J Physiol Cell Physiol. 2004;287:C834–43. doi: 10.1152/ajpcell.00579.2003. [DOI] [PubMed] [Google Scholar]
- 2.Lecker SH, Solomon V, Mitch WE, Goldberg AL. Muscle protein breakdown and the critical role of the ubiquitin-proteasome pathway in normal and disease states. J Nutr. 1999;129(Suppl):227S–37S. doi: 10.1093/jn/129.1.227S. [DOI] [PubMed] [Google Scholar]
- 3.Mammucari C, Milan G, Romanello V, Masiero E, Rudolf R, Del Piccolo P, Burden SJ, Di Lisi R, Sandri C, Zhao J, et al. FoxO3 controls autophagy in skeletal muscle in vivo. Cell Metab. 2007;6:458–71. doi: 10.1016/j.cmet.2007.11.001. [DOI] [PubMed] [Google Scholar]
- 4.Masiero E, Agatea L, Mammucari C, Blaauw B, Loro E, Komatsu M, Metzger D, Reggiani C, Schiaffino S, Sandri M. Autophagy is required to maintain muscle mass. Cell Metab. 2009;10:507–15. doi: 10.1016/j.cmet.2009.10.008. [DOI] [PubMed] [Google Scholar]
- 5.Sandri M, Sandri C, Gilbert A, Skurk C, Calabria E, Picard A, Walsh K, Schiaffino S, Lecker SH, Goldberg AL. Foxo transcription factors induce the atrophy-related ubiquitin ligase atrogin-1 and cause skeletal muscle atrophy. Cell. 2004;117:399–412. doi: 10.1016/S0092-8674(04)00400-3. [DOI] [PMC free article] [PubMed] [Google Scholar]
- 6.Zhao J, Brault JJ, Schild A, Cao P, Sandri M, Schiaffino S, Lecker SH, Goldberg AL. FoxO3 coordinately activates protein degradation by the autophagic/lysosomal and proteasomal pathways in atrophying muscle cells. Cell Metab. 2007;6:472–83. doi: 10.1016/j.cmet.2007.11.004. [DOI] [PubMed] [Google Scholar]
- 7.Ravid T, Hochstrasser M. Diversity of degradation signals in the ubiquitin-proteasome system. Nat Rev Mol Cell Biol. 2008;9:679–90. doi: 10.1038/nrm2468. [DOI] [PMC free article] [PubMed] [Google Scholar]
- 8.Schwartz AL, Ciechanover A. Targeting proteins for destruction by the ubiquitin system: implications for human pathobiology. Annu Rev Pharmacol Toxicol. 2009;49:73–96. doi: 10.1146/annurev.pharmtox.051208.165340. [DOI] [PubMed] [Google Scholar]
- 9.Mizushima N, Levine B. Autophagy in mammalian development and differentiation. Nat Cell Biol. 2010;12:823–30. doi: 10.1038/ncb0910-823. [DOI] [PMC free article] [PubMed] [Google Scholar]
- 10.Yang Z, Klionsky DJ. Eaten alive: a history of macroautophagy. Nat Cell Biol. 2010;12:814–22. doi: 10.1038/ncb0910-814. [DOI] [PMC free article] [PubMed] [Google Scholar]
- 11.Mizushima N, Yamamoto A, Matsui M, Yoshimori T, Ohsumi Y. In vivo analysis of autophagy in response to nutrient starvation using transgenic mice expressing a fluorescent autophagosome marker. Mol Biol Cell. 2004;15:1101–11. doi: 10.1091/mbc.E03-09-0704. [DOI] [PMC free article] [PubMed] [Google Scholar]
- 12.Quy PN, Kuma A, Pierre P, Mizushima N. Proteasome-dependent activation of mammalian target of rapamycin complex 1 (mTORC1) is essential for autophagy suppression and muscle remodeling following denervation. J Biol Chem. 2013;288:1125–34. doi: 10.1074/jbc.M112.399949. [DOI] [PMC free article] [PubMed] [Google Scholar]
- 13.Hara T, Nakamura K, Matsui M, Yamamoto A, Nakahara Y, Suzuki-Migishima R, Yokoyama M, Mishima K, Saito I, Okano H, et al. Suppression of basal autophagy in neural cells causes neurodegenerative disease in mice. Nature. 2006;441:885–9. doi: 10.1038/nature04724. [DOI] [PubMed] [Google Scholar]
- 14.Komatsu M, Waguri S, Chiba T, Murata S, Iwata J, Tanida I, Ueno T, Koike M, Uchiyama Y, Kominami E, et al. Loss of autophagy in the central nervous system causes neurodegeneration in mice. Nature. 2006;441:880–4. doi: 10.1038/nature04723. [DOI] [PubMed] [Google Scholar]
- 15.Komatsu M, Waguri S, Koike M, Sou YS, Ueno T, Hara T, Mizushima N, Iwata J, Ezaki J, Murata S, et al. Homeostatic levels of p62 control cytoplasmic inclusion body formation in autophagy-deficient mice. Cell. 2007;131:1149–63. doi: 10.1016/j.cell.2007.10.035. [DOI] [PubMed] [Google Scholar]
- 16.Komatsu M, Waguri S, Ueno T, Iwata J, Murata S, Tanida I, Ezaki J, Mizushima N, Ohsumi Y, Uchiyama Y, et al. Impairment of starvation-induced and constitutive autophagy in Atg7-deficient mice. J Cell Biol. 2005;169:425–34. doi: 10.1083/jcb.200412022. [DOI] [PMC free article] [PubMed] [Google Scholar]
- 17.Murphy MP. How mitochondria produce reactive oxygen species. Biochem J. 2009;417:1–13. doi: 10.1042/BJ20081386. [DOI] [PMC free article] [PubMed] [Google Scholar]
- 18.Kitada T, Asakawa S, Hattori N, Matsumine H, Yamamura Y, Minoshima S, Yokochi M, Mizuno Y, Shimizu N. Mutations in the parkin gene cause autosomal recessive juvenile parkinsonism. Nature. 1998;392:605–8. doi: 10.1038/33416. [DOI] [PubMed] [Google Scholar]
- 19.Narendra D, Tanaka A, Suen DF, Youle RJ. Parkin is recruited selectively to impaired mitochondria and promotes their autophagy. J Cell Biol. 2008;183:795–803. doi: 10.1083/jcb.200809125. [DOI] [PMC free article] [PubMed] [Google Scholar]
- 20.Yoshii SR, Kishi C, Ishihara N, Mizushima N. Parkin mediates proteasome-dependent protein degradation and rupture of the outer mitochondrial membrane. J Biol Chem. 2011;286:19630–40. doi: 10.1074/jbc.M110.209338. [DOI] [PMC free article] [PubMed] [Google Scholar]
- 21.Lokireddy S, Wijesoma IW, Teng S, Bonala S, Gluckman PD, McFarlane C, Sharma M, Kambadur R. The ubiquitin ligase Mul1 induces mitophagy in skeletal muscle in response to muscle-wasting stimuli. Cell Metab. 2012;16:613–24. doi: 10.1016/j.cmet.2012.10.005. [DOI] [PubMed] [Google Scholar]
- 22.Sato S, Chiba T, Nishiyama S, Kakiuchi T, Tsukada H, Hatano T, Fukuda T, Yasoshima Y, Kai N, Kobayashi K, et al. Decline of striatal dopamine release in parkin-deficient mice shown by ex vivo autoradiography. J Neurosci Res. 2006;84:1350–7. doi: 10.1002/jnr.21032. [DOI] [PubMed] [Google Scholar]
- 23.Cha GH, Kim S, Park J, Lee E, Kim M, Lee SB, Kim JM, Chung J, Cho KS. Parkin negatively regulates JNK pathway in the dopaminergic neurons of Drosophila. Proc Natl Acad Sci U S A. 2005;102:10345–50. doi: 10.1073/pnas.0500346102. [DOI] [PMC free article] [PubMed] [Google Scholar]
- 24.Greene JC, Whitworth AJ, Kuo I, Andrews LA, Feany MB, Pallanck LJ. Mitochondrial pathology and apoptotic muscle degeneration in Drosophila parkin mutants. Proc Natl Acad Sci U S A. 2003;100:4078–83. doi: 10.1073/pnas.0737556100. [DOI] [PMC free article] [PubMed] [Google Scholar]
- 25.Pesah Y, Pham T, Burgess H, Middlebrooks B, Verstreken P, Zhou Y, Harding M, Bellen H, Mardon G. Drosophila parkin mutants have decreased mass and cell size and increased sensitivity to oxygen radical stress. Development. 2004;131:2183–94. doi: 10.1242/dev.01095. [DOI] [PubMed] [Google Scholar]
- 26.Bence NF, Sampat RM, Kopito RR. Impairment of the ubiquitin-proteasome system by protein aggregation. Science. 2001;292:1552–5. doi: 10.1126/science.292.5521.1552. [DOI] [PubMed] [Google Scholar]
- 27.Korolchuk VI, Mansilla A, Menzies FM, Rubinsztein DC. Autophagy inhibition compromises degradation of ubiquitin-proteasome pathway substrates. Mol Cell. 2009;33:517–27. doi: 10.1016/j.molcel.2009.01.021. [DOI] [PMC free article] [PubMed] [Google Scholar]
- 28.Bodine SC, Latres E, Baumhueter S, Lai VK, Nunez L, Clarke BA, Poueymirou WT, Panaro FJ, Na E, Dharmarajan K, et al. Identification of ubiquitin ligases required for skeletal muscle atrophy. Science. 2001;294:1704–8. doi: 10.1126/science.1065874. [DOI] [PubMed] [Google Scholar]
- 29.Gomes MD, Lecker SH, Jagoe RT, Navon A, Goldberg AL. Atrogin-1, a muscle-specific F-box protein highly expressed during muscle atrophy. Proc Natl Acad Sci U S A. 2001;98:14440–5. doi: 10.1073/pnas.251541198. [DOI] [PMC free article] [PubMed] [Google Scholar]
- 30.Arlt A, Bauer I, Schafmayer C, Tepel J, Müerköster SS, Brosch M, Röder C, Kalthoff H, Hampe J, Moyer MP, et al. Increased proteasome subunit protein expression and proteasome activity in colon cancer relate to an enhanced activation of nuclear factor E2-related factor 2 (Nrf2) Oncogene. 2009;28:3983–96. doi: 10.1038/onc.2009.264. [DOI] [PubMed] [Google Scholar]
- 31.Kwak MK, Wakabayashi N, Greenlaw JL, Yamamoto M, Kensler TW. Antioxidants enhance mammalian proteasome expression through the Keap1-Nrf2 signaling pathway. Mol Cell Biol. 2003;23:8786–94. doi: 10.1128/MCB.23.23.8786-8794.2003. [DOI] [PMC free article] [PubMed] [Google Scholar]
- 32.Radhakrishnan SK, Lee CS, Young P, Beskow A, Chan JY, Deshaies RJ. Transcription factor Nrf1 mediates the proteasome recovery pathway after proteasome inhibition in mammalian cells. Mol Cell. 2010;38:17–28. doi: 10.1016/j.molcel.2010.02.029. [DOI] [PMC free article] [PubMed] [Google Scholar]
- 33.Steffen J, Seeger M, Koch A, Krüger E. Proteasomal degradation is transcriptionally controlled by TCF11 via an ERAD-dependent feedback loop. Mol Cell. 2010;40:147–58. doi: 10.1016/j.molcel.2010.09.012. [DOI] [PubMed] [Google Scholar]
- 34.Biswas M, Chan JY. Role of Nrf1 in antioxidant response element-mediated gene expression and beyond. Toxicol Appl Pharmacol. 2010;244:16–20. doi: 10.1016/j.taap.2009.07.034. [DOI] [PMC free article] [PubMed] [Google Scholar]
- 35.Wang W, Chan JY. Nrf1 is targeted to the endoplasmic reticulum membrane by an N-terminal transmembrane domain. Inhibition of nuclear translocation and transacting function. J Biol Chem. 2006;281:19676–87. doi: 10.1074/jbc.M602802200. [DOI] [PubMed] [Google Scholar]
- 36.Zhang Y, Lucocq JM, Hayes JD. The Nrf1 CNC/bZIP protein is a nuclear envelope-bound transcription factor that is activated by t-butyl hydroquinone but not by endoplasmic reticulum stressors. Biochem J. 2009;418:293–310. doi: 10.1042/BJ20081575. [DOI] [PubMed] [Google Scholar]
- 37.Powers SK, Wiggs MP, Duarte JA, Zergeroglu AM, Demirel HA. Mitochondrial signaling contributes to disuse muscle atrophy. Am J Physiol Endocrinol Metab. 2012;303:E31–9. doi: 10.1152/ajpendo.00609.2011. [DOI] [PMC free article] [PubMed] [Google Scholar]
- 38.Zhang Y, Lucocq JM, Yamamoto M, Hayes JD. The NHB1 (N-terminal homology box 1) sequence in transcription factor Nrf1 is required to anchor it to the endoplasmic reticulum and also to enable its asparagine-glycosylation. Biochem J. 2007;408:161–72. doi: 10.1042/BJ20070761. [DOI] [PMC free article] [PubMed] [Google Scholar]
- 39.Cullinan SB, Gordan JD, Jin J, Harper JW, Diehl JA. The Keap1-BTB protein is an adaptor that bridges Nrf2 to a Cul3-based E3 ligase: oxidative stress sensing by a Cul3-Keap1 ligase. Mol Cell Biol. 2004;24:8477–86. doi: 10.1128/MCB.24.19.8477-8486.2004. [DOI] [PMC free article] [PubMed] [Google Scholar]
- 40.Furukawa M, Xiong Y. BTB protein Keap1 targets antioxidant transcription factor Nrf2 for ubiquitination by the Cullin 3-Roc1 ligase. Mol Cell Biol. 2005;25:162–71. doi: 10.1128/MCB.25.1.162-171.2005. [DOI] [PMC free article] [PubMed] [Google Scholar]
- 41.Kobayashi A, Kang MI, Okawa H, Ohtsuji M, Zenke Y, Chiba T, Igarashi K, Yamamoto M. Oxidative stress sensor Keap1 functions as an adaptor for Cul3-based E3 ligase to regulate proteasomal degradation of Nrf2. Mol Cell Biol. 2004;24:7130–9. doi: 10.1128/MCB.24.16.7130-7139.2004. [DOI] [PMC free article] [PubMed] [Google Scholar]
- 42.Zhang DD, Lo SC, Cross JV, Templeton DJ, Hannink M. Keap1 is a redox-regulated substrate adaptor protein for a Cul3-dependent ubiquitin ligase complex. Mol Cell Biol. 2004;24:10941–53. doi: 10.1128/MCB.24.24.10941-10953.2004. [DOI] [PMC free article] [PubMed] [Google Scholar]
- 43.Hayes JD, McMahon M. NRF2 and KEAP1 mutations: permanent activation of an adaptive response in cancer. Trends Biochem Sci. 2009;34:176–88. doi: 10.1016/j.tibs.2008.12.008. [DOI] [PubMed] [Google Scholar]
- 44.Motohashi H, Yamamoto M. Nrf2-Keap1 defines a physiologically important stress response mechanism. Trends Mol Med. 2004;10:549–57. doi: 10.1016/j.molmed.2004.09.003. [DOI] [PubMed] [Google Scholar]
- 45.Villeneuve NF, Lau A, Zhang DD. Regulation of the Nrf2-Keap1 antioxidant response by the ubiquitin proteasome system: an insight into cullin-ring ubiquitin ligases. Antioxid Redox Signal. 2010;13:1699–712. doi: 10.1089/ars.2010.3211. [DOI] [PMC free article] [PubMed] [Google Scholar]
- 46.Tanahashi N, Murakami Y, Minami Y, Shimbara N, Hendil KB, Tanaka K. Hybrid proteasomes. Induction by interferon-gamma and contribution to ATP-dependent proteolysis. J Biol Chem. 2000;275:14336–45. doi: 10.1074/jbc.275.19.14336. [DOI] [PubMed] [Google Scholar]
Associated Data
This section collects any data citations, data availability statements, or supplementary materials included in this article.