Abstract
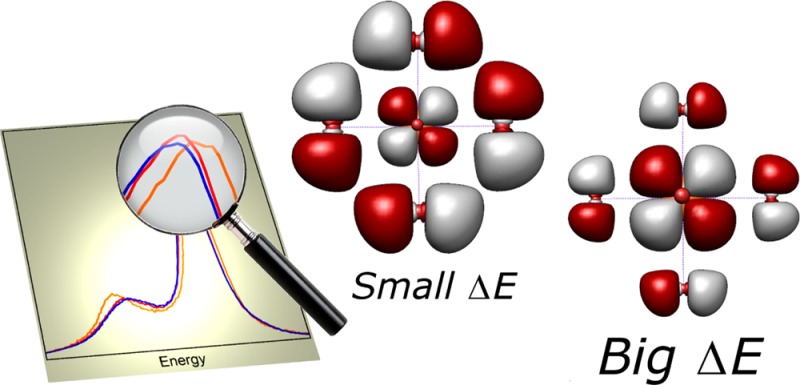
The mainline feature in metal Kβ X-ray emission spectroscopy (XES) has long been recognized as an experimental marker for the spin state of the metal center. However, even within a series of metal compounds with the same nominal oxidation and spin state, significant changes are observed that cannot be explained on the basis of overall spin. In this work, the origin of these effects is explored, both experimentally and theoretically, in order to develop the chemical information content of Kβ mainline XES. Ligand field expressions are derived that describe the behavior of Kβ mainlines for first row transition metals with any dn count, allowing for a detailed analysis of the factors governing mainline shape. Further, due to limitations associated with existing computational approaches, we have developed a new methodology for calculating Kβ mainlines using restricted active space configuration interaction (RAS–CI) calculations. This approach eliminates the need for empirical parameters and provides a powerful tool for investigating the effects that chemical environment exerts on the mainline spectra. On the basis of a detailed analysis of the intermediate and final states involved in these transitions, we confirm the known sensitivity of Kβ mainlines to metal spin state via the 3p–3d exchange coupling. Further, a quantitative relationship between the splitting of the Kβ mainline features and the metal–ligand covalency is established. Thus, this study furthers the quantitative electronic structural information that can be extracted from Kβ mainline spectroscopy.
Introduction
Perhaps one of the most important concepts in inorganic chemistry is the nature of the bonding interactions between a metal center and its ligands.1 The covalency, or charge donation from the ligands to the metal, of these bonds influences the chemistry of transition metal complexes, including their reactivity,2 redox potentials,3,4 and magnetic exchange.5,6 Thus, the ability to quantify the covalent character of metal–ligand bonds is of fundamental importance when attempting to rationalize the properties and reactivity of inorganic complexes.
The influence of bonding on the metal orbitals occurs through two distinct mechanisms. The first is via the direct dilution of the metal d orbitals due to mixing with the ligand orbitals and is termed “symmetry restricted covalency” due to its symmetry-dependent nature. The second, more subtle, mechanism is a distortion of the metal d orbital radial wave functions due to bonding (“central field covalency”).7,8 Accordingly, in a molecular orbital (MO) picture, the impact of symmetry restricted covalency on the ground state of an inorganic complex can be described as a linear combination of metal and ligand orbitals according to eq 1, where (1 – α2) represents the amount of ligand character mixed into the metal d manifold.
| 1 |
Several experimental techniques have been developed to assess the covalency of metal–ligand bonds, including ground state methods such as analysis of hyperfine and superhyperfine couplings obtained from EPR9,10 and excited state techniques like visible absorption11 and X-ray absorption spectroscopies (specifically the metal L-edge12−14 and ligand K-edge15−18). As discussed in the cited references, these methods have provided significant insights into the nature of metal–ligand bonding and have greatly improved our understanding of many inorganic systems.
It should be noted, however, that challenges and limitations exist for all of these methods. The extraction of covalency from EPR requires an EPR active compound with resolvable ligand superhyperfine coupling. Obtaining covalency information from absorption measurements depends on the presence of suitable resolved spectral features and accurate intensities. Additional experimental challenges are presented by the ultrahigh vacuum conditions needed for transition metal L-edges and the K-edges of light atom ligands (C, N, O). Due in part to these limitations, the extraction of reliable covalency values is often quite challenging if not impossible, so additional methods for obtaining this information are valuable.
A developing technique that also holds promise as a probe of metal–ligand bonding is metal Kβ X-ray emission spectroscopy (XES). The XES process begins with ionization of a 1s core electron from the metal using high energy incident X-rays; the photons emitted during the radiative decay of electrons from higher-lying states are then analyzed, allowing XES to probe the occupied states of a metal compound.19,20 In this way, XES provides information that is complementary to that obtained from XAS and that is sensitive to the bonding interactions of a complex. Further, as a hard X-ray technique that probes core orbitals, XES is inherently element selective and applicable to a wide range of sample states and environments.21−23
The first row transition metal Kβ XES spectrum can be divided into two regions: the intense Kβ mainline (composed of the Kβ1,3 and Kβ′ lines) at low energy and the valence-to-core region at higher energies (Figure 1). The valence-to-core transitions have been shown to arise from orbitals of dominantly ligand ns and np character with a small amount of metal np mixing that provides a dipole allowed mechanism for the observed intensity. As such, the valence emission features are sensitive to the identity and electronic structure of the bound ligands.24−27 Furthermore, the valence-to-core region can be effectively modeled using a straightforward frozen-orbital one-electron scheme based on density functional theory (DFT), as previously detailed.25 The coupling of experiment to computations in this manner has enabled valence-to-core XES to become a powerful probe of the environment around a metal center, allowing, for example, the identification of a central carbide in FeMoco,28 the detection of bridging oxos in the Mn4CaO5 cluster of photosystem II,23 and the assessment of the electronic structure of hydrogenase model compounds.29,30
Figure 1.
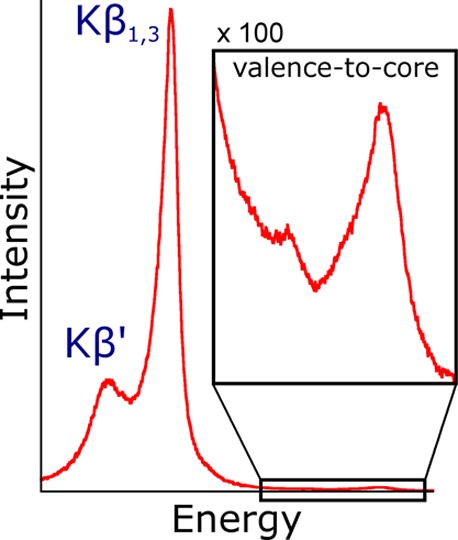
Kβ XES spectrum of Fe2O3 with the spectral features of interest highlighted. The Kβ mainline is composed of the Kβ1,3 and Kβ′ peaks.
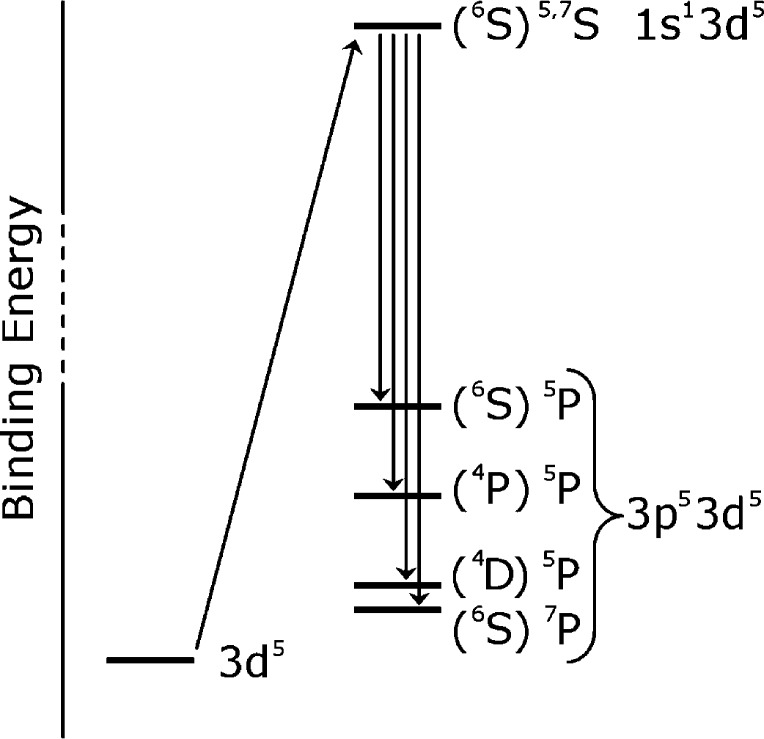
Development of the Kβ mainline, on the other hand, has received relatively less attention in the recent literature, especially with respect to molecular systems. Assigned as metal 3p to 1s transitions, the mainline has long been known to be sensitive to the spin state at the metal center, with dramatic differences observed (e.g., decrease in Kβ′ intensity and decrease in the splitting between the Kβ′ and Kβ1,3) as the nominal spin at the metal is reduced.20,31−34 As intense, dipole-allowed transitions, the mainlines have been used to assess changes in metal spin and oxidation state.21,35,36 These changes can be understood in a multiplet framework and are well established to be largely due to modulations of the exchange integrals between the 3p hole and the valence 3d electrons in the final state;31−33,37 a schematic of the various states involved for a 3d5 metal is provided in Figure 2(38) with extension to other d counts similarly possible. However, to date, the analysis of Kβ mainlines has had limited application beyond their use as simple “fingerprints” for spin state. We note, however, that Cramer and co-workers39 previously invoked covalency to rationalize the reduced Kβ′ intensity seen for rubredoxin as compared to FeCl41– and similar observations were made by Gamblin and Urch34 as well as Glatzel and Bergmann.20 Comparable observations have also been made for solid state systems.40,41 These studies thus provided the first hints that the Kβ mainlines were not simply isolated probes of spin state, although, to our knowledge, the contributions of covalency to the Kβ mainline spectra have never been systematically investigated.
Figure 2.
Pictorial depiction of the transitions giving rise to the Kβ mainlines. In brief, 1s ionization from a totally symmetric 6S ground state (1s23p63d5) gives rise to 7S and 5S intermediate states (1s13p63d5) that are split only by the small 1s–3d exchange and, thus, are nearly degenerate. Enumerating the possible final states in the absence of spin orbit coupling, one 7P and three 5P final states (1s23p53d5) are accessible; the parent 3d5 terms are shown in parentheses. The intensity of the formally allowed transition to the (4P)5P state is calculated to be very small and does not contribute significantly to the spectral shape.
As the splitting between the Kβ mainline features is governed largely by the 3p–3d exchange integrals, they too should be modulated by the metal–ligand covalency. By taking the MO description of covalency expressed in eq 1 together with the knowledge that the exchange integrals between the metal 3p core orbitals and the ligand orbitals are expected to be much smaller than the one center ⟨ϕdϕ3p|ϕdϕ3p⟩ integrals, expressions of the type ⟨ψdψ3p|ψdψ3p⟩ reduce to eq 2, where α2 clearly has a direct influence on the observed splitting (m and n are rational numbers that depend on the actual orbitals involved and G1 and G3 are the Slater exchange integrals between the 3p and 3d electrons)
| 2 |
Herein, we experimentally observe significant differences in the Kβ mainline spectra for a series of nominally high spin, d5 Fe(III) compounds. To explain these effects, we derive analytical expressions for the Kβ mainline splitting for dn systems that define the Kβ1,3 – Kβ′ splitting in terms of the p–d exchange integrals with reductions due to covalency. These expressions nicely describe the observations made between metals of different d counts and demonstrate the necessity of invoking covalency to explain the trends seen between the high spin ferric compounds studied. The ligand field expressions are, however, very general in nature, so we also employ computations to obtain a more quantitative understanding of these spectra.
Crystal field multiplet calculations are well-established as being able to simulate Kβ mainlines, so we begin by reproducing the experimentally observed effects using this methodology and confirm the mainline dependence on the p–d exchange integrals and relative insensitivity to other parameters. These calculations offer the ability to independently tune the spin orbit coupling, ligand field, and the Coulomb and exchange integrals and allow us to deconvolute the effects of each of these parameters. Although the ability to separately tune these parameters is of much utility in isolating individual contributions, the empirical nature of these modifications limits the information that may be extracted. Thus, in order to obtain deeper insights, we have developed a protocol for the calculation of Kβ mainlines using restricted active space configuration interaction (RAS–CI) calculations as implemented in ORCA.42 These calculations are a significant improvement over the multiplet methodology as they explicitly and nonempirically include covalency, spin orbit coupling, and ligand field effects. Despite failing to properly include dynamic correlation, these calculations provide valuable insight into the chemical factors that affect Kβ mainlines and, together with the ligand field expressions, establish a theoretical framework to assess the contributions of symmetry restricted covalency to these spectra. Importantly, for an initial test set of four high spin ferric compounds, the general trends in the calculated spectra reproduce experiment and the observed changes are shown to correlate with the ligand character mixed into the metal d orbitals. This correlation between the Kβ mainline splitting and calculated metal–ligand covalency is then extended to a wider range of experimental data for three additional high spin Fe(III) compounds that were previously reported,25 demonstrating that the splitting between the Kβ1,3 and Kβ′ may be used generally as a quantitative probe of metal–ligand covalency. The covalent modulation of the Kβ mainline splitting is of the same order of magnitude as the changes induced by a ± two-electron modulation of the d count (at the atomic limit); hence, these results also serve as a cautionary note when employing mainlines as isolated “fingerprints” for spin state. The implications of these results for the broader application of Kβ mainlines as a probe of transition metal active site electronic structure are discussed.
Materials and Methods
Sample Preparation
Anhydrous FeF3, FeCl3, and FeBr3 were obtained from Aldrich and used without further purification. (Et4N)[Fe(SAr)4] (Ar = 2,3,5,6-tetramethylphenyl) was prepared by modification of the method outlined in ref (43). Namely, lithium thiolate was prepared by in situ deprotonation of the thiol with a lithium ethoxide solution, the latter obtained by treatment of lithium hexamethyldisilazide with excess ethanol. Due to the air sensitivity or hygroscopic nature of these compounds, all samples were prepared and manipulated under a nitrogen atmosphere in a glovebox. Samples for XES measurements were prepared by grinding to a fine powder, packing into 1 mm aluminum spacers without dilution, and sealing with 38 μm Kapton tape.
XES Data Collection
All XES spectra were collected at SSRL beamline 6–2 (3 GeV, 350 mA) or CHESS C-line (5.3 GeV, 200 mA). For SSRL data, the incident beam energy was set to 8 keV using a Si(111) liquid nitrogen cooled monochromator and was calibrated using a Fe foil. Focusing mirrors were used to achieve a 150 × 200 μm beam at the sample, providing ∼1013 photons/s. If necessary to prevent sample damage or detector saturation, aluminum filters were inserted before the sample to attenuate the incident beam. Energy resolution of the XES spectra was achieved using a crystal array spectrometer employing five spherically bent Ge(620) crystals (100 mm diameter, 1 m radius of curvature) aligned on intersecting Rowland circles, as described previously.25 Samples were maintained at <20 K in an Oxford CFI208 continuous flow liquid helium cryostat and were positioned at 45° with respect to the incident beam. A He filled flight path was used between the sample and spectrometer to reduce signal attenuation and emitted X-rays were detected using an energy resolving Si drift detector with a 3 mm vertical slit. Spectra were collected over the energy range of 7013 to 7123 eV with steps of 0.2 eV (7013–7079 eV) and 0.15 eV (7079–7123 eV).
Collection of data at CHESS was done using a setup very similar to that at SSRL. In brief, the incident beam was set to 9 keV using upstream multilayers (∼90 eV band-pass) and focused to a 1 × 3 mm spot providing ∼1 × 10¹² photons/s. A Rh-coated mirror was used upstream for harmonic rejection. The sample was maintained below 30 K using a displex cryostat and an array of five spherically bent Ge(620) crystals was used for energy selection. A silicon drift detector with a 3 mm vertical slit was used to detect emitted X-rays and data were collected over the range of 7017 to 7121 eV with 0.36 eV steps (7017–7082 eV) and 0.24 eV (7082–7121 eV).
For all spectra, the signal was normalized with respect to the incident flux measured in an upstream ion chamber. The spectrometer energy was calibrated using scans of Fe2O3 and reference energies of 7044.67, 7060.62, 7092.38, and 7107.42 eV. Damage scans were performed on each sample to determine acceptable exposure times per spot. If needed, data were collected from multiple spots on a sample to avoid radiation damage. All scans that showed no evidence of damage were averaged using PyMCA44 and the area under the spectrum from 7017–7120 eV was set to 1000. Averaged mainline spectra were fit using Blueprint XAS version 1.2.45 Reported values are obtained from the positions of the fit components corresponding to the Kβ′ and Kβ1,3 peaks and are the average from at least 18 good fits. In addition to the fits for the FeF3, FeCl3, FeBr3, and (Et4N)[Fe(SAr)4] measured for the present study, fits were also obtained for the previously reported Fe(acac)3, (tpfp)FeCl, and FeCl41– data. Representative fits and tabulated numerical data for all compounds are provided in Figure S1 and Table S2 in the Supporting Information.
Computations
Crystal Field Multiplet Calculations
Crystal field multiplet calculations were carried out using the model implemented by Thole,46 the atomic theory developed by Cowan,47 and the crystal field interactions developed by Butler.48 Spectra were calculated for 3p to 1s emission from Fe3+ d5 ions and were energy shifted by 7055.1 eV to match experimental spectra. Except when specified otherwise, Lorentzian broadenings of 1.60 eV (7058–7100 eV) and 5.10 (7020–7058 eV) as well as a global Gaussian broadening of 1.20 eV were used to simulate lifetime and instrumental broadenings. The areas under the spectra were set to 1000. Sample input files can be found in the Supporting Information.
RAS–CI Calculations
Calculations of mainlines using RAS–CI can be broken down into two steps: an initial DFT calculation to generate quasi-restricted orbitals49 (QROs) followed by the RAS–CI calculation itself. The initial DFT calculations were performed using the BP86 functional,50,51 the zeroth-order regular approximation (ZORA)52 for relativistic effects following the model potential implementation of van Wüllen,53 the scalar-relativistically recontracted def2-TZVP basis set,54 and the conductor-like screening model (COSMO)55 in an infinite dielectric. A special integration accuracy of 7 was used around the metal center. Geometry optimizations were performed using this same level of theory, beginning with crystal structure coordinates.56−59 QROs were visualized using Chimera 1.5.360 and were used to perform orbital coefficient analysis with MOAnalyzer;61 they were also used as an input for the following RAS–CI and, when applicable, CASSCF calculations.
The QROs generated above possess “realistic” covalent mixings and thus serve well as an input into the RAS–CI calculations. These calculations are explained in detail in the Supporting Information, so only a brief description will be presented here. In short, the RAS–CI calculations are performed to calculate the mainline transitions between the photoionized 1s13p63d5 intermediate state and all accessible 1s23p53d5 final states while taking into account the full multiplet structure of this region. This is accomplished by partitioning the orbitals of interest into two “spaces”, one containing the core 1s and 3p orbitals and the other containing the valence 3d orbitals. These orbitals are frozen and then one electron is removed from the core, allowing calculation of all possible septet and quintet states (which are themselves allowed to mix via spin–orbit coupling). Transitions between the desired intermediate states and final states can then be calculated, generating computed mainline spectra. For sample inputs and further explanation, see the Supporting Information.
Results and Analysis
Experimental Kβ Mainline Data
As noted in the Introduction, the sensitivity of Kβ mainlines to the spin state of 3d transition metal centers is well established and has been previously explained theoretically. Less explored are the differences seen within a given spin/oxidation state, though these are generally thought to be small, leading to the common assumption that the Kβ mainline serves as a fingerprint for spin state.25,34,37 However, as shown in Figure 3 for a series of high-spin ferric complexes, even compounds of the same oxidation state and spin state can show large differences in the Kβ mainline spectra. Namely, the energy splitting between the Kβ′ and Kβ1,3 for these compounds varies from 13.6 to 18.2 eV, a difference of nearly 5 eV (Table 1).
Figure 3.
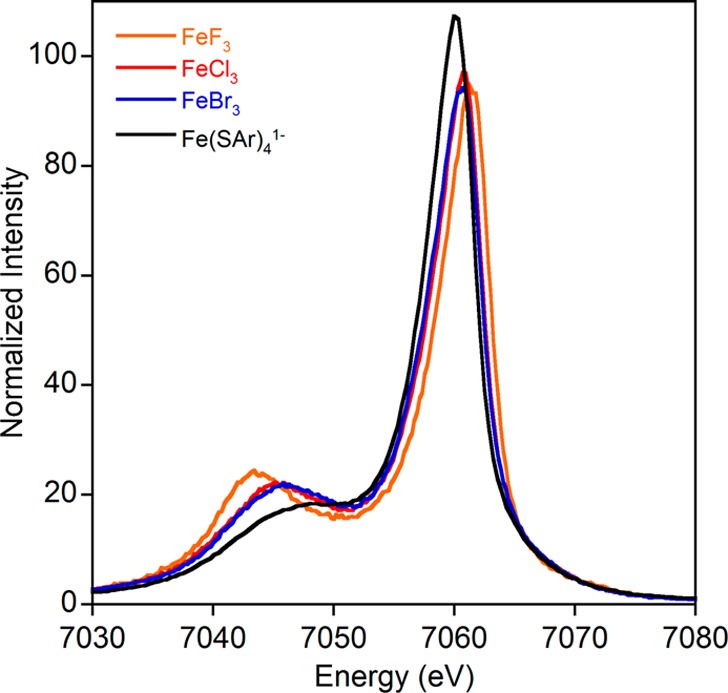
Kβ mainline spectra for a series of ferric compounds that demonstrate significant differences in mainline appearance despite all compounds being high spin Fe(III).
Table 1. Numerical Parameters for High Spin Ferric Mainline Data.
| Kβ1,3 energy (eV) | Kβ′ energy (eV) | ΔE (eV) | |
|---|---|---|---|
| FeF3 | 7061.73 | 7043.56 | 18.17 |
| FeCl3 | 7061.06 | 7045.25 | 15.81 |
| FeBr3 | 7060.97 | 7045.70 | 15.27 |
| Fe(SAr)41– | 7060.60 | 7046.97 | 13.63 |
Ligand Field Expressions
Previous studies and the present analysis (vide infra) have demonstrated that Kβ mainline spectra are relatively insensitive to spin orbit, Coulombic repulsion, and ligand field effects (Supporting Information Figures S2–S4) but instead are dominated by intra-atomic exchange. This thus implies that the splitting between the two dominant Kβ mainline features must primarily correlate with the number of unpaired electrons on the metal which is, in turn, simply a function of the dn configuration. However, the actual splitting requires a detailed inspection of the multiplets that arise in the intermediate and final states. Because this is a nontrivial procedure, we provide a comprehensive collection of the theoretical expressions that correlate the Kβ mainline splitting to the dn configuration (Table 2) and detail the derivation of these equations in the Supporting Information (section 11). In the derivation, it is assumed that in the final state only the exchange couplings between the unpaired 3p electron and the unpaired dn electrons in their electronic ground state contribute to the splitting. This obviously is a strong simplification, which, however, makes it possible to reach some general conclusions. In the equations, covalency is accounted for in terms of the Stevens orbital reduction factors t and e (for the t2g and eg orbitals, respectively); these factors correspond to the quantity α2 in eq 2. With these equations in hand, it is illuminating to plot the values of ΔE in terms of 4G1 + 42G3 (a measure of p–d exchange) for the free ion case of t = e = 1 (Figure 4) to visualize the dependence of ΔE on the 3d count.
Table 2. Analytical Expressions for the Kβ Mainline Splittings for Octahedral 3d Metal Complexesa.
| metal d count | initial state | intermediate state | final state | ΔE/(4G1 + 42G3) |
|---|---|---|---|---|
| 3d0 | 1A1g | 2A1g | 2T1u | 0 |
| 3d1 | 2T2g | 1,3T2g | 1,3(A2,E,T1,T2)u | t2 |
| 3d2 | 3T1g | 2,4T1g | 2,4(A1,E,T1,T2)u | (3/2)t2 |
| 3d3 | 4A2g | 3,5A2g | 3,5T2u | 2t2 |
| 3d4 | h.s. 5Eg | 4,6Eg | 4,6(T1,T2)u | (5/2)(3t2+e2)/4 |
| l.s. 3T1g | 2,4T1g | 2,4(A1,E,T1,T2)u | (3/2)t2 | |
| 3d5 | h.s. 6A1g | 5,7A1g | 5,7T1u | 3(3t2+2e2)/5 |
| l.s. 2T2g | 1,3T2g | 1,3(A2,E,T1,T2)u | t2 | |
| 3d6 | h.s. 5T2g | 4,6T2g | 4,6(T1,T2)u | (5/2)(t2+e2)/2 |
| l.s. 1A1g | 2A1g | 2T1u | 0 | |
| 3d7 | h.s. 4T1g | 3,5T1g | 3,5(A1,E,T1,T2)u | 2(t2+2e2)/3 |
| l.s. 2Eg | 1,3Eg | 1,3(T1,T2)u | e2 | |
| 3d8 | 3A2g | 2,4A2g | 2,4T2u | (3/2) e2 |
| 3d9 | 2Eg | 1,3Eg | 1,3(T1,T2)u | e2 |
| 3d10 | 1A1g | 2A1g | 2T1u | 0 |
For dn configurations where both high and low spin ground states are available they have been indicated with h.s. and l.s., respectively; except for the low spin ground states, these expressions are also valid for tetrahedral complexes after removal of the indices “g” and “u”.
Figure 4.
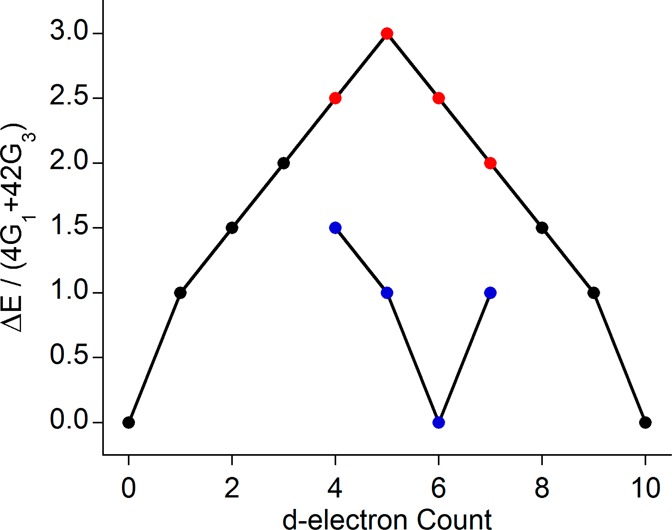
Dependence of the Kβ mainline energy splitting on the number of 3d electrons is shown. When high and low spin ground states are possible, these are indicated with red and blue markers, respectively.
Although Figure 4 nicely rationalizes—in a very general way—many of the observed oxidation and spin state dependencies of metal Kβ mainlines, there are still factors that will influence the “effective” values of 4G1 + 42G3, and thus possibly modulate the shapes of the mainlines, which must be assessed. Namely, these factors include the identity of the metal, its oxidation state, and the interaction of the metal with ligands. For higher metal oxidation states or later transition metals, the radial wave functions will be more contracted leading to higher intrinsic values of 4G1 + 42G3. In addition, the effects of symmetry restricted and central field covalency on the metal must be also considered.7,8
To estimate the magnitude of the contribution that changes in effective oxidation state have on the exchange energy, 4G1 + 42G3, we performed Hartree–Fock and ab initio CI calculations (details below and in the Computations section) of the electronic multiplets and Slater–Condon parameters for transition metal ions in various oxidation states (Figure 5). As expected, these values increase by, at most, ∼10% with increasing oxidation state, reflecting a contraction of the radial wave functions upon oxidation. Notably, this change—even between different formal oxidation states—is less than what is observed experimentally in the series of high spin ferric compounds (∼25% decrease).
Figure 5.
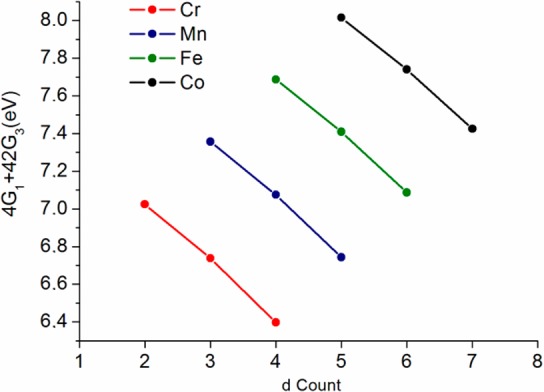
Effect of varying oxidation state (electron count) on the effective exchange energy (4G1 + 42G3) (per spins pair) from Hartree–Fock limit calculations using the computer code by R. D. Cowan49 (see Supporting Information for computational results and list of values of 4G1 + 42G3).
As the oxidation state-dependent modification of the p–d exchange integrals does not appear sufficiently large to account for the changes observed in the high spin ferric mainlines, we were left with, as has been suggested previously, metal–ligand covalency as the operative factor. We thus fully explored the role of covalency from both a crystal field multiplet and RAS–CI perspective and then use the new insights obtained to return to these ligand field expressions at the end. This analysis further develops the information content of Kβ mainlines beyond the common “fingerprint” interpretation.21,33,35−37
A detailed description of our calculations for free atoms and ions is contained in the Supporting Information (section 12), where we also provide a comprehensive summary of dipole selection rules for all multiplets that are involved in the mainline calculations for any dn configuration. Together with the extensive tabular material in section 12 of the Supporting Information, covalency estimates can even be performed without any recourse to ab initio calculations.
Crystal Field Multiplet Calculations
Simulation of Kβ mainlines has traditionally been accomplished with a crystal field multiplet approach that has yielded significant insights into the behavior of mainlines.35,37,38,62 Within such a quasi-atomic approach, various parameters can be modified to effect spectral change: (1) the 10 Dq value parametrizing the ligand field splitting, (2) the Slater–Condon electronic repulsion parameters Fdd2 and Fdd that describe the electronic repulsion within the d shell, (3) the parameters Fpd2 and G1/G3 that describe the 3p/3d Coulomb and exchange integrals respectively, and (4) the ζ3p and ζ3d spin–orbit coupling constants. The influence of many of these parameters has been investigated previously,37 though in order to fully calibrate our new RAS–CI approach, a systematic study of these effects for d5 Fe(III) can be found in the Supporting Information (section 9).
As expected on the basis of the theoretical analysis in Table 2 and exemplified for Fe3+ below, of these parameters, only G1 and G3 have a significant influence on the calculated spectral shapes (Figure 6). Scaling the p–d exchange integrals allows for the entire range of observed splittings to be obtained, confirming previous assignments.33,37 Variation of ζ3p/ζ3d or 10 Dq (consistent with Cramer and co-workers,37Supporting Information Figures S2 and S4) within reasonable limits leads to essentially no discernible changes, whereas modifying Fpd and Fdd over wide ranges has only small impacts on the calculated spectra (Supporting Information Figure S3).
Figure 6.
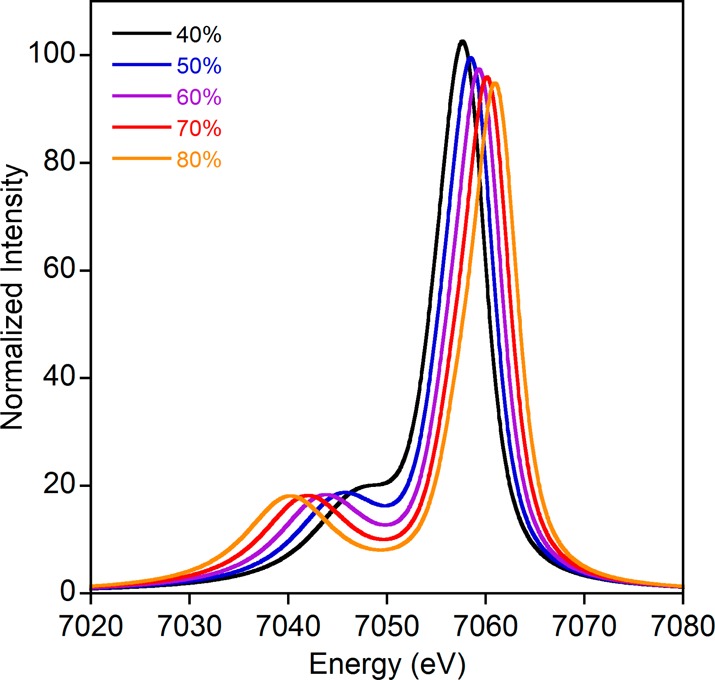
Calculated atomic multiplet spectra on a ferric ion showing the effect of reduced G1 and G3 values.
To demonstrate that the experimental Kβ1,3 – Kβ′ energy splittings could be reproduced with these calculations, the Slater integrals were all scaled by an amount necessary for the calculation to correctly match experiment (Supporting Information Figure S5). A scalar energy shift and broadening were also applied. Importantly, the required reductions in the p–d exchange parameters increase as expected from FeF3 to Fe(SAr)41– (Supporting Information Table S1) and are generally in agreement with the covalency values obtained from DFT calculations (Table 3); by varying the values of the d–d and p–d repulsion parameters we estimate the uncertainty in the Gpd values to be ±5%. We note, however, that equally good simulations of the experimental data could be obtained with different sets of parameters and that the solution space becomes even larger upon consideration of charge transfer and lower symmetry systems. A less empirical methodology to investigate the effect of covalency on the mainline spectra is thus desirable.
Table 3. Breakdown of the t and e Reductions Found by Taking the Sum of the Löwdin d Populations for the QROsa.
| compound | t | e | average |
|---|---|---|---|
| FeF63– | 270.3 (90.1%) | 156.4 (78.2%) | 426.7 (85.3%) |
| FeCl63– | 264.8 (88.3%) | 135.0 (67.5%) | 399.8 (80.0%) |
| FeBr63– | 263.7 (87.9%) | 127.4 (63.7%) | 391.1 (78.2%) |
| Fe(SAr)41– | 183.2 (61.1%) | 161.5 (80.8%) | 344.7 (68.9%) |
Values in parentheses are the average per d orbital.
DFT and RAS–CI Calculations
To further support the assignment that the changes in the Kβ mainlines are due to differences in metal–ligand covalency, DFT calculations were employed. Because DFT generally leads to a fairly realistic description of covalency (with a slight tendency toward overestimation), it is instructive to compare the calculated metal–ligand covalencies obtained from an analysis of the QROs to the experimental energy splittings for the high-spin ferric compounds (Figure 7). Although the covalency for these complexes is anisotropic (e.g., different in each d orbital, Table 3), given the experimental resolution it is appropriate to take the average covalency as a measure of the reduction of the p–d exchange (defined by taking the average of the Löwdin d populations for the metal d based QROs). Figure 7 clearly demonstrates that a correlation exists between the experimentally observed mainline splitting and the calculated average covalencies. Although this correlation is satisfying and certainly captures the essential physics of the problem, it cannot be made any more quantitative because DFT is unable to explicitly calculate the multiplets that account for the Kβ mainlines.
Figure 7.
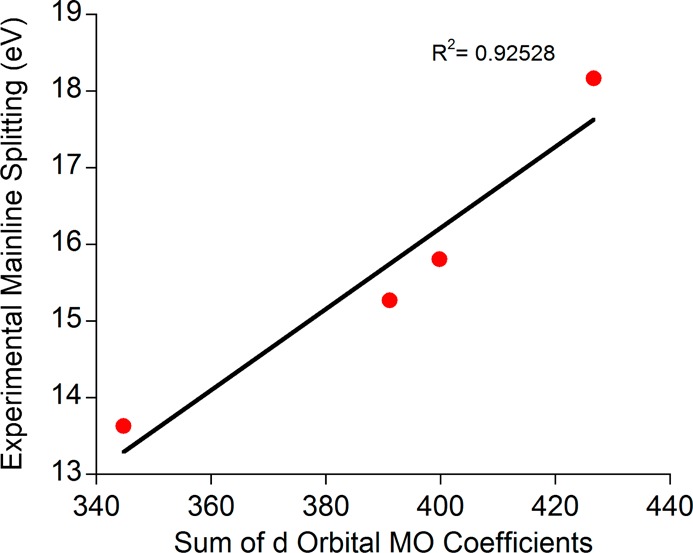
Correlation between the experimentally observed Kβ1,3 – Kβ′ energy splittings and the sums of the QRO coefficients from the metal-based d orbitals.
As explained in the Computations section and in the Supporting Information, it is straightforward to set up a restricted active space configuration interaction protocol in which all intermediate and final states that enter the mainline calculation are explicitly represented. Thus, provided one uses as inputs for these calculations the DFT QRO orbitals that show the correct covalent mixings with the ligand orbitals, one might hope for a near-quantitative reproduction of the experimental spectra.
As shown in Figures 8 and 9 and Table 4, this expectation is partially fulfilled. The calculated Kβ mainline spectral shapes and energy splittings correlate very well with experiment (Figures 8 and 9) and reproduce all of the major trends. Importantly, the magnitude of the change across the series of compounds is in excellent agreement with what is observed experimentally (4.37 eV versus 4.54 eV). Furthermore, the calculated mainline splittings correlate extremely well with the MO coefficients on the d-based orbitals found in Table 3 (Supporting Information Figure S6). There is a systematic error in the absolute transition energies that we attribute to the combined effects of basis set incompleteness, scalar relativistic effects, and missing dynamic correlation. However, as shown by the success of related methods for the calculation of X-ray absorption and emission spectra,25,63,64 this error is not relevant for chemistry as it is highly systematic and can be eliminated through calibration.
Figure 8.
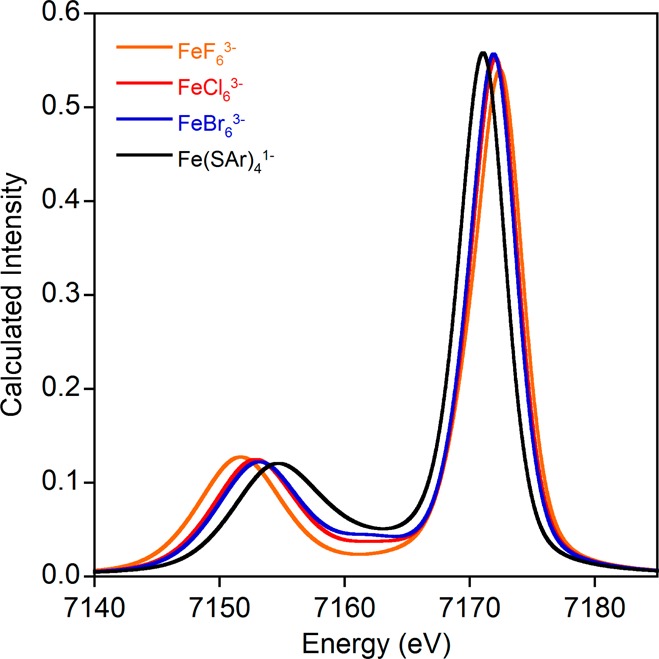
RAS–CI calculated Kβ mainline spectra for the high spin ferric series.
Figure 9.
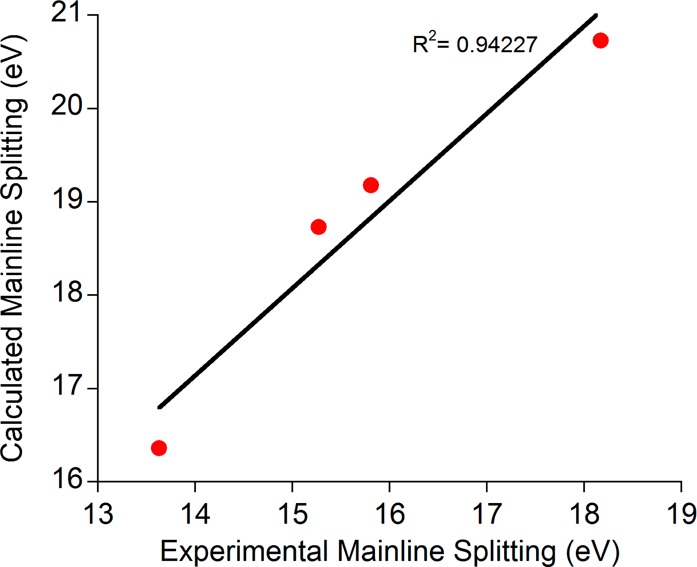
Correlation between the RAS–CI calculated and experimental Kβ mainline splittings.
Table 4. Numerical Data for RAS–CI Calculations on High Spin Ferric Models.
| compound | Kβ1,3 energy (eV) | Kβ′ energy (eV) | split (eV) |
|---|---|---|---|
| FeF63– | 7151.69 | 7172.42 | 20.73 |
| FeCl63– | 7152.89 | 7172.07 | 19.18 |
| FeBr63– | 7153.19 | 7171.92 | 18.73 |
| Fe(SAr)41– | 7154.71 | 7171.07 | 16.36 |
The calculated splittings are significantly larger than the experimentally measured ones, despite the fact that properly covalently “diluted” molecular orbitals have been employed and all integrals have been calculated correctly. Calculations with CASSCF orbitals result in qualitatively similar calculated spectra. The reason for this behavior is simply that equations of the form of eq 2 are grossly oversimplified and, possibly counter widespread belief, calculating the “naked” (unscreened) electron–electron interaction over covalently diluted MOs is simply not enough to obtain accurate results. What is missing are the effects of dynamic correlation which go a long way in providing a “screening” of the electron–electron interaction and thereby account for the much reduced splitting observed experimentally. This could be achieved, for example, by second-order multireference perturbation theory (RASPT2), as in the related work by Odelius et al.65 However, this method is not available to us at the present stage of development. Alternatively, these effects are also highly systematic and hence can be accounted for, with considerable computational advantages, through very modest parametrization as shown by the success of the DFT/CIS and DFT/ROCIS66,67 methods. Efforts along these lines are underway in our research group.
Generalization and Quantification of Observations
With the results of RAS–CI and crystal field multiplet calculations both in agreement that the decreased Kβ′ – Kβ1,3 energy splitting is due to a reduction of the p–d exchange as modulated by metal–ligand covalency, we last turn to quantitatively applying this relationship to other ferric systems. By applying this same methodology to three previously reported high spin Fe(III) compounds,25 we see the obtained relationship is generally applicable (Figure 10); this result is qualitatively the same if experimental intensity-weighted average energies are used instead of fit peak positions (Supporting Information Figure S7). Of course, the covalency numbers obtained from an analysis of orbital coefficients are artificial and will vary depending on the level of theory used for the calculations; hence, calibration to an “accepted” value is necessary to establish a quantitative correlation between the Kβ mainline splitting and covalency. As many possibilities exist for reference values, all of which will give slightly different correlations, we leave this exercise to the reader and simply demonstrate that, according to the measure of covalency employed here, the observed trend is applicable across a broad range of compounds.
Figure 10.
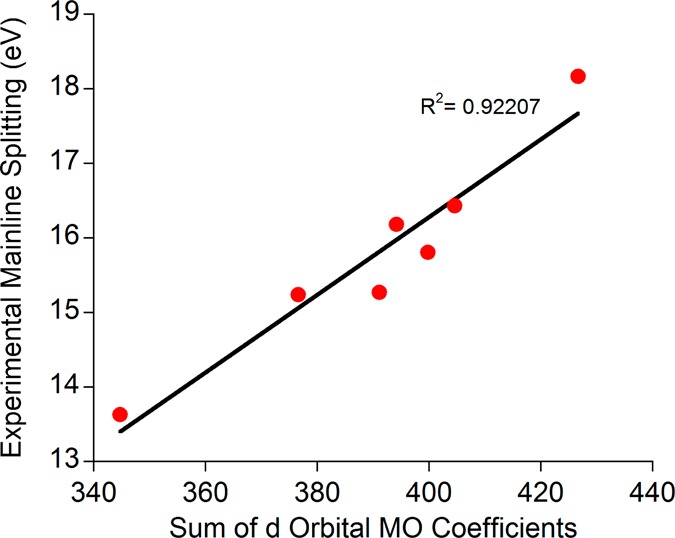
Correlation between experimental Kβ mainline splitting and QRO-derived covalency values for an expanded series of ferric compounds.
Lastly, it is worthwhile to calibrate the size of the effect shown in Figure 10 with the expected changes associated with varying dn count. By using the QRO calculated t and e values (Table 3) in the d5 ligand field expression from Table 2, we can observe the effect of covalency compared directly to that from dn count (Figure 11). The inclusion of this covalent reduction reduces the splitting to what would be expected for a dn–2 ion (for highly covalent complexes) or dn-1 ion (for the highly ionic fluoride). Further, for a d5 electron configuration, this is also complicated by the fact that dn–1 and dn+1 configurations should have identical splitting in the free ion limit. These results indicate that extreme caution must be exercised when attempting to relate an absolute Kβ mainline splitting to a given dn configuration or metal spin state. Correlations of this type will certainly be possible but will only be valid over a very restricted range of possible chemical variations.
Figure 11.
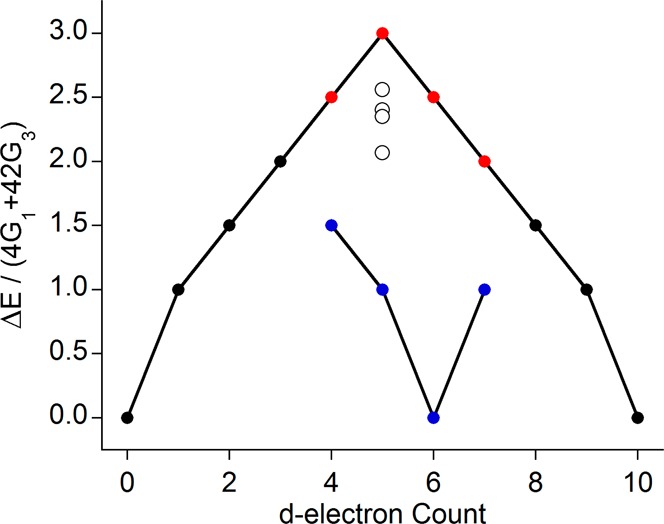
Effect of covalency on the Kβ mainlines is demonstrated alongside the effect of dn count. The four compounds from the high spin ferric series reported here are represented by white circles.
Discussion
General
In this work, we have investigated in detail the multiplets that contribute to the initial, intermediate, and final states of Kβ mainline XES spectra and derived general equations governing the energy splitting between the Kβ1,3 and Kβ′ mainline features for any dn count metal. These equations reinforce previous work20,32−34,37 demonstrating that the splitting of the mainline is primarily due to the 3p-3d exchange integrals (4G1 + 42G3), with high spin states giving rise to relatively intense Kβ′ features and large energy separations between the two peaks. This “free-ion” picture of the mainline shape being governed by the number of unpaired electrons on the metal adequately rationalized early observations and is the level of interpretation that has dominated the literature ever since.
Although this correlation is often true, it breaks down when applied to complexes that are not highly ionic. Indeed, from the data presented here—especially FeBr3 and Fe(SAr)41–, vida supra—and elsewhere (NiBr2,20 rubredoxin,39 nitrogenase MoFe protein68), it is clear that in many cases the mainlines deviate substantially from what would be expected based upon the known nominal metal oxidation and spin states. In these cases, applying the standard interpretation of Kβ mainlines will lead to incorrect conclusions about the metal electronic structure.
From the equations in Table 2, we have demonstrated that the value of ΔE is dominated by the effective value of the quantity 4G1 + 42G3, which depends upon a number of factors, including the metal identity and oxidation state, with higher values found for late metals and higher oxidation states. Further, it is also modified by the Stevens orbital reduction factors that account for symmetry restricted metal–ligand covalency, reducing the predicted mainline splittings from what would be expected for a free ion (Figure 11). Of these factors, only the covalent dilutions are subject to appreciable variation for compounds with a given metal and oxidation state, implicating covalency as the source of the observed modulations of the mainline splittings.
Using the series of high-spin ferric compounds as an example, we have proposed a RAS–CI based protocol for calculating Kβ mainlines, which eliminates much of the empiricism associated with the established crystal field multiplet-based approach. These relatively simple quantum chemical calculations correlate very well with the experimental data and reproduce all important effects. In terms of a very favorable ratio of cost to performance, we chose to take advantage of the fact that density functional theory typically delivers molecular orbitals that have “realistic” metal–ligand mixing ratios (e.g., covalent dilutions) and use these orbitals in the RAS–CI calculations, which properly account for all multiplet and spin–orbit effects. The missing dynamic correlation contributions in these calculations lead to calculated splittings that are overestimated with respect to experiment, though the correlation between theory and experiment is excellent.
Additionally, because the QROs used for these calculations have reasonable covalent dilutions, they were also used to demonstrate that a quantitative relationship between Kβ mainline splitting and covalency may be obtained. Doing so provides an intuitive picture that nicely rationalizes the observed effects in chemically meaningful terms, though it should be kept in mind that orbitals are not physical observables and that one is arguing in terms of static one-electron pictures that become invalid in the case of dominant multiplet effects or strong electronic relaxation.
Furthermore, when approaching such estimates of covalency, it must be clearly understood that they are based on a specific physical model of the electronic structure of a given complex (single determinant MO theory, typically spin-restricted) together with a series of approximations that allow for a relationship of that electronic structure to actual spectroscopic observables (typical assumptions include frozen orbitals, various one-center approximations, and the neglect of metal–ligand overlap). Clearly, many of these assumptions are severe and it should not come as a surprise when estimates obtained by different techniques differ. Importantly, the compositions of individual orbitals do not qualify as physical observables and hence any such procedure is not physically rigorous.8,69,70 It is, however, difficult to deny the usefulness of the underlying intuitively appealing pictures that greatly help to rationalize trends among series of related molecules.
Comparison to Other Experimental Methods for the Determination of Covalency
It is useful at this point to compare the determination of covalency from Kβ mainlines to existing experimental methods (e.g., EPR superhyperfine couplings, metal L-edges, and ligand K-edges). Analysis of superhyperfine couplings in EPR spectra offers a measure of the spin delocalized onto the ligands in the electronic ground state, thus providing a way to quantify the mixing of metal and ligand orbitals. Because the superhyperfine couplings are dependent on the identity of the ligands present, these measurements provide ligand-specific covalency values. Obvious requirements include complexes that are EPR active and ligands with nuclear moments, restricting the range of compounds for which this type of analysis may be performed.
Metal L-edge and ligand K-edge XAS monitor transitions from core orbitals (metal 2p or ligand 1s, respectively) to unoccupied valence orbitals with appreciable metal 3d or ligand np character. Both of these techniques rely upon the measurement of accurate normalized intensities in order to infer covalency.12,69 As the observed intensity is a product of the absorber character in the acceptor MO (i.e., α2) and the radial transition moment dipole integral, these methods rely on the proper factorization of these quantities. Hence, the abstraction of a covalency number from metal or ligand XAS is inherently indirect. It is also important to note that the “intrinsic” transition dipole moments for a given metal or ligand are known to vary significantly with oxidation state, effective charge, and nature of the donor/acceptor interaction, thus introducing significant uncertainties. It should be noted that theoretical approaches can greatly aid in the determination of these values.69−71 However, this requires accurate intensities, which can present a significant experimental challenge and in cases of nearby/overlapping edges becomes prohibitive. Thus, though covalency measured by all of these methods has provided great insights into a number of systems, additional methodologies are clearly desirable.
In contrast, the determination of covalencies from Kβ mainlines relies upon the covalent reduction of the 3p–3d exchange integral as manifested in the energy splitting between the Kβ′ and Kβ1,3 features. In a simple picture this is perhaps similar to the measurement of metal L-edges in that the metal character that is “lost” to the ligands is being probed; hence, Kβ mainlines also provide a measure of the average metal–ligand covalency. In contrast, though, the analysis of Kβ mainlines does not reference oscillator strengths, so the absolute intensities of the XES features are not important and only accurate relative energies are needed. After accounting for all uncertainties in data acquisition and processing, the splitting of the mainline can be determined to within 0.5 eV for a typical high spin complex, which corresponds to a covalency determination to within a few percent using the calibration in Figure 10, a level of precision that compares favorably to existing methods.
In addition to having a reasonable sensitivity to covalency relative to other techniques, Kβ XES also offers numerous experimental benefits. First, it can be applied to any transition metal and is not dependent on the presence of magnetic coupling between the metal and ligands. As a hard X-ray spectroscopy it can readily be applied to a wide range of sample environments—including measurements on dilute solutions72 and in extreme pressure cells21—that may be inaccessible with other techniques. This advantage is particularly clear in comparison to first row transition metal L-edges and ligand K-edges (of C, N, O), which require highly damaging low energy X-rays and UHV conditions that limit in situ applications. These advantages establish Kβ XES as a broadly applicable probe of metal–ligand covalency with promise to shed light onto many systems that would otherwise be experimentally inaccessible.
Lastly, as can clearly be seen in Figure 11, the reduction in mainline splitting due to covalency can be as large as the reduction expected from a change in formal d-count. Thus, any attempt to relate a given mainline splitting to a specific oxidation/spin state must be undertaken with extreme caution. Cases certainly exist where such an analysis is possible—comparisons between metal oxides of differing oxidation states, for example—though these situations are likely the exception rather than the rule. Rather than reduce the utility of Kβ mainlines, however, the theoretical developments contained herein expand the information content that may be extracted from Kβ mainlines and further the ability to quantitatively interpret these data.
Concluding Remarks
In this work, we have demonstrated that the mainlines of metal Kβ XES spectra are a sensitive probe of the covalency of metal complexes in addition to carrying spin-state information. The effect of covalency was established and explored using both crystal field multiplet and straightforward RAS–CI calculations. The RAS–CI approach, in combination with a detailed analysis of the multiplets that contribute to Kβ mainline in general dn configurations, yielded new insights into the chemical factors governing mainlines. It is now possible to obtain an experimental estimate of covalency—analogous to that provided by EPR, metal L-edges, or ligand K-edges—from Kβ mainlines. Finally, these results indicate that caution must be used when attempting to obtain spin state information from Kβ mainlines due to the competing and possibly overwhelming effect that covalency has on mainline shape and energy.
Acknowledgments
We thank Ken Finkelstein for beamline support and helpful discussions. We also thank Dimitrios Liakos for providing the Python script to extract the desired RAS–CI transitions and Prof. Sonny Lee for kindly providing (NEt)4[Fe(SAr)4]. Financial support was provided by the Max-Planck-Gesellschaft (F.N. and S.D.) and the Alfred P. Sloan foundation (S.D.). Portions of this research were carried out at the Stanford Synchrotron Radiation Lightsource (SSRL), a national user facility operated by Stanford University on behalf of the U. S. Department of Energy, Office of Basic Energy Sciences. Data were also collected at the Cornell High Energy Synchrotron Source (CHESS), which is supported by the National Science Foundation and the National Institutes of Health/National Institute of General Medical Sciences under NSF award DMR-0936384.
Supporting Information Available
Input files for crystal field multiplet and RAS–CI calculations, representative mainline fits, crystal field multiplet spectra with varying spin orbit coupling, 10 Dq, Fpd, and Fdd parameters, simulations of experimental data using multiplet calculations, correlation between RAS–CI calculated ΔE and QRO coefficients, and the derivation of the ligand field expressions governing the Kβ splitting. This material is available free of charge via the Internet at http://pubs.acs.org.
Author Present Address
⊥ Department of Chemistry, The Pennsylvania State University, University Park, PA 16802, United States.
The authors declare no competing financial interest.
Funding Statement
National Institutes of Health, United States
Supplementary Material
References
- Solomon E. I.; Hedman B.; Hodgson K. O.; Dey A.; Szilagyi R. K. Coord. Chem. Rev. 2005, 249, 97–129. [Google Scholar]
- Solomon E. I.; Szilagyi R. K.; DeBeer George S.; Basumallick L. Chem. Rev. 2004, 104, 419–458. [DOI] [PubMed] [Google Scholar]
- Fiedler A. T.; Bryngelson P. A.; Maroney M. J.; Brunold T. C. J. Am. Chem. Soc. 2005, 127, 5449–5462. [DOI] [PubMed] [Google Scholar]
- Kennepohl P.; Solomon E. I. Inorg. Chem. 2003, 42, 689–695. [DOI] [PubMed] [Google Scholar]
- Glaser T.; Rose K.; Shadle S. E.; Hedman B.; Hodgson K. O.; Solomon E. I. J. Am. Chem. Soc. 2001, 123, 442–454. [DOI] [PubMed] [Google Scholar]
- Gamelin D. R.; Bominaar E. L.; Kirk M. L.; Wieghardt K.; Solomon E. I. J. Am. Chem. Soc. 1996, 118, 8085–8097. [Google Scholar]
- Jørgensen C. K.Orbitals in Atoms and Molecules; Academic Press: London, 1962; p 59–60. [Google Scholar]
- Neese F.; Solomon E. I.. Interpretation and Calculation of Spin-Hamiltonian Parameters in Transition Metal Complexes. In Magnetism: Molecules to Materials IV; Wiley-VCH Verlag GmbH & Co. KGaA: Weinheim, Germany, 2003; pp 345–466. [Google Scholar]
- Manoharan P. T.; Rogers M. T. J. Chem. Phys. 1968, 49, 5510–5519. [Google Scholar]
- Gewirth A. A.; Cohen S. L.; Schugar H. J.; Solomon E. I. Inorg. Chem. 1987, 26, 1133–1146. [Google Scholar]
- Tuczek F.; Solomon E. I. Coord. Chem. Rev. 2001, 219–221, 1075–1112. [Google Scholar]
- Wasinger E. C.; de Groot F. M. F.; Hedman B.; Hodgson K. O.; Solomon E. I. J. Am. Chem. Soc. 2003, 125, 12894–12906. [DOI] [PubMed] [Google Scholar]
- Hocking R. K.; Wasinger E. C.; de Groot F. M. F.; Hodgson K. O.; Hedman B.; Solomon E. I. J. Am. Chem. Soc. 2006, 128, 10442–10451. [DOI] [PubMed] [Google Scholar]
- Hocking R. K.; DeBeer George S.; Raymond K. N.; Hodgson K. O.; Hedman B.; Solomon E. I. J. Am. Chem. Soc. 2010, 132, 4006–4015. [DOI] [PMC free article] [PubMed] [Google Scholar]
- Grunes L. A.; Leapman R. D.; Wilker C. N.; Hoffmann R.; Kunz A. B. Phys. Rev. B: Condens. Matter Mater. Phys. 1982, 25, 7157–7173. [Google Scholar]
- Sugiura C.; Kitamura M.; Muramatsu S. J. Chem. Phys. 1986, 84, 4824–4827. [Google Scholar]
- Nakai S.; Kawata A.; Ohashi M.; Kitamura M.; Sugiura C.; Mitsuishi T.; Maezawa H. Phys. Rev. B: Condens. Matter Mater. Phys. 1988, 37, 10895–10897. [DOI] [PubMed] [Google Scholar]
- Shadle S. E.; Penner-Hahn J. E.; Schugar H. J.; Hedman B.; Hodgson K. O.; Solomon E. I. J. Am. Chem. Soc. 1993, 115, 767–776. [Google Scholar]
- de Groot F. Chem. Rev. 2001, 101, 1779–1808. [DOI] [PubMed] [Google Scholar]
- Glatzel P.; Bergmann U. Coord. Chem. Rev. 2005, 249, 65–95. [Google Scholar]
- Badro J.; Rueff J.-P.; Vankó G.; Monaco G.; Fiquet G.; Guyot F. Science 2004, 305, 383–386. [DOI] [PubMed] [Google Scholar]
- Vankó G.; Glatzel P.; Pham V.-T.; Abela R.; Grolimund D.; Borca C. N.; Johnson S. L.; Milne C. J.; Bressler C. Angew. Chem., Int. Ed. 2010, 49, 5910–5912. [DOI] [PubMed] [Google Scholar]
- Pushkar Y.; Long X.; Glatzel P.; Brudvig G. W.; Dismukes G. C.; Collins T. J.; Yachandra V. K.; Yano J.; Bergmann U. Angew. Chem., Int. Ed. 2010, 49, 800–803. [DOI] [PMC free article] [PubMed] [Google Scholar]
- Bergmann U.; Horne C. R.; Collins T. J.; Workman J. M.; Cramer S. P. Chem. Phys. Lett. 1999, 302, 119–124. [Google Scholar]
- Lee N.; Petrenko T.; Bergmann U.; Neese F.; DeBeer S. J. Am. Chem. Soc. 2010, 132, 9715–9727. [DOI] [PubMed] [Google Scholar]
- Pollock C. J.; DeBeer S. J. Am. Chem. Soc. 2011, 133, 5594–5601. [DOI] [PubMed] [Google Scholar]
- Lancaster K. M.; Finkelstein K. D.; DeBeer S. Inorg. Chem. 2011, 50, 6767–6774. [DOI] [PubMed] [Google Scholar]
- Lancaster K. M.; Roemelt M.; Ettenhuber P.; Hu Y.; Ribbe M. W.; Neese F.; Bergmann U.; DeBeer S. Science 2011, 334, 974–977. [DOI] [PMC free article] [PubMed] [Google Scholar]
- Leidel N.; Chernev P.; Havelius K. G. V.; Schwartz L.; Ott S.; Haumann M. J. Am. Chem. Soc. 2012, 134, 14142–14157. [DOI] [PubMed] [Google Scholar]
- Leidel N.; Chernev P.; Havelius K. G. V.; Ezzaher S.; Ott S.; Haumann M. Inorg. Chem. 2012, 51, 4546–4559. [DOI] [PubMed] [Google Scholar]
- Tsutsumi K. J. Phys. Soc. Jpn. 1959, 14, 1696–1706. [Google Scholar]
- Tsutsumi K.; Nakamori H. J. Phys. Soc. Jpn. 1968, 25, 1418. [Google Scholar]
- Tsutsumi K.; Nakamori H.; Ichikawa K. Phys. Rev. B 1976, 13, 929–933. [Google Scholar]
- Gamblin S. D.; Urch D. S. J. Electron Spectrosc. Relat. Phenom. 2001, 113, 179–192. [Google Scholar]
- Vankó G.; Neisius T.; Molnár G.; Renz F.; Kárpáti S.; Shukla A.; de Groot F. M. F. J. Phys. Chem. B 2006, 110, 11647–11653. [DOI] [PubMed] [Google Scholar]
- Messinger J.; Robblee J. H.; Bergmann U.; Fernandez C.; Glatzel P.; Visser H.; Cinco R. M.; McFarlane K. L.; Bellacchio E.; Pizarro S. A.; Cramer S. P.; Sauer K.; Klein M. P.; Yachandra V. K. J. Am. Chem. Soc. 2001, 123, 7804–7820. [DOI] [PMC free article] [PubMed] [Google Scholar]
- Peng G.; de Groot F. M. F.; Hamalainen K.; Moore J. A.; Wang X.; Grush M. M.; Hastings J. B.; Siddons D. P.; Armstrong W. H.; Mullins O. C.; Cramer S. P. J. Am. Chem. Soc. 1994, 116, 2914–2920. [Google Scholar]
- Glatzel P.; Bergmann U.; de Groot F. M. F.; Cramer S. P. Phys. Rev. B: Condens. Matter Mater. Phys. 2001, 64, 045109. [Google Scholar]
- Wang X.; Grush M. M.; Froeschner A. G.; Cramer S. P. J. Synchrotron Radiat. 1997, 4, 236–242. [DOI] [PubMed] [Google Scholar]
- Devillers T.; Rovezzi M.; Szwacki N. G.; Dobkowska S.; Stefanowicz W.; Sztenkiel D.; Grois A.; Suffczyński J.; Navarro-Quezada A.; Faina B.; Li T.; Glatzel P.; d’Acapito F.; Jakieła R.; Sawicki M.; Majewski J. A.; Dietl T.; Bonanni A. Sci. Rep. 2012, 2, 722. [DOI] [PMC free article] [PubMed] [Google Scholar]
- Rueff J.-P.; Shukla A. Rev. Mod. Phys. 2010, 82, 847–896. [Google Scholar]
- Neese F. Wiley Interdisciplinary Reviews: Computational Molecular Science 2012, 2, 73–78. [DOI] [PMC free article] [PubMed] [Google Scholar]
- Gebhard M. S.; Deaton J. C.; Koch S. A.; Millar M.; Solomon E. I. J. Am. Chem. Soc. 1990, 112, 2217–2231. [DOI] [PubMed] [Google Scholar]
- Sole V. A.; Papillon E.; Cotte M.; Walter P.; Susini J. Spectrochim. Acta, Part B 2007, 62, 63–68. [Google Scholar]
- Delgado-Jaime M. U.; Mewis C. P.; Kennepohl P. J. Synchrotron Radiat. 2010, 17, 132–137. [DOI] [PubMed] [Google Scholar]
- Thole B. T.; Vanderlaan G.; Fuggle J. C.; Sawatzky G. A.; Karnatak R. C.; Esteva J. M. Phys. Rev. B: Condens. Matter Mater. Phys. 1985, 32, 5107–5118. [DOI] [PubMed] [Google Scholar]
- Cowan R. D.The Theory of Atomic Structure and Spectra; University of California Press: Berkeley, 1981. [Google Scholar]
- Butler P. H.Point Group Symmetry Applications: Methods and Tables; Plenum Press: New York, 1981. [Google Scholar]
- Neese F. J. Am. Chem. Soc. 2006, 128, 10213–10222. [DOI] [PubMed] [Google Scholar]
- Becke A. D. Phys. Rev. A: At., Mol., Opt. Phys. 1988, 38, 3098. [DOI] [PubMed] [Google Scholar]
- Perdew J. P. Phys. Rev. B: Condens. Matter Mater. Phys. 1986, 33, 8822. [DOI] [PubMed] [Google Scholar]
- van Lenthe E.; van der Avoird A.; Wormer P. E. S. J. Chem. Phys. 1998, 108, 478. [Google Scholar]
- van Wüllen C. J. Chem. Phys. 1998, 109, 392. [Google Scholar]
- Pantazis D. A.; Chen X. Y.; Landis C. R.; Neese F. J. Chem. Theory Comput 2008, 4, 908–919. [DOI] [PubMed] [Google Scholar]
- Klamt A.; Schüürmann G. J. Chem. Soc. Perkin. Trans. 1993, 2, 799–805. [Google Scholar]
- Leblanc M.; Pannetier J.; Ferey G.; Depape R. Revue De Chimie Minerale 1985, 22, 107–114. [Google Scholar]
- Hashimoto S.; Forster K.; Moss S. C. J. Appl. Crystallogr. 1989, 22, 173–180. [Google Scholar]
- Armbruster M.; Ludwig T.; Rotter H. W.; Thiele G.; Oppermann H. Z. Anorg. Allg. Chem. 2000, 626, 187–195. [Google Scholar]
- Millar M.; Lee J. F.; O’Sullivan T.; Koch S. A.; Fikar R. Inorg. Chim. Acta 1996, 243, 333–343. [Google Scholar]
- Pettersen E. F.; Goddard T. D.; Huang C. C.; Couch G. S.; Greenblatt D. M.; Meng E. C.; Ferrin T. E. J. Comput. Chem. 2004, 13, 1605–1612. [DOI] [PubMed] [Google Scholar]
- Delgado-Jaime M. U.; DeBeer S. J. Comput. Chem. 2012, 33, 2180–2185. [DOI] [PubMed] [Google Scholar]
- de Groot F. M. F.; Fontaine A.; Kao C. C.; Krisch M. J. Phys.: Condens. Matter 1994, 6, 6875. [Google Scholar]
- DeBeer George S.; Petrenko T.; Neese F. J. Phys. Chem. A 2008, 112, 12936–12943. [DOI] [PubMed] [Google Scholar]
- DeBeer George S.; Petrenko T.; Neese F. Inorg. Chim. Acta 2008, 361, 965–972. [Google Scholar]
- Josefsson I.; Kunnus K.; Schreck S.; Föhlisch A.; de Groot F.; Wernet P.; Odelius M. J. Phys. Chem. Lett. 2012, 3, 3565–3570. [DOI] [PubMed] [Google Scholar]
- Maganas D.; Roemelt M.; Havecker M.; Trunschke A.; Knop-Gericke A.; Schlogl R.; Neese F. Phys. Chem. Chem. Phys. 2013, 15, 7260–7276. [DOI] [PubMed] [Google Scholar]
- Roemelt M.; Maganas D.; DeBeer S.; Neese F. J. Chem. Phys. 2013, 138, 204101. [DOI] [PubMed] [Google Scholar]
- Lancaster K. M.; Hu Y.; Bergmann U.; Ribbe M. W.; DeBeer S. J. Am. Chem. Soc. 2013, 135, 610–612. [DOI] [PMC free article] [PubMed] [Google Scholar]
- Neese F.; Hedman B.; Hodgson K. O.; Solomon E. I. Inorg. Chem. 1999, 38, 4854–4860. [DOI] [PubMed] [Google Scholar]
- Ray K.; DeBeer George S.; Solomon E. I.; Wieghardt K.; Neese F. Chem.—Eur. J. 2007, 13, 2783–2797. [DOI] [PubMed] [Google Scholar]
- Beckwith M. A.; Roemelt M.; Collomb M.-N. l.; DuBoc C.; Weng T.-C.; Bergmann U.; Glatzel P.; Neese F.; DeBeer S. Inorg. Chem. 2011, 50, 8397–8409. [DOI] [PubMed] [Google Scholar]
- Kern J.; Alonso-Mori R.; Tran R.; Hattne J.; Gildea R. J.; Echols N.; Glöckner C.; Hellmich J.; Laksmono H.; Sierra R. G.; Lassalle-Kaiser B.; Koroidov S.; Lampe A.; Han G.; Gul S.; DiFiore D.; Milathianaki D.; Fry A. R.; Miahnahri A.; Schafer D. W.; Messerschmidt M.; Seibert M. M.; Koglin J. E.; Sokaras D.; Weng T.-C.; Sellberg J.; Latimer M. J.; Grosse-Kunstleve R. W.; Zwart P. H.; White W. E.; Glatzel P.; Adams P. D.; Bogan M. J.; Williams G. J.; Boutet S.; Messinger J.; Zouni A.; Sauter N. K.; Yachandra V. K.; Bergmann U.; Yano J. Science 2013, 340, 491–495. [DOI] [PMC free article] [PubMed] [Google Scholar]
Associated Data
This section collects any data citations, data availability statements, or supplementary materials included in this article.


