Abstract
Phenotypic differences between males and females of sexually dimorphic species are caused in large part by differences in gene expression between the sexes, most of which occurs in the gonads. To accurately identify genes differentially expressed between males and females in Drosophila, we sequenced the testis and ovary transcriptomes of D. yakuba, D. pseudoobscura, and D. ananassae and used them to identify sex-biased genes in the latter two species. We highlight the increased sensitivity and improved power of sex-biased gene detection methods when using our testis/ovary data versus male and female whole body transcriptome data. We thus provide a resource specifically designed to accurately identify and characterize sex-biased genes across Drosophila. This dataset is available through NCBI GEO accession GSE52058.
Keywords: RNA-seq, testis, ovary, Drosophila pseudoobscura, Drosophila ananassae, Drosophila yakuba
INTRODUCTION
Differences in gene expression account for the majority of phenotypic differences between males and females of sexually dimorphic species 1. Thus, accurate identification of genes differentially expressed between males and females, i.e. sex-biased genes, is crucial for understanding the current state and evolution of the genomic architecture and mechanisms producing sexual dimorphism. The majority of sex-biased expression detected with microarrays in Drosophila occurs in gonads (e.g. 2), suggesting that accurate identification of sex-biased genes should be based on gene expression measurements in these sex-specific organs. To take advantage of the increased sensitivity of whole-transcriptome sequencing (RNA-seq), to avoid the limitations of whole body (WB) samples for detecting sex-biased gene expression, and to better understand sex-biased gene evolution in Drosophila, we sequenced testis and ovary mRNAs from D. pseudoobscura, D. ananassae, and D. yakuba.
METHODS
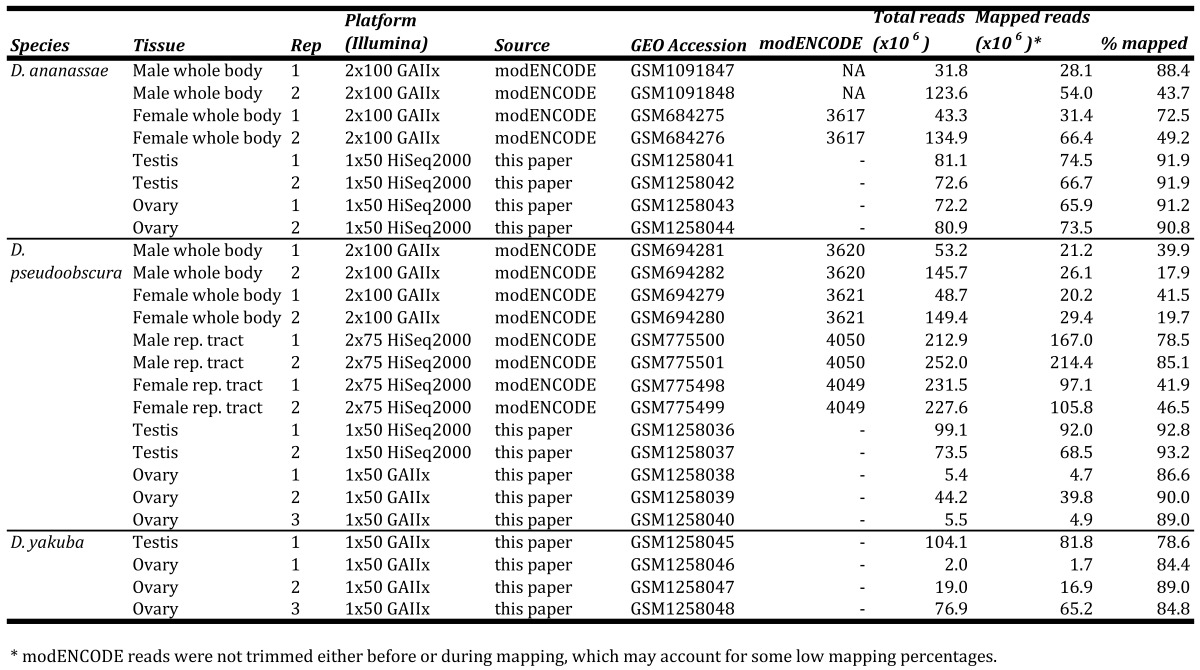
Flies were grown on cornmeal-molasses agar at 20oC (D. pseudoobscura 14011-0121.94) or 25oC (D. ananassae 14024-0371.13 and D. yakuba CSN). Virgin flies were collected and aged 6-10 days before dissecting 2-3 replicates of testes or ovaries. Total RNA was extracted from testis and ovary samples using the Arcturus® PicoPure® kit. Illumina® TruSeq® RNA kits were then used to poly-A+ select mRNA, reverse-transcribe mRNA using random priming, shear cDNA into 120-200 bp fragments, and produce libraries for 1x50 bp sequencing on an Illumina GAIIx or HiSeq2000 (Table S1). Illumina's Real Time Analysis v1.13 module processed raw images, called bases, and provided base qualities. We downloaded D. pseudoobscura r3.1 and D. ananassae r1.3 reference genomes and annotations from FlyBase (http://flybase.org), and modENCODE WB and reproductive tract RNA-seq data 3 from NCBI (Table S1). All reads were mapped to the appropriate reference genomes using Bowtie v2.1.0 with default parameters 4. Other D. pseudoobscura datasets 5 and our D. yakuba samples currently consist of one replicate and are likely unsuitable for sex-biased gene identification.
Table S1.
GEO, SRA, and modENCODE accessions and mapping statistics of datasets used in this study.

We identified sex-biased genes in WB, reproductive tract, or testis/ovary samples using Cuffdiff v2.1.0 with default options, which include pooled sample dispersion estimates and geometric normalization of gene-level counts 6, and edgeR v3.4.0 7. We generated gene-level count data for edgeR with HTSeq v0.5.4p3 using uniquely-mapped reads and the intersection-nonempty method to assign reads to genes 8. Counts were full-quantile normalized within samples by GC-content and between samples using the EDASeq R package 9. In both Cuffdiff and edgeR analyses genes were called sex-biased if the Benjamini-Hochberg 10 false discovery rate was < 0.01.
RESULTS
Cuffdiff and edgeR results are shown in Table 1. In general, Cuffdiff resulted in greater overlap than edgeR of the sex-biased genes found in both WB and testis/ovary analyses (Pearson's χ2, p < 1e-04), while edgeR was more sensitive. There are two key points to Table 1. First, testis/ovary analyses detect more (D. ananassae: 3.3 - 5.0-fold; D. pseudoobscura: 1 - 1.4-fold) sex-biased genes than WB analyses (Pearson's χ2, all p<1e-04). Second, testis/ovary analyses significantly improve our power to detect the smallest class of sex-biased genes found in WB analyses. For example, 5.5-25.3-fold more female-biased genes are found in D. ananassae testis/ovary analyses than WB analyses (Pearson's χ2, p<1e-04; Table 1).
Table 1.
Differential expression analyses of whole body and sex-specific organs in Drosophila pseudoobscura and D. ananassae.
| Comparison | Cuffdiff | edgeR | ||||||
|---|---|---|---|---|---|---|---|---|
| Total DEa | MBa | FBa | Total Tested | Total DEa | MBa | FBa | Total Tested | |
| D. pseudoobscurab | ||||||||
| whole body | 5269 | 2785 | 2484 | 13252 | 8284 | 3043 | 5242 | 12738 |
| testis-ovary | 7105 | 3184 | 3921 | 12575 | 8045 | 3292 | 4752 | 11946 |
| reproductive tract | 9067 | 4669 | 4398 | 11800 | 9228 | 3512 | 5716 | 11809 |
| Overlap (%)c | 4477 (85.0) |
2334 (83.8) |
2143 (86.3) |
11620 (92.4) |
5875 (73.0) |
2540 (83.5) |
3335 (70.2) |
11345 (95.0) |
| D. ananassaed | ||||||||
| whole body | 1791 | 1613 | 178 | 13786 | 3224 | 2138 | 1086 | 13081 |
| testis-ovary | 8997 | 4494 | 4503 | 13269 | 9429 | 3456 | 5973 | 11576 |
| Overlap (%)c | 1657 (92.5) |
1503 (93.2) |
154 (86.5) |
12538 (94.5) |
2593 (80.4) |
1835 (85.8) |
758 (69.8) |
11213 (96.9) |
a DE: differentially expressed at false discovery rate <0.01; MB: male-biased; FB: female-biased
b Annotated genes: 16,755
c Numbers and percentages (of smallest value) of genes overlapping between whole body and testis-ovary analyses
d Annotated genes: 16,225
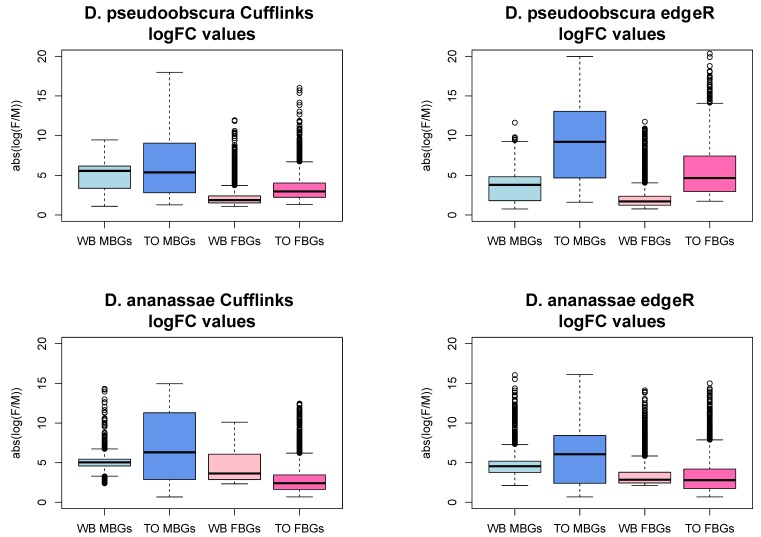
We examined the magnitude of the log fold change of expression levels between testis and ovary or male and female whole body to better understand the difference between the two analyses' results. Male-biased genes (MBGs) and female-biased genes (FBGs) show larger magnitudes of log2 fold changes (i.e. log2[expression level in male tissue/ expression level in female tissue]) in testis/ovary analyses than in WB analyses (Figure S1). Three different scenarios could account for this pattern. For MBGs, for example, higher log2 fold change in expression in testis/ovary relative to WB analyses could be caused by i) lower expression in ovary than in female WB, ii) higher expression in testis than in male WB, or iii) both higher expression in testis and lower expression in ovaries relative to WBs. We examined genes called sex-biased in testis/ovary but not in WB Cuffdiff analyses. Consistent with scenario iii), MBGs have significantly lower expression in ovary and higher expression in testis relative to female and male WB, respectively, in both species (t-tests, all p < 1e-05). FBGs also follow scenario iii) (t-tests, p<1e-05), except D. pseudoobscura female expression levels are not different between WB and ovary. Similar D. pseudoobscura WB and ovary FBG expression levels may be expected if FBGs are enriched with broadly-expressed genes as they are in D. melanogaster 5,11. Except for the latter observation, these general results are consistent with the idea that gonad samples "concentrate" sex-biased expression relative to WB.
Figure S1.
Testis versus ovary comparisons result in significantly greater magnitudes of fold change relative to whole body comparisons. WB = whole body comparison, TO = testis-ovary comparison, MBGs = male-biased genes, FBGs = female-biased genes, logFC = log fold change (female / male). The y- axis is the absolute value of the ratio of normalized expression values of female whole body to male whole body or ovary to testis. TO logFCs are significantly higher than their WB counterparts in every case (t-test, p-value < 2.2e-16), except D. ananassae WB FBGs show greater logFCs (Cuffdiff: P<2.2e-16; edgeR: P=3.7e-09).
In contrast to sex-biased genes, genes that were tested and unbiased in both testis/ovary and WB analyses do not have significantly different expression levels in whole male/testis or whole female/ovary in either species (t-tests, all p>0.05), except D. ananassae whole female expression levels are significantly higher than ovary levels (t-test, p <1e-05). This could indicate that D. ananassae ovary RNA contributes less to the WB RNA pool relative to other species 2, resulting in less detectable female bias in WB samples. These results also highlight the utility of this dataset for determining differences in sex-bias between Drosophila species, and to assess fine-scale differences in expression across the genus.
Finally, more MB and FB genes were detected in D. pseudoobscura reproductive tract samples than testis/ovary analyses (Table 1), which agrees with the hypothesis that the majority of sex-biased gene expression occurs in sex-specific organs. For instance, Drosophila male reproductive tracts include seminal vesicles and accessory glands, which have additional sex-biased genes not expressed in testis. Expression profiles of those particular sex-specific organs would also improve the assessment of sex-biased genes.
Acknowledgments
We thank Sidi Chen for help with RNA-seq. MDV was supported by National Institutes of Health grant R0IGM078070-01A1, NIH ARRA supplement grant R01 GM078070-03S1 and the Fundação de Amparo à Pesquisa do Estado de São Paulo (FAPESP) for travel (2013/09714-6). NWV was supported by a National Science Foundation Graduate Research Fellowship and NIH Genetics and Regulation Training Grant T32 GM007197.
Author contributions: MDV designed the study, NWV and MDV collected the samples, NWV analyzed the data, NWV and MDV wrote the paper.
Appendix A
References
- 1.Ellegren H, Parsch J. The evolution of sex-biased genes and sex-biased gene expression. Nat Rev Gen. 2007;8:689–98. doi: 10.1038/nrg2167. [DOI] [PubMed] [Google Scholar]
- 2.Zhang Y, Sturgill D. et al. Constraint and turnover in sex-biased gene expression in the genus Drosophila. Nature. 2007;450:233–7. doi: 10.1038/nature06323. [DOI] [PMC free article] [PubMed] [Google Scholar]
- 3.Celniker SE, Dillon L, Gerstein M. et al. Unlocking the secrets of the genome. Nature. 2009;459:927–30. doi: 10.1038/459927a. [DOI] [PMC free article] [PubMed] [Google Scholar]
- 4.Langmead B, Salzberg S. Fast gapped-read alignment with Bowtie 2. Nat Meth. 2012;9:357–9. doi: 10.1038/nmeth.1923. [DOI] [PMC free article] [PubMed] [Google Scholar]
- 5.Assis R, Zhou Q, Bachtrog D. Sex-biased transcriptome evolution in Drosophila. Genome Biol Evol. 2011;4:1189–200. doi: 10.1093/gbe/evs093. [DOI] [PMC free article] [PubMed] [Google Scholar]
- 6.Trapnell C, Hendrickson D, Sauvegeu M. et al. Differential analysis of gene regulation at transcript resolution with RNA-seq. Nat Biotech. 2013;31:46–53. doi: 10.1038/nbt.2450. [DOI] [PMC free article] [PubMed] [Google Scholar]
- 7.Robinson MD, McCarthy DJ, Smyth GK. edgeR: a Bioconductor package for differential expression analysis of digital gene expression data. Bioinformatics. 2010;26:139–40. doi: 10.1093/bioinformatics/btp616. [DOI] [PMC free article] [PubMed] [Google Scholar]
- 8.Anders S. http://www-huber.embl.de/users/anders/HTSeq/
- 9.Risso D, Schwartz K, Sherlock G. et al. GC-content normalization for RNA-Seq data. BMC Bioinformatics. 2010;12:480–97. doi: 10.1186/1471-2105-12-480. [DOI] [PMC free article] [PubMed] [Google Scholar]
- 10.Benjamini Y, Hochberg Y. Controlling the false discovery rate: A practical and powerful approach to multiple testing. J Royal Stat Soc B. 1995;57:289–300. [Google Scholar]
- 11.Meisel RP. Towards a more nuanced understanding of the relationship between sex-biased gene expression and rates of protein-coding sequence evolution. Mol Biol Evo. 2011;28:1893–900. doi: 10.1093/molbev/msr010. [DOI] [PMC free article] [PubMed] [Google Scholar]


