Abstract
Hyperleptinemia is usually associated with obesity and leptin resistance. Endothelial cell leptin receptor knockout (ELKO) mice without a signaling membrane-bound leptin receptor in endothelia, however, have profound hyperleptinemia without signs of leptin resistance. Leptin mRNA in adipose tissue was unchanged. To test the hypothesis that the ELKO mutation results in delayed degradation and slowed excretion, we determined the kinetics of leptin transfer in groups of ELKO and wildtype mice after intravenous bolus injection of 125I-leptin and the reference substance 131I-albumin. The degradation pattern of 125I-leptin in serum and brain homogenates at different time points between 10-60 min was measured by HPLC and acid precipitation. Although ELKO mice had reduced uptake of 125I-leptin uptake by the brain and several peripheral organs, leptin was more stable in blood and tissue. There was no change in the rate of renal excretion. ELISA showed that serum soluble leptin receptor, known to antagonize leptin transport, had a 400-fold increase, probably contributing to the hyperleptinemia and reduced tissue uptake. Thus, the ELKO mutation unexpectedly increased the stability of leptin but suppressed its tissue uptake. These changes probably contribute to the known partial resistance of the ELKO mice to diet-induced obesity.
Keywords: Leptin, turnover, endothelia, transport, soluble leptin receptor, ELKO
Introduction
The overall goal of this study was to determine the cause of hyperleptinemia in mice with an endothelial leptin receptor mutation (ELKO). We have recently reported that ELKO mice show an improved metabolic profile in response to diet-induced obesity. In microvessels from these mice, leptin-induced pSTAT3 signaling is abolished (Pan et al, 2012), whereas leptin receptor expression and signaling in the hypothalamus do not show significant change (unpublished). This shows the importance of the vasculature in information exchange involving leptin signaling. This also raises the questions of whether the changes are unique to the blood-brain barrier (BBB), by which leptin reaches its CNS targets, and how a lack of endothelial leptin signaling induces hyperleptinemia without worsening leptin resistance.
Leptin serves many physiological functions, including feeding suppression, immune modulation, sympathetic activation, liver metabolism, apoptosis, extracellular matrix remodeling and hypertrophy, skeletal development and bone elongation, and neurotrophic effects. As a 16 kDa adipokine produced mainly by fat tissue, leptin reaches the brain and spinal cord by crossing the BBB (Banks et al, 1996) and blood-cerebrospinal fluid barrier (Zlokovic et al, 2000). Leptin resistance is a term describing a unique phenomenon that obese mice have hyperleptinemia but desensitized response resulting from altered cellular signaling and saturation of BBB transport (Frederich et al, 1995; Ahima and Osei, 2004).
Leptin concentrations in blood probably represent the homeostatic equilibrium of its production, tissue uptake, degradation, and excretion clearance. Leptin uptake by peripheral organs appears to be mediated by fenestrated microvessels and shows a distinct pattern of tissue distribution. Kinetic assays in rats indicate that leptin has an initial fast decay pool (t1/2 = 3.4 min) followed by a slower decay pool (t1/2 = 71 min) with an overall clearance rate of 6.16 ml/min/kg. At 60 and 180 min after intravenous (iv) delivery the highest concentration of leptin is seen in small intestine, and this is almost four times the level found in kidney, liver, stomach, or lung (Hill et al, 1998). Kidney mediates a rapid uptake and excretion of leptin, with about 68% of leptin localized in the kidney 30 min after tracer injection shown by positron emission tomography (PET) imaging. Furthermore, leptin uptake by the renal tubular cells is mediated by a saturable receptor-mediated mechanism, independent of the leptin receptor ObRb, whereas megalin (gp330 receptor) is involved in its renal uptake and degradation (Ceccarini et al, 2009).
To determine how leptin uptake and turnover are regulated, we used ELKO mice. These mutant mice were generated by cross-breeding Tie2-cre mice with ObR-floxed mice for 2 generations, resulting in production of a membrane-bound mutant ObR with only a short cytoplasmic tail devoid of intracellular cellular signaling in endothelia and epithelia with a Tie2 promotor. The Tie2-cre transgenic mice express Cre recombinase under the direction of the receptor tyrosine kinase Tek promoter/enhancer, which has been shown to provide uniform expression in endothelial cells during embryogenesis and adulthood (Koni et al, 2001). The ELKO mice show elevated blood leptin and moderately improved metabolic phenotype in response to a high fat diet (Pan et al, 2012). Several factors could contribute to this unexpected hyperleptinemia: (a) increased synthesis of leptin by adipose tissue, (b) reduced tissue uptake of leptin, or (c) a higher level of the main leptin binding protein, i.e., the soluble leptin receptor (sObR). Among these potential factors, sObR serves not only as a leptin antagonist (Yang et al, 2004) and inhibitor of leptin transport (Tu et al, 2008), but also a reservoir to bind leptin (Huang et al, 2001) and thus prolong its half-life. Therefore, we determined both leptin production and sObR levels in blood.
Hyperleptinemia could be caused by reduced clearance out of or leptin transport into target organs. All membrane-bound leptin receptors have the potential to serve as leptin transporters (Tu et al, 2007, 2010). We have shown that in ELKO mice the apparent leptin transport from blood to brain remains the same as in wildtype (WT) littermates, but the influx to brain parenchyma is mildly increased, particularly after in-situ brain perfusion (Hsuchou et al, 2011). This suggests a change of the pharmacokinetics of leptin transport. Previously (Hsuchou et al, 2011), we tested leptin transport across the BBB within 20 min of iv injection, since leptin is less stable beyond this time (Banks et al, 1996; Kastin et al, 2001). Here, we extended the time course and determined the tissue distribution and degradation patterns of leptin in ELKO.
Materials and Methods
1. Tissue distribution and degradation patterns of 125I-leptin after iv injection
Leptin was purchased from R & D Systems (Minneapolis, MN) and radioactively labeled with 125I (Perkin Elmer, Boston, MA) by use of the chloramine-T method. The specific activity of 125I labeled leptin (125I-leptin) was 96 Ci/g. 131I-albumin was used simultaneously in the same mice as a reference substance reflecting the vascular space, as described previously (Pan and Kastin, 2007).
Adult ELKO mice from C57 background (body weight: 22.58 ± 1.99 g) were bred as described previously (Hsuchou et al, 2011; Pan et al, 2012) and studied along with their littermates without Tie2-cre genes which served as the WT control (body weight: 22.16 ± 0.53 g). The mice were anesthetized with urethane (40 mg/kg, ip) and their left jugular veins exposed. A bolus injection of 125I-leptin and 131I-albumin (about 2 μCi/mouse each) in 100 μl of lactated Ringer's (LR) solution containing 1% bovine serum albumin (BSA) was delivered iv at time 0. At time points of 10, 30, and 60 min, mice (n = 4-6 /time point) were sacrificed and arterial blood collected by dissection of the right carotid arteries to obtain serum. Brain, kidney, liver, spleen, and pancreas were collected at the same time. Brain was further dissected into hypothalamus, hippocampus, cerebral cortex, and the remainder. The tissue and organs were weighed and the radioactivity measured with a dual-channel program on a Wallac 1470 Wizzard γ-counter along with 50 μl of serum. The influx rate (Ki) and initial volume of distribution (Vi) of 125I-leptin and 131I-albumin were calculated from the linear regression correlation between tissue/serum ratio of radioactivity over time.
To determine the degradation patterns of 125I-leptin, an additional set of kidney and liver was dissected and homogenized on ice with 300 μl phosphate-buffered saline (PBS) containing HaltTM protease inhibitor cocktail (Thermo Scientific, Rockford, IL). After centrifugation at 18000 g at 4 °C, the supernatant (100 μl) as well as 10 μl of serum diluted in 90 μl PBS with 1% BSA was subjected to acid precipitation by mixing and incubating on ice for 15 min with an equal volume (100 μl ) of 30% brine trichloroacetic acid. The precipitate and supernatant of the mixture were further separated by centrifugation at 3500 g, 4 °C. Acid precipitability was calculated as the percent radioactivity in the precipitate over the total amount in both precipitate and supernatant. Part of the serum and supernatant of brain homogenate at 60 min was stored at -20 °C until analysis of the radiotracer degradation pattern by reversed phase high performance liquid chromatography (HPLC), as described previously (Kastin et al, 2001). The mobile phase was acetonitrile in 0.1% of trifluoroacetic acid. The concentration of acetonitrile increased from 10 to 90% over 40 min and then linearly increased to 100% for another 5 min. One ml/min fractions were collected and the radioactivity of each fraction was determined in the γ-counter. Additional peripheral organs, brain, and blood from another ELKO mouse not injected with radiotracers were processed as described earlier, with addition of radiotracers directly to PBS/protease inhibitor solution or blood. These served as processing controls.
2. qPCR of leptin production by subcutaneous fat
In separate ELKO (n = 4) and WT (n = 5) mice 4 months old, inguinal subcutaneous fat was obtained and lymph nodes were removed. Fat tissue was homogenized. Total RNA was extracted and reversely transcribed to cDNA. qPCR for leptin was performed with a SYBR Green assay kit using the following primers: leptin: 5′-TGG CTT TGG TCC TAT CTG TC-3′ (forward) and 5′- ACC ACC TCT GTG GAG TAG AG-3′ (reverse); Glyceraldehyde 3-phosphate dehydrogenase (GAPDH) reference gene: 5′- TGT GTC CGT CGT GGA TCT GA -3 (forward) and 5′- CCT GCT TCA CCA CCT TCT TGA -3′ (reverse).
3. Measurement of leptin and sObR by ELISA
Leptin concentration in serum was measured by ELISA as described previously (Pan et al, 2012). A mouse Leptin R DuoSet ELISA assay (R&D Systems) was used to measure sObR in serum (n = 4-5 /group). The standard range is 0 – 10 ng/mL. The kit measures total leptin receptor, both bound and free. Each concentration was determined from a mean of duplicate assays.
4. Statistics
Group means are expressed with their standard errors. For 125I-leptin uptake, multiple-time regression analysis was performed, with group differences compared by the least-squares method (Kastin et al, 2001). For degradation assays, leptin mRNA, leptin and sObR levels, the difference between ELKO and WT groups was determined by unpaired t-tests.
Results
1. ELKO mice show less degradation of 125I-leptin in serum and peripheral organs
A mild dissociation of 125I during -20 °C storage and processing for HPLC was apparent, as there was 0.6% free 125I and 91.7% intact 125I-leptin in the injection solution (Fig.1A, dashed black line). In serum from the WT mouse collected 60 min after iv injection of 125I-leptin and 131I-albumin, 11% of the total 125I was represented by free 125I, whereas 125I-leptin accounted for 74.7%. Serum from an ELKO mouse had 3.7% free 125I and 87% 125I-leptin at this time. A minor peak at the retention time of 31-32 min was seen in the injection solution and in sera from both WT and ELKO mice, and it was acid precipitable. This might represent a partially degraded polypeptide fragment, or di-iodinated leptin. Besides the major elution position at 37 min, ELKO serum also showed a shoulder at the retention time of 39 min, which might also be related to partial degradation of 125I-leptin or high affinity binding with (Fig.1A). By contrast, 131I-albumin in the same samples eluted in one distinctive peak, without dissociation of free 131I (Fig.1B).
Fig.1.


The effect of ELKO on 125I-leptin degradation pattern in serum as shown by HPLC. At 60 min after iv injection of 125I-leptin, 74.7% and 87% of the radioactivity represents intact leptin in the WT and ELKO mice, respectively (A). By contrast, 131I-albumin in the same samples eluted in one distinct peak without dissociation into free 131I or degraded into peptide fragments (B).
Unlike in serum in which the amount of intact leptin was higher in the ELKO than WT mice at 60 min, most of the 125I-leptin in the brain was degraded in both WT and ELKO mice at 60 min in comparison with the injection solution and process control (Fig.2A). The 131I-albumin in both WT and ELKO brains showed only minor dissociation of free 131I (Fig.2B).
Fig.2.


The effect of ELKO on 125I-leptin degradation pattern in the brain as shown by HPLC. Most of the 125I-leptin in both WT and ELKO brains was degraded 60 min after iv injection, compared with the injection solution and the processing control (A). Although there was slight degradation, most of the 131I-albumin remained intact in the brains of both WT and ELKO mice (B).
The percent acid precipitability represents an approximate estimate of intact 125I-leptin, as free 125I and small peptide fragments cannot be precipitated. As shown in figure 3 (A and C), the % acid precipitability decreased over time, and this was more pronounced in the WT group than the ELKO mice. At 60 min, ELKO mice showed a significantly higher amount of intact 125I-leptin in the serum (Fig.3A, p < 0.01) and liver (Fig.3B, p < 0.01), though there was no difference in the kidney (Fig.3C). By contrast, 131I was almost 100% acid precipitable, and there was no difference between ELKO and WT, or among different organs, including kidney (data not shown). Thus, 131I radioactivity represents intact albumin throughout the study, whereas 125I reflects intact leptin only in the first 10 min in this study in most peripheral organs. Kidney showed the most degradation of leptin at all time points.
Fig.3.
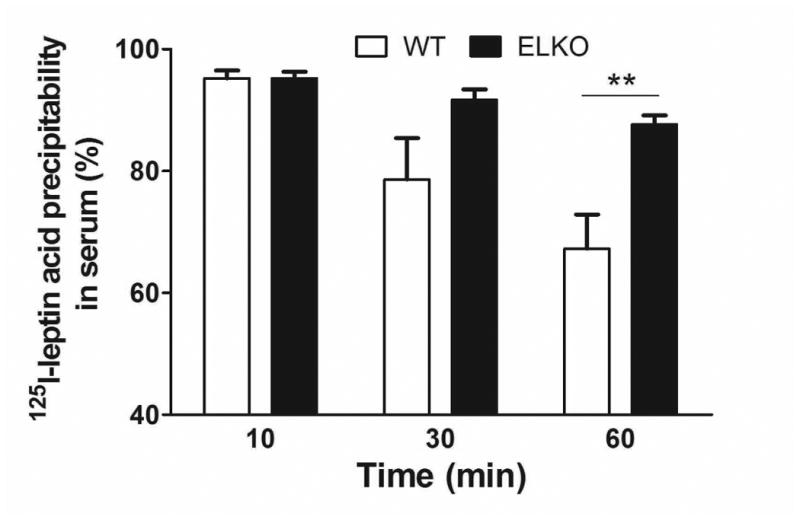
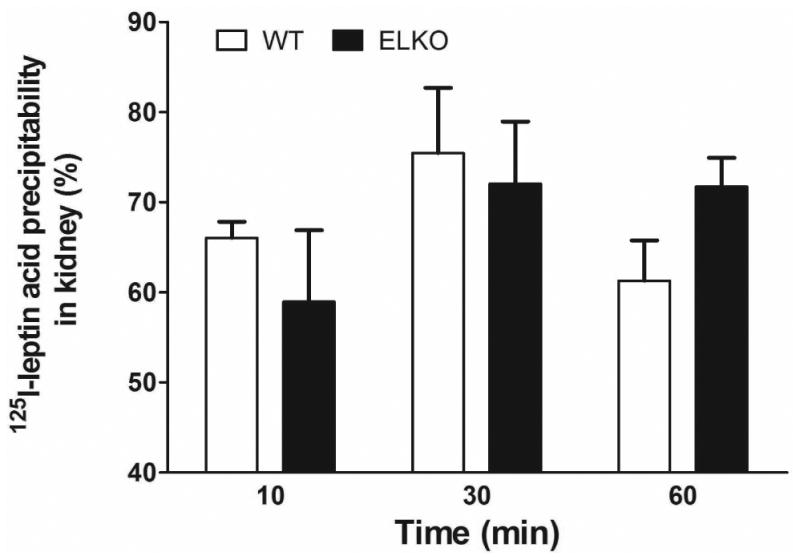
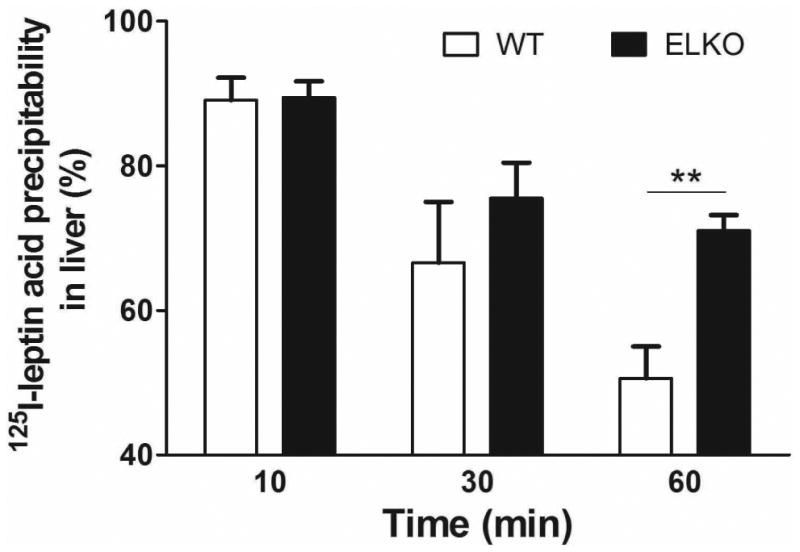
Effect of the ELKO mutation on 125I-leptin degradation. Acid precipitation was performed on serum (A), supernatants of kidney (B), and liver (C) at 10, 30 and 60 min after iv injection of 125I-leptin. At 60 min, the ELKO mice showed significantly higher amounts of intact leptin in serum and liver with no difference in kidney when compared with WT mice (n = 4-6 /time point in each group). **: p < 0.01.
2. ELKO mice show less accumulation of 125I-leptin in brain over time
The brain/serum ratio of 125I-leptin is similar in ELKO and WT mice at 10 min, a time at which 125I-leptin remains intact (Banks et al, 1996; Kastin et al, 2001). The values are nearly twice those of 131I-albumin, an established marker for vascular space and paracellular permeability. At 30 and 60 min after iv injection, the uptake of 131I-albumin showed the expected plateau without further increase, with the influx rate being -0.021 ± 0.019 μl/g-min in the WT group and 0.028 ± 0.019 μl/g-min in the ELKO group. Neither was significantly different from zero. By contrast, the influx of 125I-leptin in the WT mice showed a persistent elevation (Ki = 0.382 ± 0.131 μl/g-min). This is higher than the value for 125I-leptin in the ELKO group (Ki = 0.098 ± 0.043 μl/g-min, p = 0.05), or for 131I-albumin in either group (Fig.4A).
Fig.4.

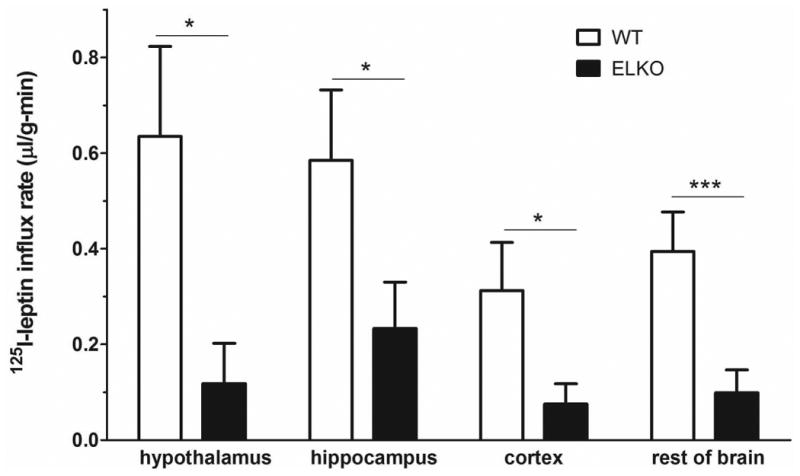
Influx of 125I-leptin in the brain over 10, 30, and 60 min after iv injection in the ELKO mice was significantly lower than in the WT mice. The vascular space marker 131I-albumin did not show a significant uptake in either WT or ELKO mice (A). The higher influx rate of 125I-leptin in the WT than ELKO mice was seen in all brain regions sampled, including the hypothalamus, hippocampus, cerebral cortex, and the rest of the brain (B). n = 4-6/group. * p < 0.05. *** p < 0.005.
The influx rate of 125I-leptin in the hypothalamus, hippocampus, cerebral cortex, and the rest of the brain is shown in figure 4B and Table 1. Overall, the WT mice had a higher influx, whereas the ELKO mice had a much attenuated accumulation of 125I-leptin in the brain regions over a time course of 10 – 60 min.
Table 1. Influx rate (Ki) of 125I-leptin between WT and ELKO groups.
| Ki (μl/g-min) | WT | ELKO |
|---|---|---|
| hypothalamus | 0.635 ± 0.188 | 0.118 ± 0.084 |
| hippocampus | 0.585 ± 0.147 | 0.233 ± 0.097 |
| Cerebral cortex | 0.313 ± 0.101 | 0.076 ± 0.042 |
| The rest of the brain | 0.394 ± 0.083 | 0.099 ± 0.047 |
| kidney | -20.31 ± 11.50 | -25.39 ± 8.95 |
| spleen | 13.48 ± 9.24 | -2.342 ± 3.266 |
| pancreas | 4.135 ± 1.840 | 0.408 ± 0.496 |
| liver | -1.232 ± 1.308 | -1.143 ± 0.5578 |
3. Kinetics of 125I-leptin and 131I-albumin in serum and kidney of ELKO mice
The disappearance of 125I-leptin in serum fit a one-phase exponential decay model. The half life of 125I-leptin in the WT mice was 18 min whereas that in the ELKO mice was 12.8 min (Fig.5A). The kidney/serum ratio of 125I-leptin decreased over time between 10 and 60 min (Fig.5B and Table 1), consistent with rapid renal excretion of leptin. Though the slope of the linear regression lines was not significantly different between WT and ELKO mice, the initial volume of distribution Vi (the intercept at the Y axis) was significantly lower in ELKO (p <0.05). In addition, the uptake was lower in the ELKO group at all time points (10, 30, and 60 min). This suggests that less 125I-leptin reached the kidney for excretion during the time of the study. 131I-Albumin uptake and excretion from the kidney were negligible in both WT and ELKO groups.
Fig.5.


In serum, 125I-leptin showed one-phase exponential decay in both WT (T1/2 = 18 min) and ELKO (T1/2 = 12.8 min) mice (A). In the kidney, leptin showed a rapid efflux. This rate did not differ between the WT and ELKO mice, although the total amount of uptake was lower in the ELKO mice (B).
4. ELKO mice show reduced uptake of 125I-leptin by peripheral organs
In all mice, splenic uptake of 125I-leptin at 10 min after iv injection was about half of the value in the kidney (Fig.5B). While the WT mice had a persistent accumulation of 125I radioactivity in the spleen over a time course of 10-60 min (Ki = 13.48 ± 9.24 μl/g-min), the ELKO mice showed no influx of 125I-leptin over time (Ki = -2.342 ± 3.266 μl/g-min) (Fig 6A). The difference between the groups was mainly caused by the volume of distribution (p < 0.001). A similar pattern was seen in the pancreas, with a significant reduction of Vi in the ELKO mice (p < 0.005) (Fig 6B and Table 1). The liver/serum ratio of 125I at 60 min was even lower than that at 10 min. The volume of distribution was different between the ELKO and WT mice (p < 0.005; Fig 6C and Table 1). In all organs, 131I-albumin did not show a significant influx and there was no difference between ELKO and WT groups.
Fig.6.

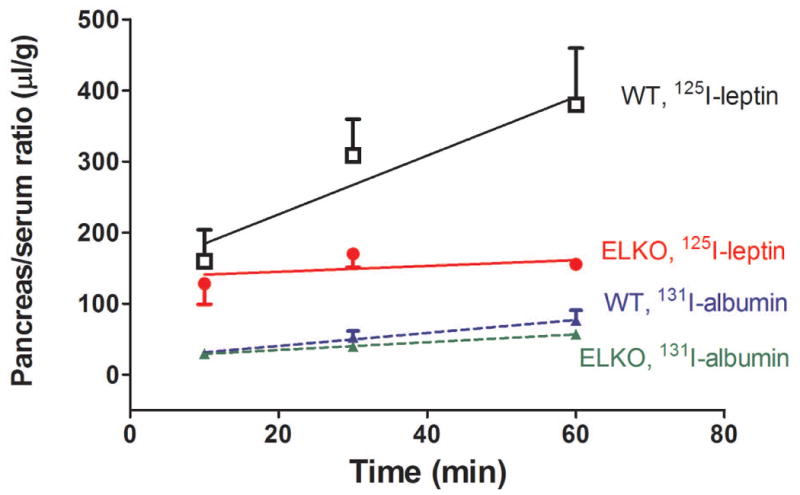
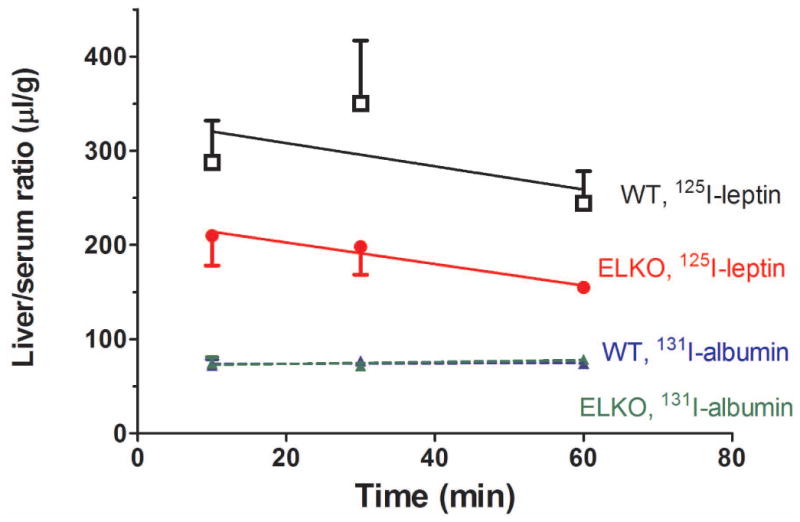
Uptake of 125I-leptin increased over time in the spleen (A), pancreas (B), and liver (C) of the WT mice. By contrast, there was no increase of the accumulation of 125I or even an efflux in the ELKO mice. n = 4-6 /time point in each group. The reference substance 131I-albumin had low levels of uptake that did not differ between ELKO and WT groups.
5. ELKO mice have high concentrations of sObR
We have shown that ELKO mice have pronounced hyperleptinemia in comparison with their WT littermates, with leptin concentrations being 30.13 in the ELKO mice vs 2.23 ng/ml in their WT littermates (Pan et al, 2012). Among the three major factors that might contribute to hyperleptinemia, we show in figure 4B that renal excretion was not accelerated in the ELKO mice. We also show a reduced uptake of 125I-leptin by tissue and organs in the ELKO mice. A remaining factor is leptin production. However, the ELKO and WT mice did not differ in leptin mRNA levels in subcutaneous fat, the major source of leptin production (Fig.7A, left panel). In these mice, the serum leptin concentration was elevated (p < 0.005) (Fig.7A, right panel). The hyperleptinemia was not fully explained by increased production in the ELKO mice.
Fig.7.


In comparison with the WT mice (n = 5), the ELKO mice (n = 4) showed no change in leptin mRNA from subcutaneous adipose tissue (left group of bars, A) but increased serum leptin concentration (right group of bars, A). In addition, there was a nearly 400-fold higher serum sObR (B). ***: p < 0.005.
Unexpectedly, blood sObR concentrations were almost 400-times higher in the ELKO than in the WT mice (Fig.7B). The results suggest that sObR may play a major role in the increased stability of leptin in blood and reduced tissue uptake in the ELKO mice.
Discussion
In this study, we tested potential factors that might contribute to hyperleptinemia in the ELKO mice: (a) reduced tissue uptake of leptin; (b) increased synthesis of leptin by adipose tissue, the main source of leptin; or (c) a higher level of the main leptin binding protein sObR.
To determine the effects of endothelial leptin signaling on leptin uptake by various organs and tissues and on the pharmacokinetics of leptin turnover, we chose 3 time points after an iv bolus injection of 125I-leptin: at 10 min when leptin is known to remain intact (Banks et al, 1996; Kastin et al, 2001), 30 min when partial degradation and significant renal excretion have occurred (Hill et al, 1998; Ceccarini et al, 2009), and 60 min when the efflux and influx of leptin from any given organ should have reached equilibrium. We found that 125I-leptin was more stable in the serum and liver of ELKO mice at 60 min than in WT mice, but showed similar kinetics of renal clearance between ELKO and WT. Such similarity in renal clearance between ELKO and WT is consistent with the literature showing that the renal clearance of leptin is megalin-dependent and ObR-independent (Ceccarini et al, 2009). Therefore, renal clearance of leptin is unlikely to explain the hyperleptinemia in ELKO mice.
As we measured circulating 125I-leptin for the prolonged time of 60 min, we found an increased accumulation of radioactivity in the brain, spleen, and pancreas, organs that have distinctive leptin receptor distribution and are targets of leptin action. Nonetheless, the uptake of 125I-leptin was lower in ELKO mice, indicating that less leptin would reach the parenchyma of these organs, including the CNS. Further, HPLC results showed that most of the radioactivity in the ELKO and WT brain homogenate at 60 min was free 125I. Dissociation of 125I and degradation of 125I-leptin might have occurred after intact 125I-leptin reached brain parenchyma, or free 125I in the serum might have entered the brain and other target organs. Thus, the total amount of radioactivity measured in the uptake assays represents a combination of intact 125I-leptin, degraded polypeptide fragments, and free 125I. Regardless, the half-life of a polypeptide does not necessarily represent the half-life of its effects (Kastin and Pan, 2006, 2010). The radiotracer uptake assay provides an approximate estimate of the ability of leptin to reach its target; however, this apparent influx may be masked by the presence of endogenous leptin in the circulation and binding proteins that serve as reservoirs as well as inhibitors to provide physical hindrance of tissue permeation.
For the second possibility of hyperleptinemia, the quantitative PCR result showed that there is no difference between ELKO and WT in leptin mRNA levels in the subcutaneous adipose tissue, indicating that leptin transcription is not altered in ELKO. Since leptin is a secreted protein, adipose tissue protein levels by western blotting do not reflect actual production of the protein, and therefore serum leptin was measured by ELISA. The results were consistent with what we reported in an earlier batch of ELKO mice used for metabolic studies (Pan et al, 2012). Though post-transcriptional modulation and discrepancy between mRNA and protein level are possible, it is more probable that increased stability of leptin in the circulation is mainly responsible for the elevated blood leptin concentration.
Regarding the third possibility of hyperleptinemia, ELKO mice had almost 400-times higher concentrations of sObR than WT mice. Displacement and degradation studies have shown that sObR serves as a reservoir to bind leptin (Huang et al, 2001) and thus prolong the half-life of leptin. The cause of the increase of sObR, however, is not yet clear. sObR may be generated by alternative splicing of the ObR transcripts or increased ectodomain shedding (Ge et al, 2002). sObR, which can bind leptin, impedes its actions as well as transport. A high concentration of sObR undoubtedly contributes to hyperleptinemia in ELKO mice. The abundance of endogenous leptin would also compete with 125I-leptin for degradation and tissue uptake. In this way, the combined effects of sObR and hyperleptinemia further conferred greater stability of 125I-leptin in the ELKO mice.
The reduction of 125I-leptin uptake by high concentrations of endogenous leptin and sObR in the blood of ELKO mice is consistent with our previous report in which leptin continues to reach the brain efficiently after in-situ brain perfusion in serum-free buffer, in contrast with iv administration, and even has a higher uptake by brain parenchyma (Hsuchou et al, 2011). In the in-situ brain perfusion setting, the influence of endogenous leptin and sObR in serum are eliminated. In the standard multiple-time regression analysis after iv injection studied within the first 20 min when leptin remains intact in the circulation, the influx of leptin does not differ between the ELKO and WT mice (Hsuchou et al, 2011).
In summary, ELKO mice had reduced 125I-leptin uptake by the CNS and peripheral organs although its renal clearance was unchanged. The specificity of the changes is shown by a lack of difference of 131I-albumin turnover in the ELKO and WT mice. This unexpected pattern of reduced leptin uptake into the peripheral organs (as well as the CNS with its distinct BBB) is unusual, indicating that endothelial leptin receptors play a role of the availability of leptin to its target organs even when peripheral microvessels have fenestrations and are “leaky”. Hyperleptinemia and elevated sObR in the ELKO mice contributed to this kinetic pattern of leptin turnover. The changes may be involved in the mild improvement of metabolic profile of the ELKO mice and their partial resistance to obesity.
Acknowledgments
Grant support was provided by NIH (DK54880 and DK92245 to AJK, and NS62291 to WP). The ObR-floxed mice used to generate the ELKO mutant mice were kindly provided by Drs. Streamson Chua Jr (Albert Einstein Medical College) and Silvana Obici (University of Cincinnati).
Footnotes
Conflict of Interest: None
References
- Ahima RS, Osei SY. Leptin signaling. Physiol Behav. 2004;81:223–241. doi: 10.1016/j.physbeh.2004.02.014. [DOI] [PubMed] [Google Scholar]
- Banks WA, Kastin AJ, Huang W, Jaspan JB, Maness LM. Leptin enters the brain by a saturable system independent of insulin. Peptides. 1996;17:305–311. doi: 10.1016/0196-9781(96)00025-3. [DOI] [PubMed] [Google Scholar]
- Ceccarini G, Flavell RR, Butelman ER, Synan M, Willnow TE, Bar-Dagan M, Goldsmith SJ, Kreek MJ, Kothari P, Vallabhajosula S, Muir TW, Friedman JM. PET imaging of leptin biodistribution and metabolism in rodents and primates. Cell Metab. 2009;10:148–159. doi: 10.1016/j.cmet.2009.07.001. [DOI] [PMC free article] [PubMed] [Google Scholar]
- Frederich RC, Hamann A, Anderson S, Lollmann B, Lowell BB, Flier JS. Leptin levels reflect body lipid content in mice: evidence for diet-induced resistance to leptin action. Nat Med. 1995;1:1311–1314. doi: 10.1038/nm1295-1311. [DOI] [PubMed] [Google Scholar]
- Ge H, Huang L, Pourbahrami T, Li C. Generation of soluble leptin receptor by ectodomain shedding of membrane-spanning receptors in vitro and in vivo. J Biol Chem. 2002;277:45898–45903. doi: 10.1074/jbc.M205825200. [DOI] [PubMed] [Google Scholar]
- Hill RA, Margetic S, Pegg GG, Gazzola C. Leptin: its pharmacokinetics and tissue distribution. International Journal of Obesity. 1998;22:765–770. doi: 10.1038/sj.ijo.0800656. [DOI] [PubMed] [Google Scholar]
- Hsuchou H, Kastin AJ, Tu H, Markadakis EN, Stone KP, Wang Y, Heymsfield SB, Chua SC, Jr, Obici S, Magrisso IJ, Pan W. Effects of cell type-specific leptin receptor mutation on leptin transport across the BBB. Peptides. 2011;32:1392–1399. doi: 10.1016/j.peptides.2011.05.011. [DOI] [PMC free article] [PubMed] [Google Scholar]
- Huang L, Wang Z, Li C. Modulation of circulating leptin levels by its soluble receptor. J Biol Chem. 2001;276:6343–6349. doi: 10.1074/jbc.M009795200. [DOI] [PubMed] [Google Scholar]
- Kastin AJ, Akerstrom V, Pan W. Validity of multiple-time regression analysis in measurement of tritiated and iodinated leptin crossing the blood-brain barrier: meaningful controls. Peptides. 2001;22:2127–2136. doi: 10.1016/s0196-9781(01)00569-1. [DOI] [PubMed] [Google Scholar]
- Kastin AJ, Pan W. Editorial: Intranasal leptin: blood-brain barrier bypass (BBBB) for obesity? Endocrinology. 2006;147:2086–2087. doi: 10.1210/en.2006-0208. [DOI] [PubMed] [Google Scholar]
- Kastin AJ, Pan W. Concepts for Biologically Active Peptides. Curr Pharm Des. 2010;16:3390–3400. doi: 10.2174/138161210793563491. [DOI] [PMC free article] [PubMed] [Google Scholar]
- Koni PA, Joshi SK, Temann UA, Olson D, Burkly L, Flavell RA. Conditional vascular cell adhesion molecule 1 deletion in mice: impaired lymphocyte migration to bone marrow. J Exp Med. 2001;193:741–754. doi: 10.1084/jem.193.6.741. [DOI] [PMC free article] [PubMed] [Google Scholar]
- Pan W, Hsuchou H, Cornelissen-Guillaume GG, Jayaram B, Wang Y, Tu H, Halberg F, Wu X, Chua SC, Jr, Kastin AJ. Endothelial leptin receptor mutation provides partial resistance to diet-induced obesity. J Appl Physiol. 2012;112:1410–1418. doi: 10.1152/japplphysiol.00590.2011. [DOI] [PMC free article] [PubMed] [Google Scholar]
- Pan W, Kastin AJ. Mahogany, blood-brain barrier, and fat mass surge in Avy mice. International Journal of Obesity. 2007;31:1030–1032. doi: 10.1038/sj.ijo.0803536. [DOI] [PubMed] [Google Scholar]
- Tu H, Hsuchou H, Kastin AJ, Wu X, Pan W. Unique leptin trafficking by a tailless receptor. FASEB J. 2010;24:2281–2291. doi: 10.1096/fj.09-143487. [DOI] [PMC free article] [PubMed] [Google Scholar]
- Tu H, Kastin AJ, Hsuchou H, Pan W. Soluble receptor inhibits leptin transport. J Cell Physiol. 2008;214:301–305. doi: 10.1002/jcp.21195. [DOI] [PubMed] [Google Scholar]
- Tu H, Pan W, Feucht L, Kastin AJ. Convergent trafficking pattern of leptin after endocytosis mediated by ObRa - ObRd. J Cell Physiol. 2007;212:215–222. doi: 10.1002/jcp.21020. [DOI] [PubMed] [Google Scholar]
- Yang G, Ge H, Boucher A, Yu X, Li C. Modulation of direct leptin signalling by soluble leptin receptor. Mol Endocrinol. 2004;18:1354–1362. doi: 10.1210/me.2004-0027. [DOI] [PubMed] [Google Scholar]
- Zlokovic BV, Jovanovic S, Miao W, Samara S, Verma S, Farrell CL. Differential regulation of leptin transport by the choroid plexus and blood-brain barrier and high affinity transport systems for entry into hypothalamus and across the blood-cerebrospinal fluid barrier. Endocrinol. 2000;141:1434–1441. doi: 10.1210/endo.141.4.7435. [DOI] [PubMed] [Google Scholar]


