Summary
Cyclic nucleotides (cAMP and cGMP) as second messengers regulate a wide variety of biological processes such as cellular growth, secretary signaling and neuroplasticity (1). These processes can be regulated by increasing the synthesis of cyclic nucleotides (cyclases), by regulation of cAMP and cGMP effector proteins such as cAMP- and cGMP-dependent protein kinases, or by regulation of cyclic nucleotide degradation via cyclic nucleotide phosphodiestases (PDEs) (2). At present PDEs are classified into 11 gene families, each containing several different isoforms and splice variants. All PDEs share considerable homology in their catalytic domains but substantially differ in their N-terminal regions, that contain different types of regulatory domains (3). The different PDEs show complex substrate specificity. PDE5, PDE6 and PDE9 are considered to be cGMP specific, while PDE1, PDE2, PDE3, PDE10 and PDE11 can hydrolyze both cGMP and cAMP. PDE4, PDE7 and PDE8 use mainly cAMP as their substrates at physiological substrate levels. Here we described two methods designed for measuring cGMP (cAMP) hydrolytic activities. The first one is a tradiotional method using radioactive substrates and the second one is a recently developed non-radioactive method based on Isothermal Titration Calorimetry.
Keywords: phosphodiestases, cGMP, hydrolysis, radioactivity, Isothermal Titration Calorimetry
1. Introduction
Since cyclic nucleotide PDE activities were first reported (Figure 1), a number of different PDE assays have been developed. The original methods for determining PDE activity were fixed-time assays that all used a coupled enzyme assay that ended up measuring the release of inorganic phosphate. Usually in these reaction the coupled step was conversion of the product of the PDE reaction (either 5′AMP or 5′GMP) to the corresponding nucleoside and phosphate by an excess of some form of 5′nucleotidase (most commonly Crotalus atrox snake venom). This assay had the advantage of simplicity, but the disadvantage of requiring very sensitive phosphate measurement procedures to be applicable for most of the high-affinity low-Km PDEs. However, an adaptation of this assay is still occasionally used in high throughput format for purified preparations of several of the higher Km/Vmax PDEs, such as PDE6 (4).
Fig. 1.
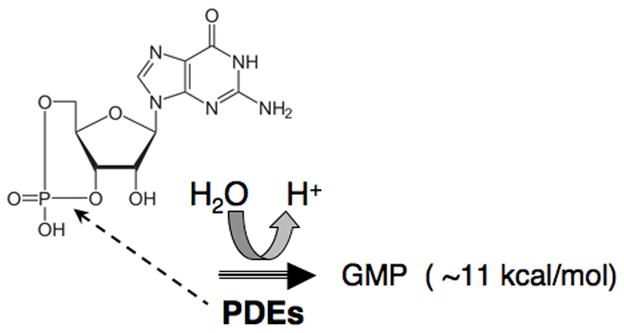
A schematic illustration of cGMP PDE reaction, showing the 3′ cyclic phosphate bond of cGMP, hydrolyzed by PDEs
As a result of the sensitivity issues and the requirement for purified preparations of enzyme, the inorganic phosphate release assays were largely surplanted by methods for measuring PDE activities that utilized radioactive labeled cyclic nucleotides as substrates, such as [3H], [14C] or [32P] cAMP/or cGMP, again followed by a second reaction to produce adenosine/guanosine, and their separation from unhydrolyzed substrates by ion-exchange resin (5, 6). This assay is the only one presently available that can efficiently measure the activity of the very low Km PDEs (eg PDE3, PDE7, PDE8, and PDE9). This basic assay is described below (Method 3.1).
Another assay, the pH based PDE assay, (7) makes use of the fact that a proton is released during the hydrolysis of cNMP to 5′NMP (Figure 1). This assay has the advantage that with an appropriately sensitive pH meter, PDE activity can be measured in real time. The pH assay has been mostly applied for measuring activity of the light-activated, cGMP-specific PDE6 since this PDE isozyme has such high catalytic activity. However, in principle, it can be used for any of the higher Vmax PDEs where substrate concentrations in the mM range can be utilized. This PDE assay has the real advantage of allowing real time measurement of activity and is not limited to selected fixed-time responses. It can also be used with most cNMP analogs if they are a reasonable substrate.
More recently higher throughput PDE assays such as a luminescence based PDE method (8) and method using fluorescein-labeled cyclic nucleotides for fluorescence polarization (9) have been developed. In general, all of these protocols to measure PDE hydrolytic activities utilize either cAMP or cGMP or their fluorescent analogs as substrates.
Finally, there has been a need to determine the 3′-5′ cyclic nucleotide phosphodiesterase activity of the various PDEs using various commonly used cyclic nucleotide analogs as substrates. Since many of these analogs are extensively used in intact cells as tools to elucidate cyclic nucleotide regulated pathways, researchers have needed to know if they were substrates for, inhibitors of, or activators of the various PDEs present in the cells. As most of these compounds are not available in a radioactive form and many of them are rather poor substrates this has been a difficult task. Therefore, in the second part of this chapter we also describe the use of a non-radioactive method for direct determination of PDE enzyme activity by use of Isothermal Titration Calorimetry (ITC) (Method 3.2).
ITC is a useful method for the characterization of the thermodynamics of binding and kinetic parameters of the reaction. The ITC PDE assay is based on the fact that the free energy of hydrolysis of 3′ the phosphate bonds of cAMP and cGMP are comparable with the hydrolysis of ATP and found to be 14 kcal/mol and 11 kcal/mol, respectively (10). This method was originally applied for cyclic nucleotide hydrolysis by measuring the kinetic parameters of PDEs and also their hydrolysis of cyclic nucleotide analogs (11).
2. Materials
-
1
DEAE-Sephadex A-25: make a slurry with the resin and deionized water (10 g in 100 ml of water) and after a couple of hours use approximtely 5 ml for filling the columns. Packed volume of column is 0.25 ml.
-
2
Snake venom: 5′ nucleotidase (from Crotalus atrox venom), dilute to stock concentration of 2.5mg/ml in water, store in the −20°C.
-
3
Low Salt buffer: 20 mM Tris-HCl, pH 6.8 (Room Temperature).
-
4
High Salt buffer: 20 mM Tris-HCl, pH 6.8 + 500 mM NaCl.
-
5
Columns for PDE assays: 5′ Polypropylene Chromatography column, 120 micron filter (Evegreen Scientific, LA).
-
7
Reaction buffer A (5x) for PDE assay: 100 mM Tris, pH 7.5, 4 mM EGTA, 1.0 mg/mL BSA.
-
8
Reaction buffer B (5x) for PDE assay: 100 mM Tris, pH 7.5, 75 mM MgAcetate, 100,000 cpm [3H]-cAMP or [3H]-cGMP.
-
9
Reaction buffer C (5x) to assay calmodulin-dependent PDE (PDE1) in the presence of calmodulin:100 mM Tris, pH 7.5, 100 mM Imidazole, 15 mM MgCl2, 1.0 mg/mL BSA, 20 μg/mL calmodulin, 0.2 mM CaCl2.
-
10
Reaction buffer D (5x) to assay calmodulin-dependent PDE (PDE1) in the presence of EGTA: the same as buffer C, except 10 mM EGTA replaces calmodulin.
-
11
Scintillation fluid (Ultima Gold, PerkinElmer).
-
12
Liguid scintillation counter (PerkinElmer).
-
13
The reaction buffer for the calorimetric assays: 40 mM Mops, pH 7.5, 1 mM MgCl2.
-
14
Purified recombinant PDEs, used for the calorimetric assays, are diluted in 40 mM MOPS pH 7.5 (concentrations: ~0.1–10 nM).
-
15
Calorimeter: VP-ITC MicroCalorimeter (Microcal Inc., Northhamton, MA).
3. Methods
3.1. PDE assay using [3H]-cGMP (or cAMP) as substrates
This Phosphodiesterase Assay is a modification of previously published methods (12, 13). The assay reaction involves a two steps procedure. In the first step: the phosphodiesterase hydrolyses the cyclic nucleotide and produces a 5′-monoposphate product. This reaction is terminated by boiling the sample for 1 minute and then cooling it. In the second step: C. atrox snake venom, which contains a 5′ phosphatase activity but little or no PDE activity, is added to the sample. Since both cyclic nucleotide and 5′-derivative contain a negative charge while the nucleoside does not, the radiolabeled nucleoside can be easily separated from each using any of several different ion exchange resins.
Pipette 50 μL buffer A into 12 mm x 75 mm disposable glass tubes.
Add buffer B and inhibitors (if required). Add enough dH2O to bring reaction volume to 200 μL.
Initiate reaction by addition of 50 μL of PDE sample (cell or tussues extract or purified PDE). Total raction volume should be 250 μL. Vortex and incubate at 30°C for desired time (usually 5-10 min.).
To analyze calmoduli-dependent PDE1 activity use buffer C and buffer D to measure basal non-stimulated activity of PDE1.
Stop the reaction by placing the tube in a boiling water bath for 1 min. After allowing the tube to cool, add 10 μL of 2.5 mg/mL snake venom. Incubate for 5 min at 30°C.
Dilute the assay with 250 μL of Low Salt buffer and transfer the entire sample to an ion exchange resin column, which has been previously washed with 8 mL High Salt buffer followed by 8 mL Low Salt buffer. The packed volume of the exchange resin is 0.6 mL.
Elute 3H-nucleoside from resin with 4 x 0.5 mL washes of Low Salt buffer, collecting eluates in a scintillation vial.
Add 3.0 mL scintillation fluid and mix thoroughly. Count on a liquid scintillation counter after allowing any luminesence to subside. Use an Excel program that can calculate a specific activity.
Specific Activity is calculated as moles cyclic nucleotides hydrolyzed per min-mL: (cpm – background cpm){(cGMP, moles)/net cpm per assay}(vol,mL)- 1(time,min)-1.
3.2. PDE assays using isothermal titration calorimetry
The VP-ITC MicroCalorimeter has two cells (1.42 mL each): one a reference that is filled with buffer and the other a measuring cell, containing the reaction mixture with enzyme (Fig. 2). The calorimeter measures the current, applied to each cell to maintain them at the same temperature. As the enzymatic hydrolysis proceeds heat is generated and there is less current applied to the measuring cell, the difference in the amount of current applied to the two cells is measured as differential power (current times heater resistance) (Fig. 3).
Fig. 2.
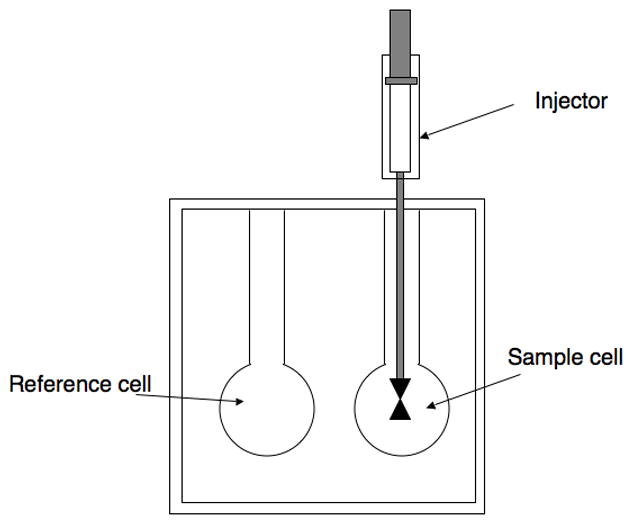
The VP-ITC unit. A spinning syringe is used for injections and mixing of rection componenets. Temperature differences between the reference cells and the sample cells are recorded and used for calculation of PDE activities.
Fig. 3.
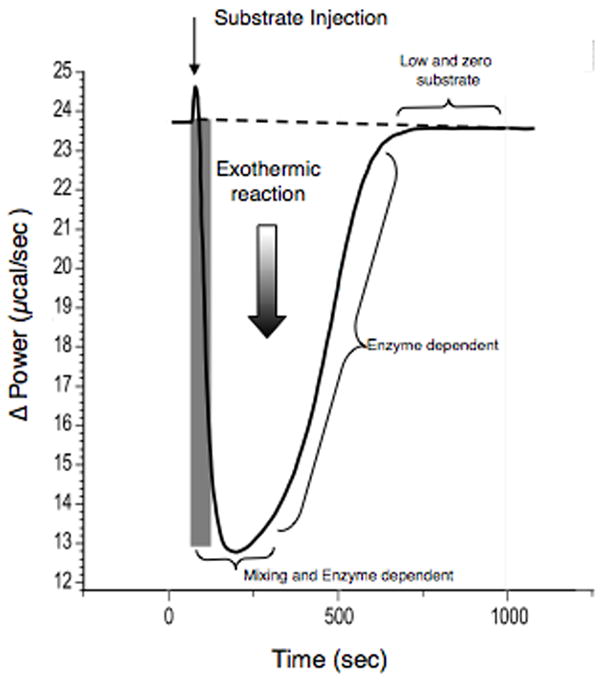
Typical thermograph of cyclic nucleotide hydrolysis. cGMP (3–20 μL) is injected after 60 sec of stable base line. Reaction cell contains 1.42 mL of PDE2 enzyme in 40 μM Mops, 1.0 mM MgCl2.
The initial downward phase is where the substrate is mixed into the reaction media while the enzyme is also hydrolyzing the substrate (Fig. 4). The next phase is where the uniformly mixed substrate is gettting enzymatically depleted while generating heat. The final phase is where the reaction is completed and the signal returns to the base line. The total area of heat production (μcal) is proportional to the total amount of substrate (μmol). The Origin™ software provided by the calorimeter manufacturer calculates the heat of hydrolysis and converts these values into substrate concentrations and rate of hydrolysis (Fig. 5).
Fig. 4.
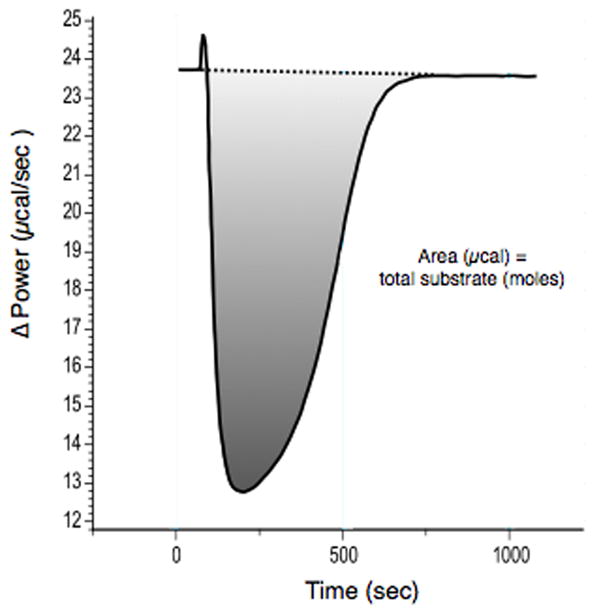
Determination of the amount of heat generated during the PDE reaction. Total area (minus the injection peak) is equal to the total amount of heat produced by the complete hydrolysis of cGMP. The conversion factor (calories per moles) is calculated from this plot as the molar heat of hydrolysis.
Fig. 5.
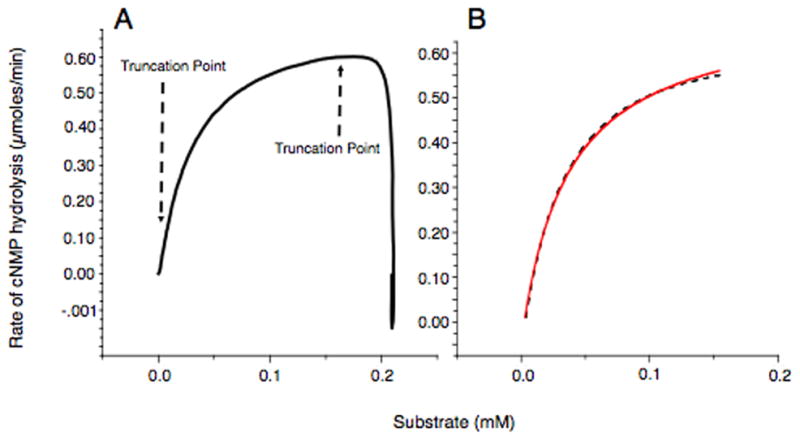
Calculation of PDE activity data from the ITC data. A) Replotting of data as hydrolysis rate vs. substrate by the calorimeter program. Very small and high end numbers are removed due to mixing artifacts. B) Determination of kinetic parameters of PDEs. The truncated data from Fig. 5A is non-linearly fit to the Michaelis-Menten equation: , where Km - the Michaelis-Menten constant), Vmax - the maximum enzyme activity, S – substrate concentration.
The dashed line corresponds to data obtained during measurements, the continuous line corresponds to fit curve. All reactions were done in triplicate or more.
3.2.1. PDE kinetic analysis (using PDE2 as a sample)
The calorimeter requires thermal stability at 30°C before injection of the substrate.
10 μL of cGMP at a concentration of 30 mM is injected into the reaction cell (1.42 mL) with continuous monitoring of heat production at 2-second intervals.
The injection syringe, used as a stirring device at 310 rpm, is able to efficiently mix the substrate (cGMP) with PDE samples (recombinant PDE2). The concentration of PDE2 in the 1.42 mL reaction cell is at 2 nM.
Total reaction times are usually within 15–40 minutes.
The tested compounds, such as cyclic nucleotide analogs at concentrations from 2 mM to 30 mM, are injected into the reaction cells when needed.
3.2.2 Calculation of PDE kinetic parameters obtained by ITC
Todd and Gomez described a method where the kinetic parameters, Km (the Michaelis-Menten constant), Kcat (the catalytic rate constant of an enzyme) and Vmax (the maximum enzyme activity) can be calculated from the data obtained from the ITC (14).
-
1
The Origin™ software calculates the kinetic parameters, Km and Kcat (Vmax), by converting the integrated signal (Fig. 4) to a plot of substrate concentration verses rate of substrate hydrolysis.
-
2
The plot is trimmed (truncated) manually at both ends to make it useable for curve fitting by the program, and a new data plot is displayed (Fig. 5A).
-
3
The resulting data are fit to the Michaelis-Menten equation; , where Vmax = Kcat/enzyme, expressed as μmole/min/mg enzyme. The goodness of fit presented in Figure 5B is typical of the data obtained by this method. If the fit is not good then the truncation points are changed and the fit is reestablished.
-
4
Identification of inhibition type and kinetic formula are obtained as described in Enzyme Kinetics Segel (15).
-
4.1
Km and Vmax values of inhibited reactions are compared to uninhibited Km and Vmax reactions. A two-tailed T test (P<0.05) is used to determine if the average values are different.
-
4.2
In case of using cyclic nucleotide analogs different types of kinetic reactions could be detected. For example, some analogues show no effect on the activity of the PDEs, while some can be inhibitors or substrates. In total comparing substrates and analogues on the same day and same enzyme preparation, three types of inhibition can be identified:
Competitive; if the Vmax is the same for inhibited and uninhibited reaction, but the Km for the inhibited reaction is greater than the Km for uninhibited reaction;
Non-competitive; if the inhibited Vmax is less than the uninhibited Vmax, but the Km is the same for both reactions;
Linear mixed; if the inhibited Vmax is less than the uninhibited Vmax, but the Km for the Inhibited reaction is greater than the Km for uninhibited reaction.
4. Notes
-
Notes for PDE assay (3.1)
-
1.1
The PDE assay has the advantage of being sufficiently sensitive to allow measurement of lower Km/Vmax PDEs even in crude homogenates without removal of phosphates and organic phosphate containing substances. It still has the disadvantage of being a fixed-time assay and therefore provides only an estimate of basic enzymatic rates, especially at lower substrate levels (ie below the Km). In practice, however, the assay is reasonably accurate as long as total hydrolysis is kept below about 30% even for basic kinetic analysis.
-
1.2
Substrate and Conditions for PDE isozymes are always determined by the type of PDE isoforms present in the tested tissue. For example: calmodulin/calcium dependence or dual cAMP and cGMP specificity would require different assay conditions (16).
-
1.3
In tissues with high concentrations of guanine deaminase, [3H]-xanthine can be produced from the [3H]-guanosine. [3H]-xanthine, in contrast to [3H]-guanosine, will bind to most ion-exchange columns at neutral pH, thus potentially contributing to an underestimation of cGMP PDE activities. However, at pH 6.8 [3H]-xanthine does not bind to the DEAE columns described below.
-
1.4
The columns for PDE assay can be regenerated many times by washing two times with High Salt buffer and then 2 times with Low Salt buffer.
-
1.5
The procedures for PDE assay can be adjusted to a 125 μL total volume assay by cutting all volumes in half.
-
1.1
-
Notes for the ITC PDE assay (3.2)
-
2. 1
The substrate concentration of cAMP, cGMP or cyclic nucleotide analogs in the injection syringe is adjusted to be about 1000 to 2000 times the Km of the PDE and the volumes can be between 3 μL – 20 μL.
-
2.2
Purified recombinant PDEs are diluted in 40 mM MOPS pH 7.5 (concentrations: ~0.1–10 nM). Injecting 10 μL of cyclic nucleotides or their analogs into the reaction cell (1.42 mL) gives a final concentration of between 14 to 28 μM; about 7 to 14 times above the Km for PDE2. Volumes and concentrations are adjusted appropriately for other PDEs.
-
2.3
The heat generation is measured for about 15–20 minutes. The analysis takes about 5 min, so the total time to run one complete experiment is about 45 min. In practical terms about one experiment per hour is typical. In a day one can easily determine in triplicate the Km, Kcat and Ki for one analog.
-
2.4
Application of ITC for analysis of hydrolysis of cyclic nucleotide analogs by PDEs.
-
2. 1
Previously we reported kinetic parameters for several PDEs, obtained by the ITC method in comparison with published kinetic data for the same PDEs, measured by tradional PDE assays (11). That data showed that many of the cyclic nucleotide analogs could act as PDE inhibitors and several were substrates, depending on the types of PDEs expressed in a paricular cell or tissue. Here we provide a somewhat expanded version of those tables by adding new data for PDE8 and PDE9 (Table I and Table II). Please note however, that Km values for PDE8 appeared to be higher −0.63 μM than was published by other methods. Although it is not clear why this apparent descrepancy exists, it is possible that at the higher enzyme and substrate concentrations, needed for the ITC measurement, a lower affinity form of PDE8 could be formed. Also this method is inherently more accurate for higher Km PDEs.
Table I.
Kinetic parameters of selected PDEs measured by the ITC.
| cGMP | cAMP | |||
|---|---|---|---|---|
| Enzyme | Km | Vmax | Km | Vmax |
| PDE1A | 8.2 +/− 1.0 | 20 +/− 1.0 | 93 +/− 12 | 41 +/− 4.0 |
| PDE1B | 5.4 +/− 2.7 | 2.6 +/− 0.7 | 33 +/− 3.8 | 1.5 +/− 0.5 |
| PDE1C | 4.6 +/− 0.1 | 1.4 +/− 1.0 | 3.2 +/− 0.1 | 16 +/− 0.3 |
| PDE2A | 31 +/− 3.2 | 176 +/− 31 | 112 +/− 33 | 215 +/− 37 |
| PDE4D | n.h. | n.h. | 5.5 +/− 0.4 | 63 +/− 8.0 |
| PDE5 | 2.0 +/− 0.5 | 6. +/− 1.0 | 201 +/− 17 | 20 +/− 2.9 |
| PDE6 | 10 +/− 1.0 | 1.0 +/− 1.1 | 823 +/− 54 | 1.6 +/− 0.1 |
| PDE8A | n.h. | n.h. | 0.6 +/− 0.2 | 43 +/− 13 |
| PDE9A | 0.2 +/− 0.02 | 1.0 +/− 1.1 | 230 +/− 35 | 21 +/− 10 |
| PDE10 | 1.1 +/− 0.03 | 1.6 +/− 0.11 | 0.2 +/− 0.04 | 0.67 +/− 0.01 |
Data for PDEs1-5 and PDE10 taken from Poppe et al (11) (Km, μM; Vmax, μM/min/mg, n.h. = not hydrolyzed).
For PDE6 and PDE9, Vmax data, measured with cGMP as substrates, are normalized to 1.
Table II.
Properies of cyclic nucleotide analogs as PDE substrates and inhibitors by isotermal microcalorimetry. Km data for cyclic nucleotides analogs, that can be PDE substrates, are in shaded cells, while ones, that can inhibit PDEs are in non-shaded cells and presented as Ki.
| Analog | PDE1A | PDE1B | PDE1C | PDE2 | PDE4 | PDE5 | PDE6 | PDE8A | PDE9 | PDE10 |
|---|---|---|---|---|---|---|---|---|---|---|
| Km /Ki | Km /Ki | Km /Ki | Km /Ki | Km /Ki | Km /Ki | Km /Ki | Km /Ki | Km /Ki | Km /Ki | |
| cAMP | 93.1 | 33.0 | 3.19 | 112 | 5.52 | 201 | 823 | 0.63 | 230 | 0.24 |
| 8Br-cAMP | 32.8 | 63.6 | 18.0 | 38.7 | 54.4 | 23.4 | 68.8 | n.e. | 5.99 | 4.83 |
| cGMP | 8.23 | 5.35 | 4.64 | 31.0 | 24.5 | 2.01 | 10 | n.e. | 0.20 | 23.7 |
| 8-Br-cGMP | 47.2 | 4.48 | 62.8 | 90.9 | 30.1 | 79.2 | 33 | 0.55 | 0.77 | 23.7 |
| Sp-5,6-DCl-cBMPS | 89.6 | 2.25 | 55.8 | 17.7 | 18.8 | 15.1 | 24.5 | 26.7 | n.e. | 4.75 |
| 6-Bnz-cAMP | n.e. | 9.86 | 323 | 240 | 49 | 68.9 | 64.6 | n.e. | 2.27 | 45.6 |
| 8-pCPT-2-0-Me cAMP | 50.5 | 8.57 | 44.2 | 14.5 | 895 | 3.12 | 3.51 | 4.01 | n.d. | 5.84 |
| Sp-8-pCPT-2-0-Me- cAMPS | 0.38 | 2.02 | 17.2 | n.d. | 0.82 | 0.4 | 1.05 | 3.08 | n.d. | 2.42 |
| Rp-8-Br-cAMPS | n.e. | 5.57 | 37.7 | 23.3 | 28.7 | 94.7 | 106 | n.e. | n.d. | 28.1 |
| 8-pCPT-cGMP | 16.7 | 8.62 | 47.1 | 40 | 53.4 | 27.6 | 41.3 | 77.7 | 1.29 | 6.04 |
| 8-Br-Pet-cGMP | 2.4 | 2.13 | 73.1 | 98.6 | 8.84 | 5.29 | 11.2 | n.e. | n.d. | 34.4 |
| Rp-pCPT-cGMPS | 42.4 | 2.1 | 32.6 | 52.9 | 137 | 49.7 | 26 | 7.64 | n.d. | 38.6 |
| Rp-8-Br-Pet-cGMPS | n.e. | 2.5 | 55.6 | 0.76 | 8.1 | 4.09 | 13.8 | n.e. | 2.28 | 4.98 |
Table II shows the selectivity and cross-reactivity of cyclic nuleotide analogs determined by the ITC method. Interestingly, 8-Br-cGMP can be a substrate for PDE8A with a Km as low as 0.55 μM. For PDE9, 8-Br-cAMP is a reasonable substrate (Km =5.99 μM), while 8-Br-cGMP and 8-pCPT-cGMP are potentially effective inhibitors in the cell (Ki=0.77 μM and 1.29 μM respectively).
Therefore the data obtained by the ITC, underline the importance of careful analysis of all cyclic nucleotide analogs used as probes of cAMP or cGMP siganling pathways, since these analogs could have multiple targets in different types of cells. For example the Epac selective activator, Sp-8-pCPT-2-0-Me- cAMPS, while not a substrate for any PDE is quite a good inhibitor of several of them. Similarly the slighely less effective Epac inhibitor, 8-pCPT-2-0-Me cAMP is a rather good substrate for PDE5.
Acknowledgments
This work was supported by grants GM083926 and AR056221.
References
- 1.Beavo JA, Brunton LL. Nat Rev Mol Cell Biol. 2002;3:710–8. doi: 10.1038/nrm911. [DOI] [PubMed] [Google Scholar]
- 2.Hofmann F, Bernhard D, Lukowski R, Weinmeister P. Handb Exp Pharmacol. 2009:137–62. doi: 10.1007/978-3-540-68964-5_8. [DOI] [PubMed] [Google Scholar]
- 3.Bender AT, Beavo JA. Pharmacol Rev. 2006;58:488–520. doi: 10.1124/pr.58.3.5. [DOI] [PubMed] [Google Scholar]
- 4.Gillespie PG, Beavo JA. Mol Pharmacol. 1989;36:773–81. [PubMed] [Google Scholar]
- 5.Beavo JA, Hardman JG, Sutherland EW. J Biol Chem. 1970;245:5649–55. [PubMed] [Google Scholar]
- 6.Thompson WJ, Appleman MM. J Biol Chem. 1971;246:3145–50. [PubMed] [Google Scholar]
- 7.Yee R, Liebman PA. J Biol Chem. 1978;253:8902–9. [PubMed] [Google Scholar]
- 8.Promega. Technical Bulletin. 2011. [Google Scholar]
- 9.PerkinElmer. PerkinElmer Life Sciences Publication. 2010. [Google Scholar]
- 10.Greengard P, Rudolph SA, Sturtevant JM. J Biol Chem. 1969;244:4798–800. [PubMed] [Google Scholar]
- 11.Poppe H, Rybalkin SD, Rehmann H, Hinds TR, Tang XB, Christensen AE, Schwede F, Genieser HG, Bos JL, Doskeland SO, Beavo JA, Butt E. Nat Methods. 2008;5:277–8. doi: 10.1038/nmeth0408-277. [DOI] [PubMed] [Google Scholar]
- 12.Beavo JA, Hardman JG, Sutherland EW. J Biol Chem. 1971;246:3841–6. [PubMed] [Google Scholar]
- 13.Martins TJ, Mumby MC, Beavo JA. J Biol Chem. 1982;257:1973–9. [PubMed] [Google Scholar]
- 14.Todd MJ, Gomez J. Anal Biochem. 2001;296:179–87. doi: 10.1006/abio.2001.5218. [DOI] [PubMed] [Google Scholar]
- 15.Segel IH. New York: John Wiley&Sons; 1975. [Google Scholar]
- 16.Sonnenburg WK, Rybalkin SD, Bornfeldt KE, Kwak KS, Rybalkina IG, Beavo JA. Methods. 1998;14:3–19. doi: 10.1006/meth.1997.0561. [DOI] [PubMed] [Google Scholar]


