

Abstract
Photon counting x-ray detectors (PCXDs) offer several advantages compared to standard, energy-integrating x-ray detectors but also face significant challenges. One key challenge is the high count rates required in CT. At high count rates, PCXDs exhibit count rate loss and show reduced detective quantum efficiency in signal-rich (or high flux) measurements. In order to reduce count rate requirements, a dynamic beam-shaping filter can be used to redistribute flux incident on the patient. We study the piecewise-linear attenuator in conjunction with PCXDs without energy discrimination capabilities. We examined three detector models: the classic nonparalyzable and paralyzable detector models, and a “hybrid” detector model which is a weighted average of the two which approximates an existing, real detector (Taguchi et al, Med Phys 2011). We derive analytic expressions for the variance of the CT measurements for these detectors. These expressions are used with raw data estimated from DICOM image files of an abdomen and a thorax to estimate variance in reconstructed images for both the dynamic attenuator and a static beam-shaping (“bowtie”) filter. By redistributing flux, the dynamic attenuator reduces dose by 40% without increasing peak variance for the ideal detector. For non-ideal PCXDs, the impact of count rate loss is also reduced. The nonparalyzable detector shows little impact from count rate loss, but with the paralyzable model, count rate loss leads to noise streaks that can be controlled with the dynamic attenuator. With the hybrid model, the characteristic count rates required before noise streaks dominate the reconstruction are reduced by a factor of two to three. We conclude that the piecewise-linear attenuator can reduce the count rate requirements of the PCXD in addition to improving dose efficiency. The magnitude of this reduction depends on the detector, with paralyzable detectors showing much greater benefit than nonparalyzable detectors.
Keywords: photon counting detectors, dynamic bowtie, dose reduction
Introduction
Photon counting x-ray detectors (PCXDs) have been proposed for use in CT imaging. PCXDs offer several advantages over traditional detectors, including intrinsic energy discrimination capabilities, material specific imaging (including methods exploiting K-edges), high spatial resolution, reduced sensitivity to electronic noise, and improved dose efficiency (Tapiovaara and Wagner 1985, Roessl and Proksa 2007).
Other imaging modalities, especially radionuclide imaging such as PET, have used photon counting detectors successfully for decades. The key challenge in CT is the high level of flux. The incident flux of an unattenuated beam on the detector can be over 109 s-1 mm-2, several orders of magnitude greater than in PET imaging. Photon counting detectors in CT face unique challenges and require a design substantially different from PET detectors. Note that in this work, we define incident flux as the rate of quanta per unit area incident on the detector, not the patient. PCXDs are usually parameterized with a characteristic count rate. When the incident flux approaches or exceeds the characteristic count rate, detector performance suffers. In CT imaging, the relevant figure of merit is the characteristic count rate per unit area of the detector. For brevity, we will simply refer to this as “characteristic count rate.” At the time of this writing, many PCXDs have characteristic count rates between 106 and 107 s-1 mm-2 (Barber et al 2009), although certain new architectures have reported much higher count rates (Xu et al 2011, Bornefalk and Danielsson 2010). When multiple photons arrive in close temporal and spatial proximity, their energies may be read out together and mistakenly interpreted as a single photon with higher energy, resulting in spectral distortion (“pulse pile-up”). This degrades energy resolution and damages quantum statistics because some photons are effectively uncounted (“count rate loss”). Another type of spectral distortion occurs when the charge from a single photon is distributed over multiple counters and double-counted with the wrong energy. It is possible to engineer mechanisms to compensate for this charge sharing, but the requirement for high speed hinders these efforts (Ballabriga et al 2006, Koenig et al 2013, Gimenez et al 2011). The high incident flux in CT imaging presents challenges for PCXD design and lead to compromises with spectral resolution, quantum efficiency, and charge sharing compensation.
For PCXDs to be superior to their energy-integrating counterparts, it has been estimated that the characteristic count rate must be five times greater than the incident flux (Wang et al 2011). However, this rule of thumb holds only for single ray measurements. In reconstructed images, this condition could be safely violated in many rays because rays with high incident flux have more quanta, and a variance penalty in these signal-rich rays could be well tolerated. Indeed, it could have only a minor effect on the image variance. If a counterbalancing noise advantage is present in a minority of photon-starved rays, as could be the case if electronic noise is eliminated, PCXDs may still be attractive.
A variety of solutions have been proposed for the count rate problem of PCXDs in CT (Taguchi et al 2009). The beam-shaping or “bowtie” filter has been used for decades and reduces the incident flux where patient attenuation is typically smallest (Hsieh 2003). However, the bowtie filter is not tuned to specific patients and pulse pile-up and count rate loss persist near the edge of the patient. Interior reconstruction methods could eliminate the dependence of the algorithm on data with significant count rate loss (Kudo et al 2008) but these non-linear reconstruction algorithms have some drawbacks and have faced obstacles to translation (Pan et al 2009). Even if a mature interior reconstruction method were available, objects of clinical interest may be present in regions sampled by rays corrupted by count rate loss, especially in the lungs in thorax studies. Software compensation methods can and should be used to correct for deterministic errors, but the stochastic loss of quantum statistics cannot be undone by compensation methods.
Recently, we described a dynamic beam-shaping filter which is capable of producing a time-varying piecewise-linear attenuation thickness (Hsieh and Pelc 2013b). A similar filter producing a piecewise-constant thickness has also been proposed and experimentally demonstrated (Szczykutowicz and Mistretta 2013b, Szczykutowicz and Mistretta 2013a, Szczykutowicz and Mistretta 2012). These attenuators modulate the intensity reaching the detector and can minimize the peak incident flux on the detector. Flux can be redistributed from these signal-rich measurements into signal-poor measurements, with advantages in dose and noise objectives (Hsieh and Pelc 2013a). Other dynamic attenuators have been proposed which are mechanically simpler but which provide less control over flux (Arenson et al , Toth et al 2009).
Previous work has shown that the piecewise-linear attenuator can reduce the dynamic range of the scan, which suggests that the attenuator could be used to reduce spectral distortion in PCXDs (Hsieh and Pelc 2013b). However, a reduction in dynamic range does not translate directly into an increase in image quality. The goal of this study was to compare the image quality of systems using a PCXD and either the dynamic attenuator or a reference bowtie filter.
We restrict ourselves to the effect of PCXD count rate losses and do not study the effect on spectral distortion. This is equivalent to assuming that the PCXD is not using energy discrimination. Studying spectral effects is an important future goal. We further assume that the deterministic errors of the PCXD are well understood and corrected, and that the only non-ideality is the loss of quantum statistics arising from count rate loss.
Methods
Dynamic Attenuator
The details of the piecewise-linear dynamic attenuator has been previously reported and the reader is directed to Reference (Hsieh and Pelc 2013b) for details. We provide here only a concise overview.
The piecewise-linear dynamic attenuator comprises a series of wedges with triangular cross-sections. Each wedge is driven by a linear actuator along the axis of the scanner to change the triangular cross-section of the wedge seen by the x-ray beam. The wedges are machined and positioned such that for the kth wedge, the thickness t introduced into the fan-beam is
| (1) |
where Δ(x) is the triangle function, θw is related to the base of the wedge, θk is the position of the wedge relative to the iso-ray, and zk is the location of the linear actuator attached to the wedge, which may be constrained to 0 < zk < zmax. More or less pre-patient attenuation can be introduced by changing zk. In order to produce this thickness function, the wedge must be precisely machined so that each cross-section is a triangle of attenuating material with varying height (that is, thickness in the source-detector direction) along its length.
The wedges are arranged such that , so that the combined shadow of the wedges on the detector forms a piecewise-linear function. Figure 1 shows the dynamic attenuator. A cross section is also shown. Each wedge has nonuniform thickness, being thicker at the apex than at the edges, in order to produce the desired triangular shape. Two layers of wedges are used, with one layer offset by half the triangular base from the other. When the wedges are positioned at the same height, with zk being equal, the resulting attenuation profile is uniform even though the individual wedges are nonuniform. Adjusting the location of the individual wedges allows the dynamic attenuator to take on a smooth, piecewise-linear shape to, for example, conform to the patient shape.
Figure 1.
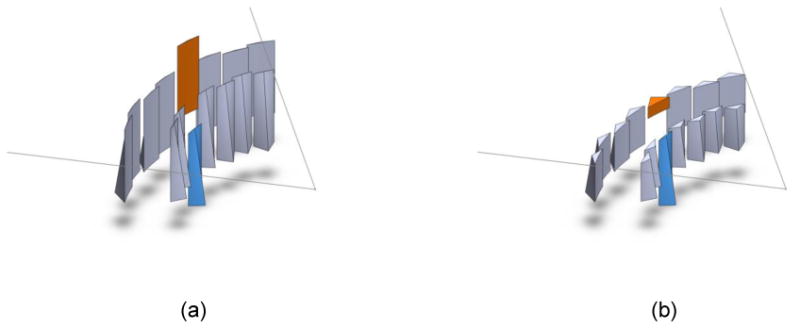
The piecewise-linear dynamic attenuator consists of a series of wedges attached to actuators (actuators not shown). The outline of the fan beam is also shown, with the x-ray focal spot (not shown) at the apex of the fan. (a) The set of wedges. Two of the wedges have been shaded and translated. During the scan, all wedges are dynamically translated. For simplicity, only two wedges are translated here (b) A cross-section of the wedges, showing the triangular cross-sections in the plane of the fan beam. The wedge which was translated downwards introduces only a small amount of attenuation, while the wedge that was translated upwards has more attenuation. Reprinted with permission from (Hsieh and Pelc 2013).
Functionally, the wedges and actuators provide a time-varying, piecewise-linear thickness function. We assumed that we had direct access to the idealized thickness function and 15 wedges equally distributed across the fan beam.
To be compact, the attenuator material must be carefully chosen. We assumed that the wedges are made of iron (Szczykutowicz and Mistretta 2013b) for our simulation of polychromatic effects. Preliminary simulations have suggested that the resulting beam hardening artifacts can be corrected (Hsieh and Pelc 2013b), especially with the use of a two-pass algorithm (Joseph and Spital 1978). While we model the piecewise linear attenuator here, we anticipate that a piecewise-constant attenuator (Szczykutowicz and Mistretta 2013b, Szczykutowicz and Mistretta 2013a) or inverse-geometry CT (Schmidt et al 2004, De Man et al 2007) would behave similarly with PCXDs. Some of the insights from this study could also be informative for other proposed dynamic attenuators (Arenson et al , Toth et al 2009), which have coarser control over the flux profile.
Detector and Noise Model
The most common models for PCXD behavior as a function of incident flux are the nonparalyzable and paralyzable models (Knoll 2010). Both assume a dead time τ, with the characteristic count rate defined as 1/τ. In the nonparalyzable model, the detector enters the dead time whenever a photon arrives and is counted. During the dead time τ, the detector ignores any arriving photons, and after this time the detector becomes sensitive again. In the paralyzable model, the detector enters the dead time whenever a photon arrives, even if it is not counted. Successive events restart the dead time. Therefore, a photon is counted in the paralyzable model if and only if no photons have arrived over the past period of time τ. The reader is directed towards (Knoll 2010) for further details.
Let λ be the incident flux (the inverse of the mean time between arrival of photons). Then, λτ is the ratio of the incident flux to the characteristic count rate, or the incident flux in units of the characteristic count rate. For a measurement time t » τ, Yu and Fessler have derived that the mean and variance of the number of recorded counts for the nonparalyzable detector NNP is (Yu and Fessler 2000)
| (2) |
However, in CT, the quantity of interest is not the number of counts but the measurement of the line integral Y, which is given by , with λ0 being the incident flux in the air scan. We assume λ0 is known perfectly. The variance of Y can be calculated using propagation of error as
| (3) |
where N is the number of recorded counts.
For the nonparalyzable case, we can manipulate the above expressions to show that
| (4) |
Note that the ideal detector simply counts all quanta and follows (Hsieh 2003)
| (5) |
Figure 2 shows plots of E[N]NP,Var[N]NP and Var[Y]NP versus λτ. For small λτ all detector models behave similarly to the ideal detector. At large λτ the nonparalyzable detector model shows the least departure from the ideal detector. This detector suffers from a variance penalty factor of (1 + λτ) but the total variance is nonetheless monotonically decreasing as the incident flux increases.
Figure 2.
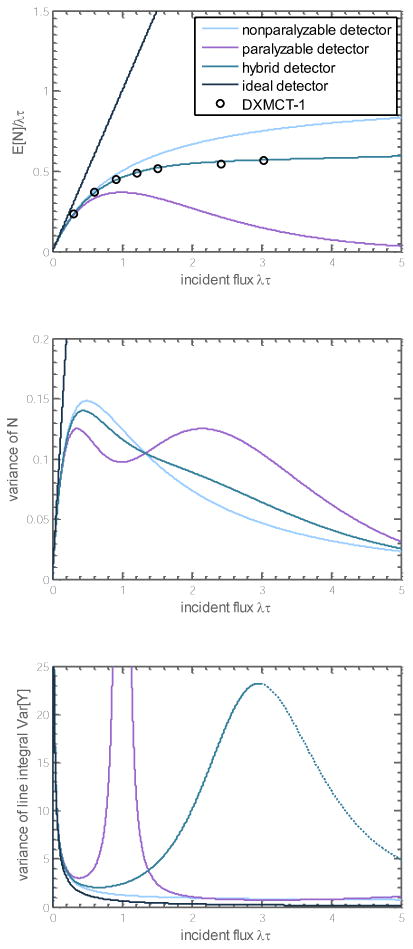
(Top) Mean recorded counts as a function of incident flux for several classes of detectors. The hybrid detector studied is a weighted average with α = 70% nonparalyzable and (1 − α) = 30% paralyzable components, with the same characteristic count rate. It matches well with experimental data from the DXMCT-1 detector, estimated from (Taguchi et al 2011). (Middle) Variance of the recorded counts. The hybrid detector is a weighted average of the nonparalyzable and paralyzable detectors. (Bottom) Variance of the line integral measurement, used in CT reconstruction. The dotted section for the hybrid detector shows a decrease in variance for λτ > 3, which may not be physical. This also corresponds to a region of the data that is not experimentally verified against the DXMCT-1.
For the paralyzable detector with recorded counts NP, we have for t » τ that (Yu and Fessler 2000)
| (6) |
To calculate Var[Y]P, we use
| (7) |
Using Equation (3), it can then be shown that
| (8) |
Note that the variance has a singularity at λ = 1/τ. This can be physically interpreted to occur at the stationary point (or flattening out) of E[N]P at the characteristic count rate λτ = 1, which can be seen in Figure 2. Near λτ = 1, small changes in NP from noise yield extremely large changes in the inferred YP, or physically, small changes in the object have no effect on the expected count rate. Figure 2 shows that after this singularity at λτ = 1, the variance decreases. If the sinogram has some data with λτ > 1 and some data with λτ < 1, continuity of data suggests that some measurements will have λτ ≅ 1 and the noise in these measurements will render them unusable.
Real detectors do not behave exactly like the paralyzable or nonparalyzable models. Rather, as shown in (Taguchi et al 2011), they lie somewhere between the nonparalyzable and paralyzable models. We consider a hybrid model, which is a weighted average of the two models, each with the same characteristic count rate. Specifically, we assume
| (9) |
Note that to calculate the variance the weights are not squared, as would be the case for propagation of uncertainty with independent sources of variance. If the weights were squared, the variance of the hybrid detector would be lower at some points than both the paralyzable and nonparalyzable detector, which is nonphysical. Substitution yields:
| (10) |
This is an ad hoc model chosen for mathematical convenience, but a useful one because of its simplicity. We found that α = 70% corresponds fairly well to the E[N] response curve reported in (Taguchi et al 2011) for the DXMCT-1 detector (DxRay, Inc., Northridge, CA) for λτ ≤ 3. The behavior of this hybrid model is shown in Figure 2. Experimental data is not available to us for λτ > 3, and in particular, the decrease in Var[Y]hybrid for λτ > 3 shown in Figure 2 is counter-intuitive and may be nonphysical. As we explain later, the dynamic attenuator is controlled so that λτ ≤ 1.67 for the hybrid model, so the behavior at high incident flux is irrelevant for the dynamic attenuator. The reference system in our study (described below) sometimes operates at λτ > 3. Therefore, the noise in the reference system could be underestimated by our prediction of the noise decreasing for λτ > 3.
The behavior of Var[Y] is controlled primarily by variation in the slope . The decrease in this slope drives the explosive growth in the variance of line integral measurements, Var[Y]hybrid, for large values of incident flux.
A calibration is necessary to mitigate beam hardening which will arise in PCXDs without energy discriminating capabilities. We used a second-order polynomial to correct for beam hardening effects. The corrected line integral measurement is modeled as
| (11) |
The coefficients ck are determined by a least squares fit to the data from simulations of the passage of photons through water objects of many different lengths. For the dynamic attenuator, ck are functions of the thickness of iron attenuator inserted into the ray. For the reference bowtie filter, we assume that the bowtie is composed of a water-like material, and the bowtie path-length for each ray is accounted for.
This beam hardening calibration affects the variance of the measurements. Following propagation of error, the variance of the beam hardening corrected line integral is
| (12) |
Simulations
We generated simulated raw data for scans of two thoracic cross-sections and one abdominal cross-section using forward projection from DICOM image files. Figure 3 shows the datasets used in the study. The second, thinner thorax is only used once (in Figure 6) as an example of an object which presents little attenuation. We consider only single-slice imaging. Each voxel was decomposed into linear combinations of air and water or water and cortical bone prior to forward projection, following a method reported in previous work (Hsieh and Pelc 2013b). A 120 kVp polychromatic spectrum, discretized at 10 keV intervals, was generated using the tungsten anode spectral model using interpolating polynomials (TASMIP) (Boone and Seibert 1997, Siewerdsen et al 2004). The source-isocenter distance was 54.1 cm, and the detector-isocenter distance was 40.8 cm.
Figure 3.
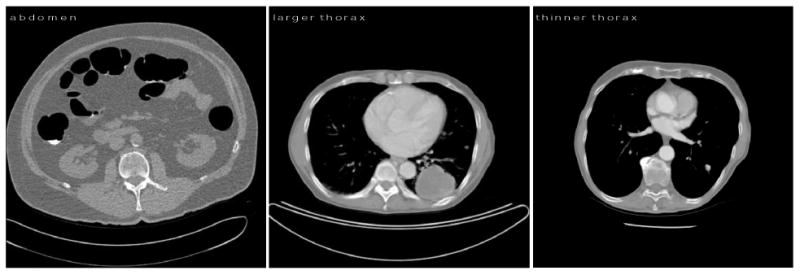
Datasets used in this study. The abdomen cross-section is approximately 39 cm along its major axis and 31 cm along its minor axis. The first, larger thorax cross-section is 32 cm by 22 cm, and the second, thinner thorax cross-section is roughly circular with a 25 cm diameter. The thinner thorax has less mass in this cross-section and is less attenuating than the larger thorax, and much less attenuating than the abdomen. It is only used in Figure 6 to demonstrate the effect of TCM.
Figure 6.
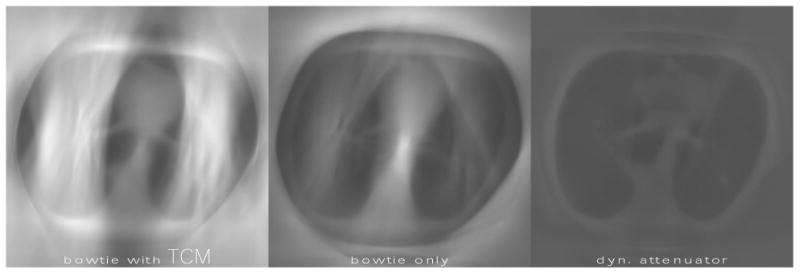
The effect of tube current modulation (TCM) on the variance maps with count rate loss. Brighter regions correspond to larger variance. The method for choosing TCM followed that of (Gies et al 1999). The three systems deliver equal dose, with the average mA for the conventional bowtie systems being approximately 35 mA. This low dose is necessary to accommodate the slow characteristic count rate and minimal attenuation presented by the object. All images assumed a hybrid PCXD with count rate 5 * 106 s-1 mm-2. TCM decreases noise in the mediastinum, but increases noise in the lung field because of count rate loss. The dynamic attenuator outperforms both systems, with a peak variance 50% less than the bowtie only system. The peak variance for the bowtie with TCM system is 14% greater than the bowtie only system.
We assume that in the absence of the patient and the pre-patient attenuator, the incident flux is isotropic and proportional to the tube current, and we estimated this constant of proportionality to be 2.4 * 106 s-1 mm-2 mA-1, although we recognize that in practice this constant will depend on the system geometry, tube efficiency and other factors. We do not model an anti-scatter grid, which would reduce the flux reaching the detector.
To estimate the variance of the reconstructed images, we used unfiltered backprojection of the variance of the sinogram (Chesler et al 1977). This backprojection was done without fan beam weighting, which is an empirically good model for the rebin-to-parallel processing which is still used today (Tang et al 2006, Tang et al 2005).
As a surrogate for the dose of the scan, we used entrance energy, or the total energy incident on the patient across all views. More sophisticated Monte Carlo models have been used to study dose reduction with the dynamic attenuator (Hsieh and Pelc 2013a, Agostinelli et al 2003), but we feel that entrance energy is sufficient for the present comparison. The effect on our comparison, if any, is likely in favor of the reference system since it tends to have a softer spectrum. For convenience, in this paper we have used the term “dose” as shorthand for relative entrance energy.
Attenuator Control
We assumed the reference system has a static bowtie which does not vary from patient to patient. The shape of this filter is identical to the one used in our previous work (Hsieh and Pelc 2013b). We assumed that the reference bowtie was composed of water equivalent material. Real bowtie filters use other materials, but the effective atomic number of most real bowties is comparable to that of water in order to reduce beam hardening artifacts. In addition to the reference bowtie, conventional scanners frequently use tube current modulation (TCM), also called mA modulation, to further improve dose efficiency (Gies et al 1999, Kalender et al 1999). One published approach for TCM is to adjust the source intensity with the square root of the attenuation (measured as the ratio I0/I, with larger values signifying greater attenuation) of the central ray (Gies et al 1999). Under certain assumptions, this minimizes the variance of the center pixel for a given dose limit. These assumptions do not hold when considering a PCXD with count rate loss. We simulated both square-root TCM and constant tube current, but neither choice is optimal with count rate loss.
The dynamic attenuator was controlled to approximately equalize the detected flux. The detector was divided into 15 segments, one for each wedge, and within each segment, the average attenuation (I0/I) without the dynamic attenuator was calculated. Within each view, the segment with the largest average attenuation was assigned a minimum thickness of 0.5 mm (Hsieh and Pelc 2013b). The minimum thickness and the attenuation from the object of this segment define the target attenuation for that view. The thicknesses of the other wedges in that view were chosen to match the target attenuation. Thus, within any view, the average attenuation for each segment is equalized. Across different views, the TCM was determined up to a constant by requiring that all views have the same incident flux.
Certain segments, especially near the edge of the patient, have a large range in incident flux. For this reason, when the variance of any ray Var[Y] was more than 10 times that of the ideal detector even after the approximate equalization of flux, additional attenuation was added until the variance penalty for those rays was less than 10. For the paralyzable detector, this incident flux threshold was λτ = 0.80. For the hybrid detector, the incident flux threshold was λτ = 1.67. Extra attenuation was not necessary for the nonparalyzable detector.
This approximate equalization of detected flux is not optimal. Optimal control of the attenuator is a nontrivial problem and depends on patient anatomy, and is also more complicated if the actuators are limited by finite speeds (Hsieh and Pelc 2013a). However, this approximate equalization is simple and could be implemented using real-time feedback, using data from a previous view to inform attenuator control in the current view. An alternative solution is to use a low-dose pre-scan to pre-calculate the trajectory of the wedges. This would allow the wedge path to be optimized and eliminate the requirements of real-time feedback, at the cost of adding a step to the patient workflow and increasing the dose by a small amount.
Results
We conducted two studies to understand the effect of the dynamic attenuator with the PCXD. In the first study, we varied the PCXD model: ideal, nonparalyzable, paralyzable, and hybrid. In the second study, we used only the hybrid detector model, but varied the detector count rate. In all cases, we used a reference system (conventional bowtie filter instead of dynamic attenuator) both with square-root TCM and also without any TCM (i.e. constant tube power). The reference system is compared to the system with a dynamic attenuator.
In the first study, which examined the effect of the detector model, the characteristic count rate for all detectors is 5 * 106 s-1 mm-2. The average tube output for the reference system with bowtie filter and mA modulation is 150 mA in the thorax and 500 mA for the abdomen. While the tube current is much lower for the thorax, the attenuation is also much reduced and the peak variance (variance of the noisiest pixel) in the thorax is less than that of the abdomen for the same gantry rotation time. The tube output for the two other systems (reference system without mA modulation, dynamic attenuator system) is scaled such that in each dataset, all systems reach the same peak variance with the ideal detector. For the reference system without TCM, this corresponds to 128 mA in the thorax and 522 mA in the abdomen.
In the second study, we varied the characteristic count rate from 2 * 106 to 15 * 106 s-1 mm-2 and assumed the hybrid model. Characteristic count rates of existing detectors range significantly depending on technology and application. For example, detectors designed for low energy imaging can more easily increase the density of pixels and the corresponding count rate per unit area. Other detectors have a fast counting rate but a slower frame rate and are not suited to CT imaging. (Taguchi and Iwanczyk 2013) discusses these trade-offs, and Table 1 of that paper in particular compares count rates of several detector models, which range from about 3 * 106 s-1 mm-2 for the Medipix3 in spectroscopic mode with charge sharing compensation (Ballabriga et al 2006), to 600 * 106 s-1 mm-2 for layered silicon strip detectors (Bornefalk and Danielsson 2010), which make other design compromises to achieve their counting performance. The DXMCT-1 is one of the most mature PCXD detectors intended specifically for CT imaging, having already been incorporated into a prototype system (Taguchi et al 2011), and counts at 5.5 * 106 s-1 mm-2.
Table 1.
Mean, peak variance, and dose for the images in Figure 5. The variance and dose are defined relative to the peak variance and dose for the abdomen scan with bowtie only. All non-ideal detectors operate at 5 * 106 s-1 mm-2. ∞ denotes analytically infinite variance, which occurs at the variance singularity in the paralyzable detector model.
| Dataset | Fluence Control | PCXD Model | Relative Mean Variance | Relative Peak Variance | Relative Dose |
|---|---|---|---|---|---|
| Thorax | Bowtie + TCM | Ideal | 26% | 79% | 29% |
| Thorax | Bowtie Only | Ideal | 28% | 79% | 24% |
| Thorax | Dynamic | Ideal | 62% | 79% | 14% |
| Thorax | Bowtie + TCM | Nonparalyzable | 37% | 91% | 29% |
| Thorax | Bowtie Only | Nonparalyzable | 40% | 92% | 24% |
| Thorax | Dynamic | Nonparalyzable | 76% | 94% | 14% |
| Thorax | Bowtie + TCM | Paralyzable | ∞ | ∞ | 29% |
| Thorax | Bowtie Only | Paralyzable | ∞ | ∞ | 24% |
| Thorax | Dynamic | Paralyzable | 87% | 104% | 14% |
| Thorax | Bowtie + TCM | Hybrid | 129% | 239% | 29% |
| Thorax | Bowtie Only | Hybrid | 124% | 256% | 24% |
| Thorax | Dynamic | Hybrid | 79% | 95% | 14% |
| Abdomen | Bowtie + TCM | Ideal | 47% | 100% | 96% |
| Abdomen | Bowtie Only | Ideal | 46% | 100% | 100% |
| Abdomen | Dynamic | Ideal | 83% | 100% | 61% |
| Abdomen | Bowtie + TCM | Nonparalyzable | 60% | 113% | 96% |
| Abdomen | Bowtie Only | Nonparalyzable | 58% | 113% | 100% |
| Abdomen | Dynamic | Nonparalyzable | 97% | 114% | 61% |
| Abdomen | Bowtie + TCM | Paralyzable | ∞ | ∞ | 100% |
| Abdomen | Bowtie Only | Paralyzable | ∞ | ∞ | 96% |
| Abdomen | Dynamic | Paralyzable | 104% | 120% | 59% |
| Abdomen | Bowtie + TCM | Hybrid | 77% | 151% | 96% |
| Abdomen | Bowtie Only | Hybrid | 75% | 160% | 100% |
| Abdomen | Dynamic | Hybrid | 99% | 116% | 61% |
Dependence on Detector Model
Figure 4 shows the sinogram of the incident flux for each of the two datasets for both reference systems and the dynamic attenuator. Figure 5 shows variance maps (images of the variance) of the reconstructed images for different detector models. As expected, the paralyzable detector shows extremely high noise streaks when the incident flux is close to the characteristic count rate. Table 1 summarizes the results.
Figure 4.
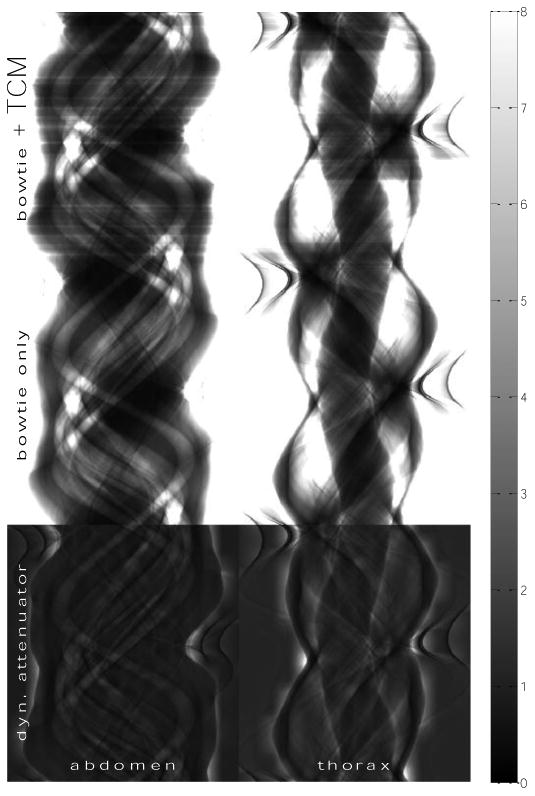
Matrix of sinograms of incident flux in 106 s-1 mm-2 for the (left column) abdomen and (right column) thorax datasets. The rows, from top to bottom, correspond to a reference system with both TCM and the bowtie filter, a reference system with only the bowtie filter, and the dynamic attenuator system. Values are reported in 106 s-1 mm-2, with the scale bar shown on the far right. Within each dataset (column), these sinograms produce reconstructed images with equal peak variance for the ideal detector. However, the dynamic attenuator suppresses the signal-rich regions in the sinogram, while increasing the flux in signal-poor regions to maintain image quality in the reconstructed image.
Figure 5.
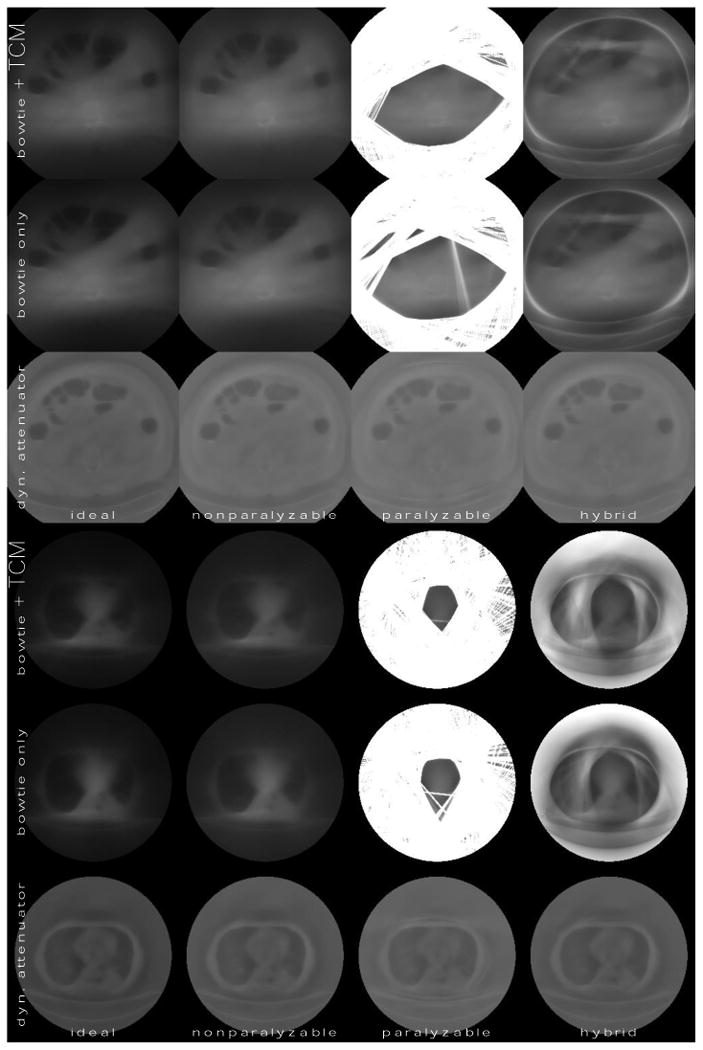
Variance maps (images of the variance) of the abdomen and the thorax for different detector models and system configurations. Brighter regions correspond to larger variance. Columns correspond to detector models, and rows correspond to system configurations. The characteristic count rate for non-ideal detector models is 5 * 106 s-1 mm-2. The average tube current for the bowtie + TCM system is 500 mA for the abdomen and 150 mA for the thorax. Key summary statistics, including dose, are reported in Table 1.
The dynamic attenuator achieves much more uniform noise distributions. We also see that it is able to achieve the same peak variance as the other systems at lower dose. Of most relevance to the motivation of this study, it is able to obtain good performance even with the paralyzable detector.
The effect of the square root TCM is mixed in these images. It leads to some dose reduction in the abdomen, but not in the thorax. Figure 6 shows variance maps for the second, thinner thoracic slice, which we chose in order to demonstrate the effect of TCM. In this figure, the hybrid detector model was assumed. We see a significant effect when the square-root TCM is enabled. Modulating the mA with the square root of the central ray is known to minimize the variance of the center pixel with the ideal detector (Gies et al 1999), but only if count rate loss effects are neglected. In Figure 6, count rate loss effects are significant. The square root TCM decreases noise in the mediastinum while increasing noise in the lungs.
Count Rate Requirements
To estimate the ability of the dynamic attenuator to reduce count rate requirements, we simulated the hybrid detector at characteristic count rates from 15 * 106 s-1 mm-2 to 2 * 106 s-1 mm-2, and also the ideal detector (infinite characteristic count rate). In these datasets, the difference between the ideal detector and 15 * 106 s-1 mm-2 was small enough that we did not include detectors with higher characteristic count rates. Note that the required characteristic count rate scales directly with the tube current. If 900 mA were used instead of 150 mA in the thorax (as may be the case for a cardiac scan), the required characteristic count rates would increase sixfold.
Figure 7 shows that for the reference system noise streaks are seen at about 5 * 106 s-1 mm-2 and become extremely strong by 2 * 106 s-1 mm-2. For the dynamic attenuator, the noise streaks are controlled through 2 * 106 s-1 mm-2. If the elimination of noise streaks is the objective, we estimate that the dynamic attenuator can allow a decrease in the count rate requirement by a factor of at least three.
Figure 7.
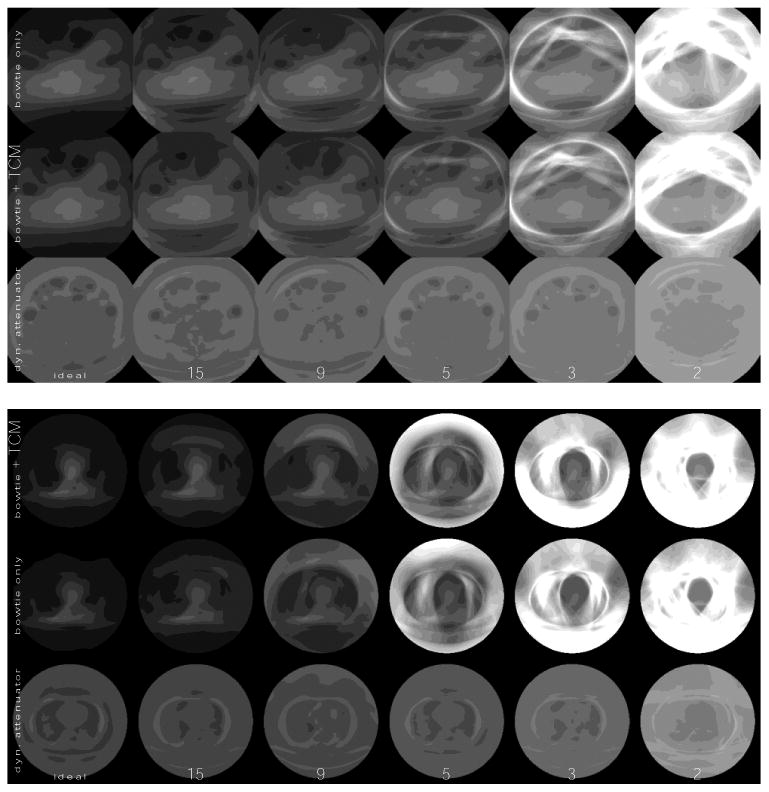
Variance maps (or images of the variance) at different characteristic count rates for both the reference system (with bowtie filter and TCM) and dynamic attenuator system, assuming the hybrid detector model (70% paralyzable, 30% nonparalyzable), for the (top) abdomen and the (bottom) thorax. Whiter is higher variance. The characteristic count rates are listed on the bottom, with units of 106 s-1 mm-2. The dose used is the same as in Table 1.
At low characteristic count rates, the impact of count rate loss is seen even without noise streaks. Figure 8 plots the peak variance as a function of characteristic count rate. The ability of the dynamic attenuator to compensate for a reduction in characteristic count rate depends on the variance penalty that one is willing to tolerate. In the abdomen, if a 20% variance penalty over the ideal detector is acceptable, the count rate requirements of the PCXD are reduced from 6 * 106 s-1 mm-2 to 3 * 106 s-1 mm-2. For the thorax, the count rate requirements are reduced from 9 * 106 s-1 mm-2 to about 3.5 * 106 s-1 mm-2. If only very small peak variance penalties can be tolerated, then all detectors behave similarly to the ideal detector and the advantage of the dynamic attenuator is primarily dose reduction. A dynamic attenuator system which delivers dose equivalent to the bowtie only reference system is also plotted in Figure 8 for comparison. For example, in the abdomen dataset, if the dose delivered by the reference system is acceptable, the peak variance could be reduced by 20% with a detector with a characteristic count rate of 4 * 106 s-1 mm-2.
Figure 8.
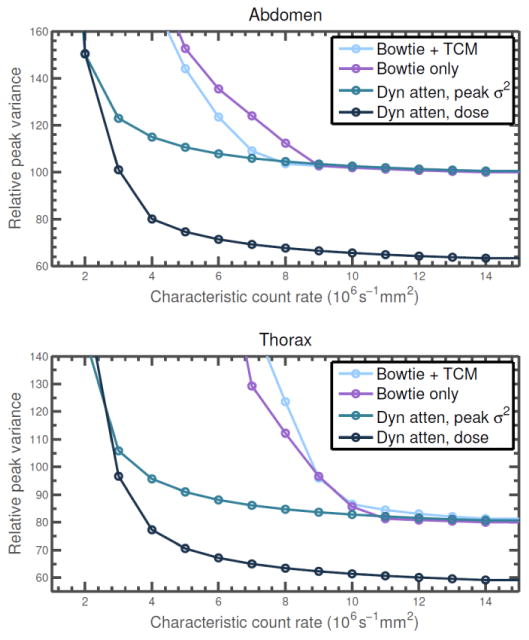
Peak variance (variance of the noisiest pixel) as a function of characteristic count rate for both the reference system and dynamic attenuator, assuming the hybrid detector model. The dynamic attenuator is controlled either for peak variance, delivering about 40% less dose than the reference systems, or to match the dose of the bowtie only system. Peak variance is normalized as in Table 1. Except for the dose-matched dynamic attenuator system, dose is reported in Table 1, with the two bowtie systems delivering slightly different doses.
Figure 9 shows sample noise realizations, which complement the variance maps. These noise realizations show the texture of the noise as it would appear on a clinical CT scan. Noise realizations can be generated by injecting random noise following Poisson statistics into the raw data (Mayo et al 1997). However, the raw data was not available to us. One approach of estimating the raw data is to assume that the DICOM dataset is ground truth, and to forward project it. We did not use this method because the DICOM dataset is already more blurred than the original ground truth, and forward projection and reconstruction would lead to further apodization and increased blurriness. Instead, we generated a sinogram of random noise alone and backprojected it, producing an image of noise by itself. This noise image was then added to the DICOM dataset. The noise image was scaled to have much larger variance than the original dataset, so that the noise of the DICOM dataset could be neglected. This process of generating a noise realization includes a number of assumptions, but we believed that it would still be illustrative of the types of noise textures that one would expect to see. For example, correlated noise and noise streaks are apparent in Figure 9 when they cannot be seen in the variance maps.
Figure 9.
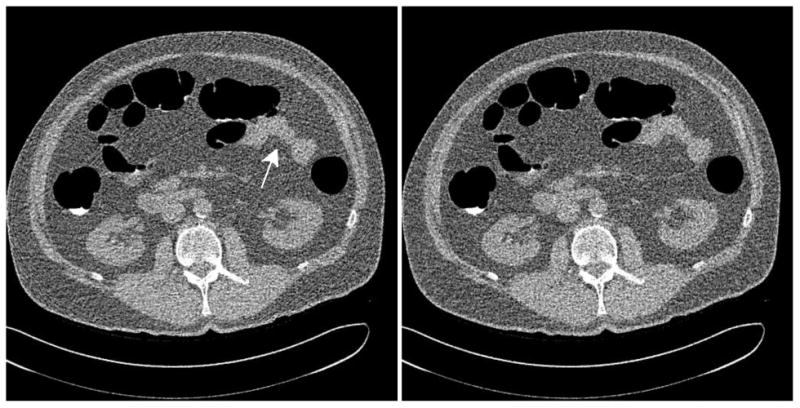
Sample low-dose noise realizations of the abdomen, assuming a hybrid detector model with a characteristic count rate of 3 * 106 s-1 mm-2. (Left) Reference system with conventional bowtie and TCM. The white arrow shows the effects of the noise streaks in reducing the definition of soft tissue contrast near the intestine. (Right) Dynamic attenuator system at 36% lower dose.
Discussion
The benefits of the piecewise-linear attenuator depend strongly on the detector model. All PCXD models exhibit count rate loss and decreased detective quantum efficiency as incident flux increases, but the nonparalyzable model predicts monotonically decreasing variance with increasing incident flux. Therefore, excessive incident flux does not lead to noise streaks. The voxels with the highest variance are determined by signal-poor rays and not by signal-rich rays. The piecewise-linear attenuator redistributes flux from signal-rich rays to signal-poor rays, improving dose efficiency, but to the same degree with a nonparalyzable detector as with the ideal detector. Thus, there is therefore little synergy between the dynamic attenuator and nonparalyzable detector. The average dose savings in two datasets was about 40%, consistent with existing estimates in the literature (Bartolac et al 2011).
For paralyzable detectors, the variance of the line integral measurement reaches a singularity when the incident flux equals the characteristic count rate. Our hybrid detector model, while never achieving a singularity, shows markedly higher variance at high incident flux. The dynamic attenuator can restrict the operating range of the detector to avoid severe damage to the statistics of rays which otherwise would have extreme impact. Figure 8 shows that the characteristic count rates necessary can then be reduced by a factor of at least three using the dynamic attenuator before noise streaks appear.
Our hybrid detector model serves as a crude model of a real PCXD. Many different PCXD designs are possible which can be described as lying on a spectrum between the nonparalyzable and the paralyzable models. The impact of count rate loss is governed largely through the slope , seen in Figure 2. For detectors without energy discrimination, each stationary (zero slope) point in the N vs. λ response curve produces a variance singularity. Even a flattening out of N vs. λ produces noise streaks. The dynamic attenuator can control either of these.
Imperfect calibration and correction of deterministic count rate effects have not been modeled in this work but are additional motivations for adopting the dynamic attenuator. At high incident flux, small drifts in the detected count rate N translate to very large errors in the inferred (i.e., corrected) λ. The dynamic attenuator could be used to restrict the incident flux to a range where the detector calibration is robust.
While we have limited our study to the dynamic, piecewise-linear attenuator, we believe the results would be substantially similar had a piecewise-constant attenuator (also called digital beam attenuator) (Szczykutowicz and Mistretta 2013b, Szczykutowicz and Mistretta 2013a) or inverse-geometry system (Schmidt et al 2004, Schmidt et al 2006, Hsieh et al 2013) been used. The digital beam attenuator is quite similar to the piecewise-linear attenuator, but implements a piecewise-constant attenuation profile instead of a piecewise-linear one by using a different shape of wedges. Compared to the piecewise-linear attenuator, the digital beam attenuator includes discontinuities in its attenuation profile which may lead to additional image artifacts. The control of the flux should be similar. For any of these methods, detailed control over the flux could be used to reduce noise streaks and improve dose efficiency. The advantages would be much larger for paralyzable detectors than for nonparalyzable detectors. Simpler dynamic attenuator designs with only one or two degrees of freedom (Arenson et al , Toth et al 2009) would be preferable to static bowtie filters but may not be able to suppress all noise streaks. Figure 8 shows noise streaks induced by the air in the abdomen, which simpler attenuators may not be able to avoid.
Detectors with relatively modest characteristic count rates were sufficient for the tasks examined in this work, which were a 500 mA scan of a large abdomen and a 150 mA scan of a moderately-sized thorax. More challenging tasks, such as cardiac imaging, would require much faster detectors. The relative comparisons within this work would still be valid if the tube current and detector characteristic count rate were scaled uniformly. For example, Figure 6 shows a thorax with little attenuation using a tube current of 35 mA and a characteristic count rate of 5 * 106 s-1 mm-2. The same comparison would hold for a tube current of 350 mA and a characteristic count rate of 50 * 106 s-1 mm-2, and the image variance would be reduced by a factor of 10 for all the systems being compared.
We have not considered spectral effects in this work. However, one of the primary attractions of PCXDs is the ability to measure the energy of individual recorded photons. This knowledge can be used to generate dual energy CT data, including material decomposition images (Alvarez and Macovski 1976, Schlomka et al 2008). In energy discriminating PCXD, if two photons arrive in close spatial and temporal proximity, they may be recorded as a single photon of increased energy. This damages the data in a way that may be more significant than simply count rate loss. Modeling this is more difficult because the simple paralyzable and nonparalyzable models, which are well understood and therefore used in this work, are not realistic for photon counting detectors with spectral imaging abilities. Some models have been proposed (Taguchi et al 2011), but they are more complex and tailored to specific detectors. Generalization of our results to photon counting detectors with energy discriminating capabilities is important and is the subject of ongoing research.
Acknowledgments
This research is supported by the Wallace H. Coulter Foundation and the National Institutes of Health (grant R21EB015574). The authors would also like to acknowledge Prof. Ken Taguchi for discussion of detector non-idealities.
References
- Agostinelli S, Allison J, Amako K, Apostolakis J, Araujo H, Arce P, Asai M, Axen D, Banerjee S, Barrand G. Geant4-a simulation toolkit. Nuclear Instruments and Methods in Physics Research-Section A Only. 2003;506(3):250–303. [Google Scholar]
- Alvarez RE, Macovski A. Energy-selective reconstructions in x-ray computerised tomography. Phys Med Biol. 1976;21:5–733. doi: 10.1088/0031-9155/21/5/002. [DOI] [PubMed] [Google Scholar]
- Arenson JS, Ruimi D, Meirav O, Armstrong RH. X-Ray Flux Management Device ed General Electric Company. United States: Google Patents; [Google Scholar]
- Ballabriga R, Campbell M, Heijne E, Llopart X, Tlustos L. The Medipix3 prototype, a pixel readout chip working in single photon counting mode with improved spectrometric performance. Nuclear Science Symposium Conference Record 2006 IEEE: IEEE. 2006:3557–61. [Google Scholar]
- Barber WC, Nygard E, Iwanczyk JS, Zhang M, Frey EC, Tsui BM, Wessel JC, Malakhov N, Wawrzyniak G, Hartsough NE. Characterization of a novel photon counting detector for clinical CT: count rate, energy resolution, and noise performance. SPIE Medical Imaging: International Society for Optics and Photonics. 2009:725824,725824–9. [Google Scholar]
- Bartolac S, Graham S, Siewerdsen J, Jaffray D. Fluence field optimization for noise and dose objectives in CT. Med Phys. 2011;38:S2. doi: 10.1118/1.3574885. [DOI] [PubMed] [Google Scholar]
- Boone JM, Seibert JA. An accurate method for computer-generating tungsten anode x-ray spectra from 30 to 140 kV. Med Phys. 1997;24:1661. doi: 10.1118/1.597953. [DOI] [PubMed] [Google Scholar]
- Bornefalk H, Danielsson M. Photon-counting spectral computed tomography using silicon strip detectors: a feasibility study. Phys Med Biol. 2010;55(7):1999. doi: 10.1088/0031-9155/55/7/014. [DOI] [PubMed] [Google Scholar]
- Chesler DA, Riederer SJ, Pelc NJ. Noise due to photon counting statistics in computed x-ray tomography. J Comput Assist Tomogr. 1977;1(1):64. doi: 10.1097/00004728-197701000-00009. [DOI] [PubMed] [Google Scholar]
- De Man B, Basu S, Bequé D, Claus B, Edic P, Iatrou M, LeBlanc J, Senzig B, Thompson R, Vermilyea M. Multi-source inverse geometry CT: a new system concept for X-ray computed tomography. Proceedings of SPIE. 2007:65100H. [Google Scholar]
- Gies M, Kalender WA, Wolf H, Suess C, Madsen MT. Dose reduction in CT by anatomically adapted tube current modulation. I. Simulation studies. Med Phys. 1999;26:2235. doi: 10.1118/1.598779. [DOI] [PubMed] [Google Scholar]
- Gimenez EN, Ballabriga R, Campbell M, Horswell I, Llopart X, Marchal J, Sawhney KJ, Tartoni N, Turecek D. Characterization of Medipix3 with synchrotron radiation. Nuclear Science, IEEE Transactions on. 2011;58(1):323–32. [Google Scholar]
- Hsieh J. Computed Tomography: Principles, Design, Artifacts, and Recent Advances: Society of Photo Optical 2003 [Google Scholar]
- Hsieh SS, Fleischmann D, Pelc NJ. Dose reduction using a dynamic, piecewise-linear attenuator. Med Phys. 2014;41:021910. doi: 10.1118/1.4862079. [DOI] [PMC free article] [PubMed] [Google Scholar]
- Hsieh SS, Heanue JA, Funk T, Hinshaw WS, Wilfley BP, Solomon EG, Pelc NJ. The feasibility of an inverse geometry CT system with stationary source arrays. Med Phys. 2013;40:031904. doi: 10.1118/1.4789918. [DOI] [PMC free article] [PubMed] [Google Scholar]
- Hsieh SS, Pelc NJ. Optimized control of a dynamic, prepatient attenuator. SPIE Medical Imaging: International Society for Optics and Photonics. 2013a:86681Q,86681Q–10. [Google Scholar]
- Hsieh SS, Pelc NJ. The feasibility of a piecewise-linear dynamic bowtie filter. Med Phys. 2013b;40(3):031910. doi: 10.1118/1.4789630. [DOI] [PMC free article] [PubMed] [Google Scholar]
- Joseph PM, Spital RD. A method for correcting bone induced artifacts in computed tomography scanners. J Comput Assist Tomogr. 1978;2(1):100. doi: 10.1097/00004728-197801000-00017. [DOI] [PubMed] [Google Scholar]
- Kalender WA, Wolf H, Suess C. Dose reduction in CT by anatomically adapted tube current modulation. II. Phantom measurements. Med Phys. 1999;26:2248. doi: 10.1118/1.598738. [DOI] [PubMed] [Google Scholar]
- Knoll GF. Radiation Detection and Measurement. Wiley; 2010. [Google Scholar]
- Koenig T, Hamann E, Procz S, Ballabriga R, Cecilia A, Zuber M, Llopart X, Campbell M, Fauler A, Baumbach T. Charge summing in spectroscopic x-ray detectors with high-Z sensors 2013 [Google Scholar]
- Kudo H, Courdurier M, Noo F, Defrise M. Tiny a priori knowledge solves the interior problem in computed tomography. Phys Med Biol. 2008;53:2207. doi: 10.1088/0031-9155/53/9/001. [DOI] [PubMed] [Google Scholar]
- Mayo JR, Whittall KP, Leung AN, Hartman TE, Park CS, Primack SL, Chambers GK, Limkeman MK, Toth TL, Fox SH. Simulated dose reduction in conventional chest CT: validation study. Radiology. 1997;202(2):453–7. doi: 10.1148/radiology.202.2.9015073. [DOI] [PubMed] [Google Scholar]
- Pan X, Sidky EY, Vannier M. Why do commercial CT scanners still employ traditional, filtered back-projection for image reconstruction? Inverse problems. 2009;25(12):123009. doi: 10.1088/0266-5611/25/12/123009. [DOI] [PMC free article] [PubMed] [Google Scholar]
- Roessl E, Proksa R. K-edge imaging in x-ray computed tomography using multi-bin photon counting detectors. Phys Med Biol. 2007;52:4679. doi: 10.1088/0031-9155/52/15/020. [DOI] [PubMed] [Google Scholar]
- Schlomka J, Roessl E, Dorscheid R, Dill S, Martens G, Istel T, Bäumer C, Herrmann C, Steadman R, Zeitler G. Experimental feasibility of multi-energy photon-counting K-edge imaging in pre-clinical computed tomography. Phys Med Biol. 2008;53(15):4031. doi: 10.1088/0031-9155/53/15/002. [DOI] [PubMed] [Google Scholar]
- Schmidt TG, Fahrig R, Pelc NJ, Solomon EG. An inverse-geometry volumetric CT system with a large-area scanned source: A feasibility study. Med Phys. 2004;31:2623. doi: 10.1118/1.1786171. [DOI] [PubMed] [Google Scholar]
- Schmidt TG, Star-Lack J, Bennett NR, Mazin SR, Solomon EG, Fahrig R, Pelc NJ. A prototype table-top inverse-geometry volumetric CT system. Med Phys. 2006;33:1867. doi: 10.1118/1.2192887. [DOI] [PubMed] [Google Scholar]
- Siewerdsen J, Waese A, Moseley D, Richard S, Jaffray D. Spektr: A computational tool for x-ray spectral analysis and imaging system optimization. Med Phys. 2004;31:3057. doi: 10.1118/1.1758350. [DOI] [PubMed] [Google Scholar]
- Szczykutowicz TP, Mistretta C. Practical considerations for intensity modulated CT. Proc SPIE 8313: Medical Imaging. 2012:83134E. [Google Scholar]
- Szczykutowicz TP, Mistretta CA. Design of a digital beam attenuation system for computed tomography. Part II. Performance study and initial results. Med Phys. 2013a;40:021906. doi: 10.1118/1.4773880. [DOI] [PMC free article] [PubMed] [Google Scholar]
- Szczykutowicz TP, Mistretta CA. Design of a digital beam attenuation system for computed tomography: Part I. System design and simulation framework. Med Phys. 2013b;40:021905. doi: 10.1118/1.4773879. [DOI] [PMC free article] [PubMed] [Google Scholar]
- Taguchi K, Srivastava S, Kudo H, Barber WC. Enabling photon counting clinical x-ray CT. Nuclear Science Symposium Conference Record (NSS/MIC), 2009 IEEE: IEEE) 2009:3581–5. [Google Scholar]
- Taguchi K, Iwanczyk JS. Vision 20/20: Single photon counting x-ray detectors in medical imaging. Med Phys. 2013;40:100901. doi: 10.1118/1.4820371. [DOI] [PMC free article] [PubMed] [Google Scholar]
- Taguchi K, Zhang M, Frey EC, Wang X, Iwanczyk JS, Nygard E, Hartsough NE, Tsui BM, Barber WC. Modeling the performance of a photon counting x-ray detector for CT: energy response and pulse pileup effects. Med Phys. 2011;38(2):1089–102. doi: 10.1118/1.3539602. [DOI] [PMC free article] [PubMed] [Google Scholar]
- Tang X, Hsieh J, Hagiwara A, Nilsen RA, Thibault JB, Drapkin E. A three-dimensional weighted cone beam filtered backprojection (CB-FBP) algorithm for image reconstruction in volumetric CT under a circular source trajectory. Phys Med Biol. 2005;50(16):3889. doi: 10.1088/0031-9155/50/16/016. [DOI] [PubMed] [Google Scholar]
- Tang X, Hsieh J, Nilsen RA, Dutta S, Samsonov D, Hagiwara A. A three-dimensional-weighted cone beam filtered backprojection (CB-FBP) algorithm for image reconstruction in volumetric CT—helical scanning. Phys Med Biol. 2006;51:855. doi: 10.1088/0031-9155/51/4/007. [DOI] [PubMed] [Google Scholar]
- Tapiovaara MJ, Wagner R. SNR and DQE analysis of broad spectrum x-ray imaging. Phys Med Biol. 1985;30:519. [Google Scholar]
- Toth TL, Tkaczyk JE, Hsieh J. Method and Apparatus of Radiographic Imaging with an Energy Beam Tailored for a Subject to be Scanned ed General Electric Company. United States: Google Patents; 2009. [Google Scholar]
- Wang AS, Harrison D, Lobastov V, Tkaczyk JE. Pulse pileup statistics for energy discriminating photon counting x-ray detectors. Med Phys. 2011;38:4265. doi: 10.1118/1.3592932. [DOI] [PubMed] [Google Scholar]
- Xu C, Danielsson M, Karlsson S, Svensson C, Bornefalk H. Performance characterization of a silicon strip detector for spectral computed tomography utilizing a laser testing system. Proc SPIE. 2011:79610S. [Google Scholar]
- Yu DF, Fessler JA. Mean and variance of single photon counting with deadtime. Phys Med Biol. 2000;45(7):2043. doi: 10.1088/0031-9155/45/7/324. [DOI] [PubMed] [Google Scholar]