

Abstract
Coordinated interplay between membrane proteins and the lipid bilayer is required for such processes as transporter function and the entrance of enveloped viruses into host cells. In this study, three-dimensional cryo-electron microscopy density maps of mature and immature flaviviruses were analyzed to assess the curvature of the membrane leaflets and its relation to membrane-bound viral glycoproteins. The overall morphology of the viral membrane is determined by icosahedral scaffolding composed of envelope (E) and membrane (M) proteins through interaction of the proteins’ stem-anchor regions with the membrane. In localized regions, small membrane regions exhibit convex, concave, flat or saddle-shaped surfaces that are constrained by the specific protein organization within each membrane leaflet. These results suggest that the organization of membrane proteins in small enveloped viruses mediate the formation of membrane curvature.
Keywords: cryo-electron microscopy, Flavivirus, West Nile virus, dengue virus, membrane curvature, enveloped virus
Introduction
Cellular membrane surfaces can assume a variety of different shapes and curvatures, including spherical, flat, cylindrical and saddle-shaped. Membrane remodeling and the resultant changes in surface curvature are key events that enable cells to fulfill important functions such as communication, movement, division, and vesicle fission and fusion (McMahon and Gallop, 2005). Although the chemical properties of the different lipid headgroups and acyl chains can intrinsically favor particular membrane curvatures, the coordinated interplay between the membrane proteins and the lipid membrane has been implicated to be critical for remodeling of the membrane curvature (McMahon and Gallop, 2005; Zimmerberg and Kozlov, 2006).
It has been suggested that membrane proteins influence the curvature through interaction with the headgroups and acyl chains, or through insertion into one or both leaflets of the membrane bilayer (McMahon and Gallop, 2005; Zimmerberg and Kozlov, 2006). For example, an amphipathic α-helix embedded in one membrane leaflet may displace nearby lipid headgroups and reorient the acyl chains to favor the formation of a membrane with a high degree of curvature. Such an event has been implicated in the function of the endocytic accessory protein epsin 1 during membrane invagination associated with clathrin-coated vesicle formation (Ford et al., 2002). In addition, oligomers of peripheral membrane proteins can act as scaffolds meditating dynamic changes in the membrane. For example, dynamin forms a helical structure that enables the production of a cylindrical membrane inside a protein tunnel that can be constricted through structural rearrangements induced by GTP hydrolysis (Chen et al., 2004; Zhang and Hinshaw, 2001). Inevitably, proteins influence membrane curvature through both specific and non-specific interactions between amino acid residues and lipid molecules.
To date, the high-resolution structures of numerous membrane proteins embedded in detergents have been documented; however, only a few high-resolution structures of proteins embedded in lipid membranes have been reported (Gonen et al., 2005; Grigorieff et al., 1996; Hite et al., 2007; Mitsuoka et al., 1999; Reichow and Gonen, 2009; Unwin, 2005). These structures within lipid membranes demonstrate that amino acid residues can influence the positions of the lipid headgroups and the thickness of the bilayer through electrostatic interactions and hydrophobic matching. For example, if a tryptophan residue is positioned near the membrane, its positively charged indole ring can interact with and dictates the position of the negatively charged headgroups of the lipids in one leaflet (Grigorieff et al., 1996; Mitsuoka et al., 1999). In addition, the hydrophobic transmembrane domains of proteins can influence the positions of the acyl chains of lipid molecules, thereby influencing the thickness of the bilayer. Such structural lipid-protein interplay provides insight into how membrane proteins modulate the positions of lipid molecules.
Studies of these membrane-embedded proteins using electron-crystallography have shed light on the nature of protein-lipid interactions, however they have not addressed the effect of proteins on membrane curvature, since the proteins were crystallized and embedded in a planer membrane. On the other hand, cryo-electron microscopy (cryo-EM) reconstruction maps of enveloped viruses can provide sufficient resolution to study the viral membrane curvature in the context of the protein organization (Laurinmaki et al., 2005). Here we present a study of the curvature of each membrane leaflet in the medium-resolution cryo-EM structures of West Nile virus (WNV, ~10 Å resolution), dengue virus (DENV, 9.5 Å resolution) (Zhang et al., 2003a) and immature DENV (~16 Å resolution) (Zhang et al., 2004). The overall morphology of the viral membranes is stabilized by icosahedral scaffolding composed of E/M or E/prM glycoproteins through insertion of their stem-anchor regions into the viral membrane. Within these virus particles, each membrane leaflet contains localized regions exhibiting a convex, concave, flat or saddle-shaped surface. These small membrane modules are constrained by E/M or E/prM proteins arranged in specific oligomerization patterns. The quantitative measurement of membrane curvature in this study demonstrates that the organization of membrane proteins mediates the formation of membrane curvature.
Materials and Methods
Cryo-electron microscopy and image processing
Mature WNV was propagated and purified as previously described (Kaufmann et al., 2006). Micrographs of a flash-frozen virus sample were recorded at a magnification of 47,440× using a Philips CM300 field emission gun transmission electron microscope under low-dose conditions (~30 e−/Å2). The micrographs were digitized on a Zeiss SCAI scanner using a 7-μm interval. Sets of four neighboring pixels in the scanned images were averaged to give an effective sampling step of 2.95 Å at the specimen. A total of 8,066 particles were initially selected from 83 micrographs with defocus levels ranging from 1.12 to 3.21 μm. A previously reported (Zhang et al., 2003a) 24 Å resolution DENV cryo-EM structure was used as an initial model for determining the orientation of the virus particles using the polar Fourier transform method (Baker and Cheng, 1996). Thereafter, the model-based reciprocal space refinement procedure PO2R (Ji et al., 2006) was used to refine the orientation and origin of each particle. The iteration steps for orientation refinement and 3D reconstruction were handled automatically using the program AUTO3DEM (Yan et al., 2007). A total of 1,556 particle images from 68 micrographs were used to compute the final reconstruction. The resolution was determined to be about 10.3 Å, based on where the Fourier shell correlation (FSC) coefficients between reconstructions using independent half-data sets fell below 0.5.
Fitting of the atomic structure of the WNV E protein into the cryo-EM density map
The ectodomain of the WNV E protein (PDB accession no. 2HG0) (Nybakken et al., 2006) was divided into two rigid bodies, DI (residues 1–47, 137–194, 286–297)/DIII (residues 298–400) and DII (residues 48–136, 195–285), which were fitted independently into the 3D density map using the program EMfit (Rossmann, 2000). All atoms, excluding hydrogen atoms, were used for the fitting process. The loop residues 256 to 260 in DII, which include three conserved glycine residues and have high temperature factors in the crystal structure of E monomers (Nybakken et al., 2006), were removed to avoid clashes during the fitting procedure. The first E molecule was fitted in the position closest to the icosahedral two-fold axis. A “difference” map was then produced by setting the densities within a 3.5 Å sphere of any atom in the fitted E molecule to zero. This map was used to fit the other two independent E molecules in the same icosahedral asymmetric unit. The second molecule to be modeled was nearest the already fitted molecule. The third and final molecule was then placed into the remaining space within the icosahedral asymmetric unit. The structural similarity between WNV and DENV was used to manually position the stem and anchor regions (pdb accession no, 1P58) (Zhang et al., 2003a) into the appropriate electron densities of the WNV cryo-EM map.
A 3D map that stores the radii of the membrane leaflets
The radial positions of the membrane leaflets were stored in their respective 3D sampling maps (SAMP-map). A SAMP-map had the same dimension as the cryo-EM map of the virus. The center of the SAMP-map, (x0, y0, z0), represented the center of the virus. The pixels within a 11-pixel-thick shell of the SAMP-map (ranging between 66 to 77 pixel radii) were used as the sampling points. These sampling points were close enough to allow precise measurement of the membrane curvature. The coordinate of each sampling point, (x, y, z), corresponded to a unit direction vector v⃑, i.e. (u, v, w), pointing from (x0, y0, z0) to (x, y, z). The value of the SAMP-map at (x, y, z) represented the radii of the membrane leaflets along the direction v⃑.
Determination of the positions of the membrane leaflets in a spherical enveloped virus cryo-EM map
Radial density plots were calculated using the pixels within 1-pixel-thick spherical shells for cones having a semiangle of 5° radiating from the center of the virus. The wave-shaped radial density plots had two maxima above zero with one less-than-zero peak in between. The two maximum density peaks, located at radial distances of about 150 and 210 Å from the center of the WNV and DENV maps, and 160 and 210 Å from the center of the immature DENV density map, were identified in each cone as the radial positions of the inner (Rin) and outer (Rout) membrane leaflets, respectively (Fig. 1C). The center of the bilayer (Rmid) was defined as the lowest density position between Rin and Rout. The radial positions of each membrane entity (the inner, outer leaflets and the center of the bilayer) were determined similarly for all sampling points in the respective SAMP-map.
Fig. 1.
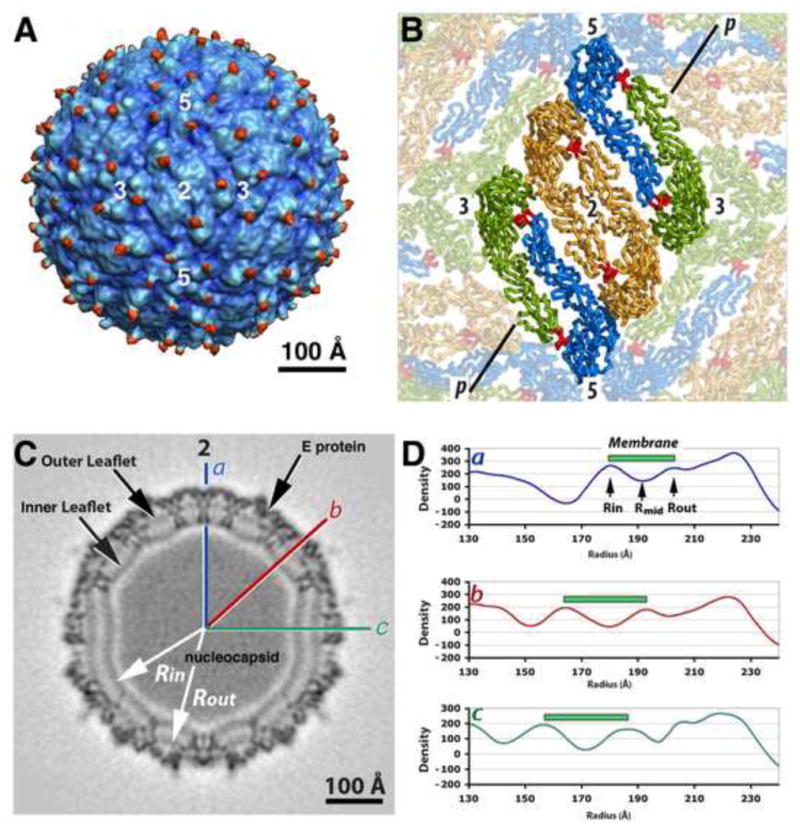
Cryo-EM map of mature WNV at 10.3 Å resolution. (A) The reconstruction map showing the external protein shell in blue and the N-linked carbohydrates in red. The numbers mark the positions of the icosahedral two, three- and five-fold axes. (B) The fitted E dimers arranged as a herringbone-like raft structure on the surface of WNV. The icosahedral two-fold dimer is in orange, the two other quasi-related E molecules in the same asymmetric unit are colored in blue and green. The fusion peptide is colored in red. The line “p” represents the position of the cross section in C. (C) Cross section of the cryo-EM density map. The lines labeled “a” (icosahedral two-fold), “b” and “c” indicate the directions of the corresponding radial density plots displayed in panel C. (D) Radial density plots along “a”, “b” and “c” in C. The green bar represents the peak-to-peak distance between the centers of the inner and outer membrane leaflets.
The pixelation effect caused by representing a geometric curve or surface in a discrete space introduces errors into the calculation of curvature. For an example in 2D, if a circle were represented as a set of points and short lines, the curvature at any point on the short lines would be zero, rather than the real curvature of the circle. Similarly, because the radii of the membrane leaflets were calculated based on a discrete 3D density map, the set of sampling points for each membrane entity in a raw SAMP-map convey information of a pixelated surface and was not adequate for calculating the curvature. Therefore, the radii stored in a raw SMAP-map of each membrane entity were fitted in a sextic polynomial function using the Levenberg-Marquardt least square fitting method (Press et al., 1992):
where (u, v, w) is the unit direction vector v⃑ pointing from the center of the SAMP-map, (x0, y0, z0), towards any sampling point (x,y,z); R is the radius of a membrane entity along v⃑, ie. the value of the SAMP-map at the point (x,y,z); and i, j and k vary between 0, 1 and 2. The fitting boundary along the x, y or z direction was arbitrarily set to ±20 pixels from (x,y,z), which was equivalent to ±60 Å in the virus structure.
After least square fitting, each sampling point in a refined SAMP-map of a membrane entity was associated with its original unit direction vector and a refined radius. Let Sin, Sout and Smid, represent the surfaces of the inner, outer leaflets and the center of the membrane bilayer, respectively, the sampling points of the refined SAMP-maps allowed for calculating the curvatures of these surfaces, as well as the electron densities of the virus structure on these surfaces. The radii and the electron densities at these surfaces were projected onto a plane using the program RIVEM (Xiao and Rossmann, 2007).
Determination of Gaussian and average curvatures in discrete 3D space
The Gaussian curvature KG and the average curvature KA (See supplementary document) can be estimated using the geometric parameters of the triangles that approximate the surface (Rugis, 2008). In Fig. 2A, P is a point on the surfaces of the inner, outer leaflet, or the middle of the membrane, ie. Sin, Sout or, Smid, and v⃑ is the unit vector from the virus center to P. The points Qi (i=1,6) represents the position on the same membrane surface as P along the directions and v⃑i (i=1,6), respectively. Let fi represents the triangle (Qi, P, Qi+1) (i = 1, 6). These triangles (f1 – f6) approximate the shape of the membrane surface at point P.
Fig. 2.
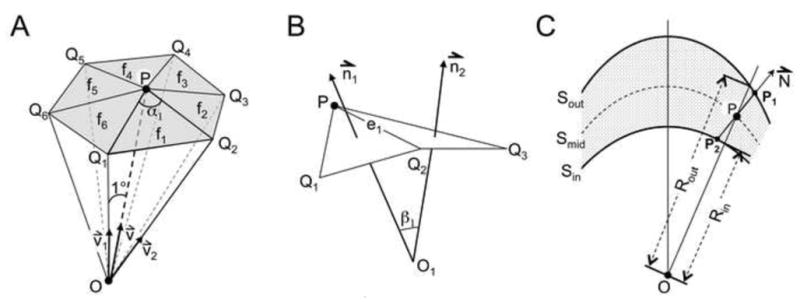
Diagrams illustrating the calculation of membrane curvature and thickness. (A) Six elementary triangles (f1 to f6) that approximate a membrane surface at point P. O represents the center of the virus particle. (B) Side view of two neighboring triangles that approximate a membrane surface. (C) Diagram showing the calculation of membrane thickness. Sout and Sin are surfaces symbolizing the outer and inner membrane leaflets. Smid is the surface representing the lowest density region between the two leaflets. O is the center of the virus particle in the reconstruction map.
The Gaussian curvature KG at P can then be estimated (Rugis, 2008) by using the equation
where αi is the angle (∠ Qi, Pi,j, Qi+1), and S(fi) is the surface area of the triangle fi. Note that if the point P is located on a saddle-shaped surface, the sum of αi is greater than 2π, and the Gaussian curvature at that point is a negative value.
The average curvature KA at P (Fig. 2B) was estimated to be (Rugis, 2008)
where ||ei|| is the distance between points P and Qi, and βi is the angle between the vectors n⃑i and n⃑i+1, normal to triangles fi and fi+1. The point Oi is taken to be at the intersection point of n⃑i and n⃑i+1. βi is defined as being positive when Oi and the center of the virus are on the same side of the membrane surface. Then a positive average curvature at point P means that the virus membrane surface will appear to protrude outward. A negative curvature at point P means the membrane surface will appear invaginated looking from the outside of the virus particle.
Determination of the surface area and the average electron density of lipids
The surfaces of the membrane entities (Sin, Sout or Smid) in one asymmetric unit was placed into an array that had sampling points at 0.1° intervals in polar angles θ and ϕ (Baker and Cheng, 1996). For each polar angle direction (θi, ϕj), the physical location of any membrane surface entity can be obtained from the respective fitted SAMP-map. The total surface area (S) of each membrane leaflet in one asymmetric unit could then be determined by summing the area of all the elementary triangles forming that surface.
where S(Ti1) and S(Ti2) represented the areas of the membrane surface of two neighboring triangles: T i1 (the triangle formed by the positions of a membrane entity at the directions defined by the polar angles (θi, ϕj), (θi+1, ϕj) and (θi, ϕj+1)) and Ti2 (the triangle formed by the positions of a membrane entity at the directions of (θi+1, ϕj), (θi, ϕj+1) and (θi+1, ϕj+1)).
The surface area occupied by the lipid molecules was calculated by excluding any sampling points located within 6 Å of the Cα atoms (Zhang et al., 2003a) in the fitted pseudo-atomic model of the E and M stem-anchors. The average electron densities of the lipid headgroups in each membrane leaflet were calculated using the electron densities of nonprotein-associated sampling points on Sin and Sout.
Determination of the thickness of the membrane bilayer
Because the viral membrane is not an ideal sphere, the thickness of the membrane bilayer needs to be calculated along a direction that is normal to the viral membrane. Assuming the normal of the viral membrane is the same as the normal vector of the surface Smid (N⃑ in Fig. 2C), the thickness of the bilayer was defined as the distance between P1 and P2, which is different than the difference between the radii of Sout and Sin [i.e., (Rout – Rin)]. The two numbers would be the same if the two membrane surfaces Sout and Sin are concentrated spheres. N⃑ was calculated as being the average of the vectors normal to the triangles (Q1, Q3, Q5) and (Q2, Q4, Q6) of the surface Smid (Fig. 2A).
Program implementation
The procedures described in this manuscript were implemented into a FORTRAN program. The input of the program includes a 3D reconstruction map of a spherical enveloped virus in the Purdue Image Format (PIF), the modeled membrane-assoicated protein coordinate file (in PDB format), and the necessary numerical parameters such as the pixel size of the 3D map and the approximate radial position of the membrane bilayer. The center of the virus structure ought to be at the center of the 3D map. The output of the program includes the 3D maps that record the radius, Gaussian and average curvatures, electron density distribution and surface areas of the bilayers and the midpoint of the membrane, as well as the thickness of the membrane. The current version of the program is designed to characterize the membrane properties of the spherical enveloped viruses. The program is available free from the authors.
Results and Discussion
Protein organization in mature WNV
The new reconstruction of WNV reported here has a higher resolution (10.3 Å) (Fig. 1A) than the earlier 17-Å reconstruction (Mukhopadhyay et al., 2003), and resembles the closely related DENV structure (Zhang et al., 2003a; Zhang et al., 2013). The virus has a 40-Å-thick, spikeless E protein shell (radius 210–250 Å), a lipid bilayer (~150–210 Å) and an unstructured nucleocapsid core (Fig. 1B) (Zhang et al., 2003a; Zhang et al., 2007b; Zhang et al., 2003b). Fitting the atomic coordinates of the monomeric WNV E ectodomain (Nybakken et al., 2006) into the cryo-EM WNV map shows that the E protein makes dimers, similar to the mature DENV E dimer (Zhang et al., 2004). Furthermore rafts formed by three nearly parallel head-to-tail E dimers are organized into a herringbone-like pattern on the viral surface and formed a tightly packed protein shell as is also the case for mature DENV (Kuhn et al., 2002). Lastly the M protein is mostly buried under the E ectodomain layer also as in DENV (Kuhn et al., 2002).
Position and surface area of the membrane leaflets in mature WNV
The E protein shell of WNV is located at a radial distance of between 205 and 240 Å everywhere in the particle. However the radial positions of the mid point of the membrane varies substantially from 170 Å near the five-fold axes to 190 Å at the two-fold axes (Fig. 1B and 3A). The inner membrane leaflet has its largest radius (180 Å) at an icosahedral two-fold axis, where the E and M protein transmembrane helices traverse the membrane (Fig. 3D). The smallest radius (156 Å) of the inner leaflet is observed at the five-fold axis, where no membrane proteins are present. The radial position of the outer membrane leaflet (Fig. 3E) also reaches its largest radius at the two-fold axis (203 Å) and its smallest at the five-fold axis (187 Å). These observations suggest that the radial positions of the membrane leaflets are dependent on the distribution of the stem-anchors of the E/M proteins.
Fig. 3.
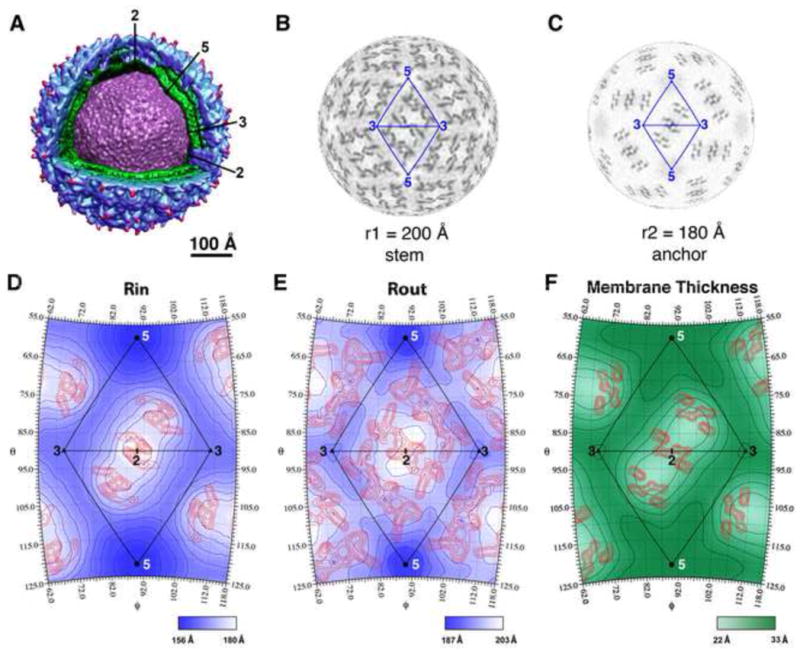
Positions of and distance between the centers of the inner and outer membrane leaflets in WNV. (A) Cut-away view showing the E protein shell (blue), membrane bilayer (green) and the nucleocapsid core (purple). (B–C) Radial projections of the WNV cryo-EM map at a radius corresponding to the stem (B) and the transmembrane helices of the E and M proteins (C), respectively. (D) Radial position of the inner membrane leaflet color-shaded (blue) and contoured at 3.0 Å intervals. The blue contour lines closest to the five-fold axes demarcate positions of 159 Å radii. The highest electron densities, corresponding to the transmembrane helices of the E and M proteins in the inner membrane leaflet, are contoured (red lines) at 0.3σ intervals and 2.1σ above the background of the cryo-EM map. (E) Radial position of the outer leaflet color-shaded (blue) and contoured at 3.0-Å intervals. The blue contour lines closest to the five-fold axes demarcate positions of 188 Å radii. The electron densities corresponding to the stem regions of E and M proteins in the outer membrane leaflet are contoured (red lines) at 0.3σ intervals and 1.9σ above the background of the reconstruction map. (F) Distance between the centers of the inner and outer membrane leaflets in WNV. The green contour lines are displayed at 2.0 Å intervals with the one closest to the two-fold axis representing 22.6 Å. The red contour lines show the electron densities of the E and M transmembrane helices at a position midway between the outer and inner membrane leaflet. These densities were contoured at 0.3σ level intervals and 1.3σ above the background in the reconstruction map.
The thickness of the membrane varies significantly within the virus particle (Fig. 1C, 3F). The viral membrane is thickest around the five-fold axes. The approximate 33 Å peak-to-peak distance between the maximum density heights of the of the membrane leaflets, is similar to the peak-to-peak distance between the headgroups in the membrane of PRD1 crystal structure (Cockburn et al., 2004). The WNV bilayer is thinnest (~22 Å) around the two-fold axes, where the E and M transmembrane helices span the membrane. The radial positions of the inner lipid leaflet at these two-fold axes, and consequent reduction of the thickness of the viral membrane, are probably constrained by the length of the E and M hydrophobic transmembrane helices.
Lipid components cover about 75% of the inner leaflet area (~4,700 Å2 per icosahedral asymmetric unit covered by lipids) and about 40% of the outer leaflet (~3,400 Å2 per asymmetric unit). The average electron density of the lipid molecules in the inner leaflet is higher than that in the outer leaflet (182.8±20.5 vs. 155.8±20.8). A similar lipid density ratio between the inner and outer membrane leaflets is also observed for WNV reconstruction maps rendered to lower resolutions and the DENV cryo-EM maps (Supplementary Table 1). The difference in the average lipid densities in the two leaflets could reflect the polymorphism of lipid compositions (Frolov et al., 2011) or different packing density in the respective membrane layer. The WNV particles obtain their membrane from the endoplasmic reticulum (ER) of baby hamster kidney cells (BHK) cells which is rich in phosphatidylcholine (PC, 64%) and phosphatidylethanolamine (PE, 20%) (Allan, 1996). Another study using DENV propagated in mosquito cells found that PC and PE were up-regulated when the cells were infected with the virus (Perera et al., 2012). Therefore, it is likely that the WNV membranes are rich in PC and PE. Molecular modeling of egg PC suggested that the molecular area of the headgroup was estimated to be 61 Å2 in the inner membrane leaflet and 74 Å2 in the outer membrane leaflet (Huang and Mason, 1978). The crystal structure of PRD1, whose membrane is rich in PE (53%), suggests a similar average distance (8.5 Å) between lipid headgroups in the outer membrane leaflet, which in turn suggests each headgroup occupies ~72 Å2 of surface area (Cockburn et al., 2004). Assuming the lipid headgroups in the WNV membrane occupy an average area of ~60–75 Å2, the inner and outer membrane leaflets contain ~60–80 and ~45–60 lipid molecules per asymmetric unit, respectively.
Curvature of the membrane leaflets in mature WNV
The average membrane curvature in mature WNV reflects how much the viral membrane deviates from an ideal sphere. The average radii of the inner and outer membrane leaflets are ~168 Å and ~195 Å. At the icosahedral two-fold axes, the average curvatures of both inner (Fig. 4A) and outer (Fig. 4B) membrane leaflets are positive and equivalent to much smaller spheres (47 Å and 93 Å radii), suggesting both membrane leaflets protrude outwards from their average radii. At the icosahedral five-fold axes, both the inner and outer membrane leaflets have negative average curvatures, indicating the membrane surfaces are concave and rounding inward when looking from outside of the viral particle. At the three-fold axes, the inner leaflet has a negative average curvature, whereas the outer leaflet has a curvature close to zero suggesting the membrane leaflet is close to a flat plane. The deviation of the mature WNV membrane from a spherical morphology is probably due to the specific herringbone-like arrangement of the E and M proteins within each membrane leaflet. In general both the inner and outer membrane leaflets appear to be pulled outwards near the icosahedral two-fold axes where the stem and transmembrane domains of the E and M proteins locate.
Fig. 4.
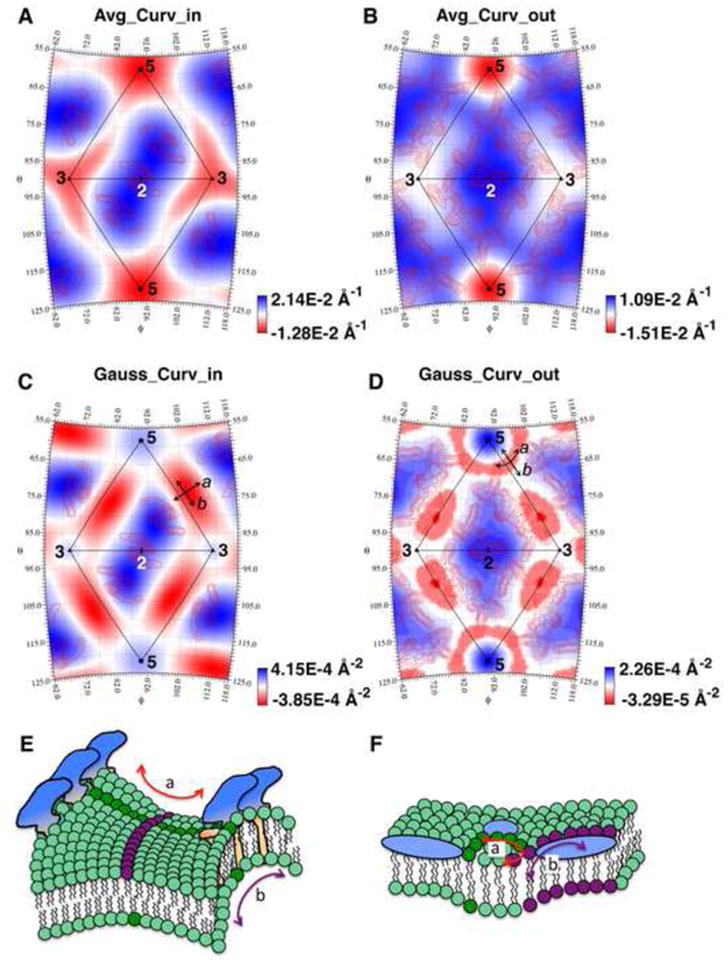
Membrane curvature in mature WNV particles. (A–B) The average curvatures of the inner (A) and outer (B) membrane leaflets superimposed on the red contour lines that represent the protein densities at the respective membrane leaflet. The positive curvatures (blue), represent the convex areas viewing from outside of the particle. The negative curvatures (red) represent the concave areas. (C–D) The Gaussian curvatures of the inner (C) and outer (D) membrane leaflets. The negative Gaussian curvatures (red) correspond to local saddle-shaped surfaces. “a” represents the direction either pointing to two neighboring rafts (C), or circling the five-fold axis of the membrane (D). “b” represents the direction perpendicular to “a”. (E) A saddle-shaped membrane formed in a region where proteins (blue and orange) bend the membrane away from its natural curvature. “a” and “b” represent two bending directions of the membrane depicted as dark green and purple (applicable to F). (F) A saddle-shaped membrane area (dark green circles) located at the edge of an invaginating membrane area surrounded by a group of proteins (blue).
The Gaussian curvatures of the viral membrane leaflets suggest that saddle shaped membranes surfaces occur under two circumstances. One type saddle shaped surface locates midway between a five-fold and its nearby three-fold axes (red regions in Fig. 4C). This saddle shaped membrane surface bends either up or down along two perpendicular directions. Along the direction “a” in Fig. 4C and 4E, the viral membrane surface bends inwards and reaches higher radii at the two-fold axes, on the other hand, along the line that connect a five-fold and the closest three-fold axes (“b” in Fig. 4C and E), the membrane surface protrudes outward to accommodate the overall spherical shape of the virus particle. Another type saddle-shaped membrane surface in a mature WNV particle locates at the outer membrane leaflet near a fivefold axis (Fig. 4D). Because the outer membrane leaflet rounds inward at the five-fold axis, this saddle-shaped surface mimics the neck region of an invaginated vesicle. Around the central five-fold axis, five sets of the E protein rafts assume a circular arrangement that dictates the curvature of the membrane in a circular direction around the central five-fold axis (direction “a” in Fig. 4D and F). The membrane which is constrained inside the groups of circularly arranged proteins adopts a curvature with a smaller radius than the surrounding membrane area, which reflects the bending of the membrane in the opposite direction (direction “b” in Fig. 4D and F). In summary, saddle-shaped membrane surfaces appear to occur near regions that are confined within a group of transmembrane proteins or between neighboring E/M rafts, where the proteins counteract the natural shape and curvature of the lipid layers in a spherical virus particle.
The shape and curvature of the membrane leaflets in mature and immature DENV particles
The membrane property of mature DENV is very similar to that in WNV in terms of the radial positions, curvatures as well as the surface area of each membrane leaflet (Supplementary Table 1). The viral envelope in the 16-Å resolution DENV immature cryoEM map (Zhang et al., 2003b) is roughly spherical with radial distance varying only ~10 Å in the membrane leaflets (Fig. 5), which is significantly less than that in the mature DENV particle (18 Å and 24 Å for the outer and inner leaflet, respectively). This is probably because the transmembrane helices are more evenly distributed across the viral sphere in the immature particle (Fig. 5B and 5C) (Zhang et al., 2007a; Zhang et al., 2003b). The smallest radii of the inner and outer membrane leaflets in immature DENV are not at the five-fold axes, as in the mature virion, but are beneath the center of each trimeric protein spike (Fig. 5B). These areas, about 6 Å closer to the viral center than the surrounding membrane plane (Fig. 5D–E) and has a negative average curvature (Fig. 5F–G), suggesting the membrane is concave or curving inward toward the viral center. Interestingly, these indented membrane areas are bordered by three sets of E/M protein stem-transmembrane domains. Such observation was also made in Sindbis virus, where membranes curve inward within the circularly arranged E1/E2 transmembrane domains at the icosahedral two-fold and five-fold axes (Supplementary Fig. 2).
Fig. 5.
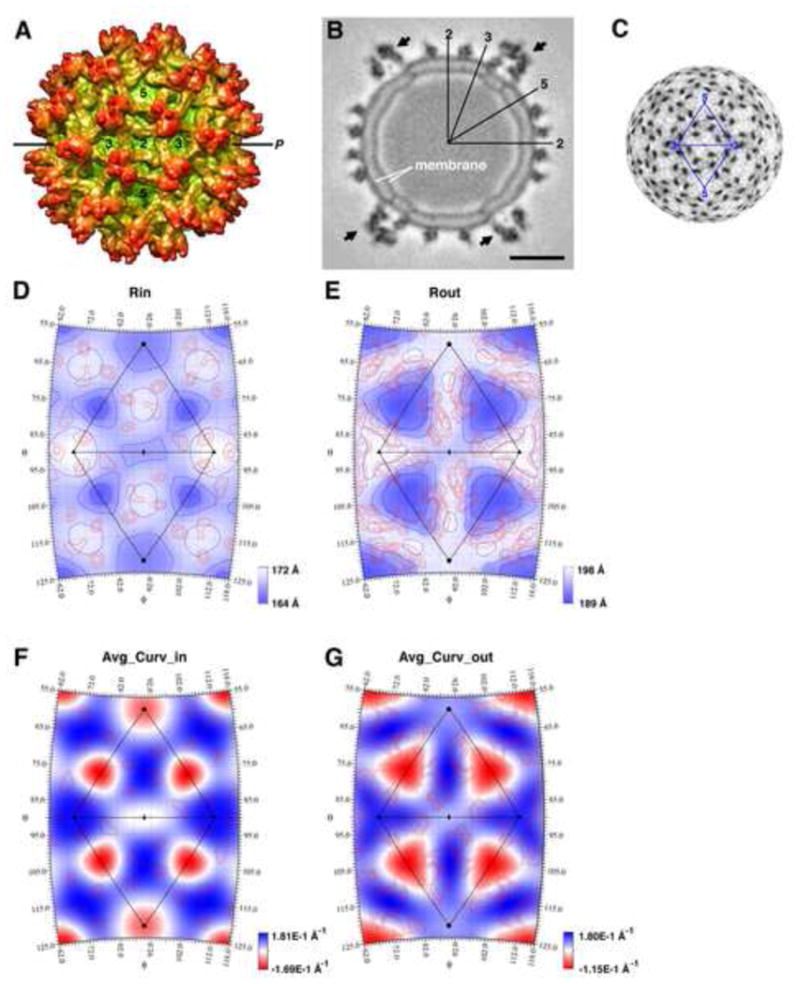
Membrane position and curvature in the immature DENV particle. (A) Cryo-EM reconstruction of an immature DENV particle at 16 Å resolution (Zhang et al., 2003b) with the outer membrane leaflet colored in green and the protein shell in orange. The line “P” represents the position of the cross-section shown in panel B. (B) Cross-section of the immature dengue virus cryo-EM density. “q3” represents the center of the protein spike which has a quasi-threefold symmetry. The arrows point to the protein spikes that cover the membrane areas having distinctly smaller radii. The scale bar is 100 Å. (C) Radial projection of the immature DENV cryo-EM map at a radius of 180 Å, which corresponds to the center of the viral membrane. The dark densities correspond to the transmembrane domains of E and M proteins. (D) Radial position of the inner leaflet shaded (blue) and contoured at 3 Å intervals. The blue contour lines closest to the q3 axes demarcate the positions of 164 Å radii. The red contour lines represent the electron densities of the E and M transmembrane helices at the inner membrane leaflet. These densities are contoured at 0.3σ interval and are 2.0σ above the background level of the reconstruction map. (E) Radial position of the outer leaflet shaded (blue) and contoured at 3 Å intervals. The blue contour lines closest to the q3 axes demarcate the positions of 191 Å radii. The electron densities of the E and M proteins at the outer membrane leaflet are contoured (red lines) at 0.3σ intervals and 2.2σ above the background of the reconstruction map. (F–G) The average curvatures of the inner and outer membrane leaflets superimposed on the contours of the highest electron densities within the respective leaflet.
The surface area occupied by the lipid molecules in the immature DENV membrane was calculated by subtracting the surface area occupied by the E and M transmembrane domains from the total area of the membrane (calculated at the mid-point of the membrane). This was about 6% smaller than in the mature DENV virions. It is possible that the change in pH that occurs during maturation alters not only the local chemical environment between associated viral surface proteins, but also affects the electrostatic interactions between these proteins and the viral membrane. If so, these chemical changes could promote not only the formation of new protein-protein interactions in a different oligomeric arrangement, but also the reorganization of lipid molecules and the establishment of new lipid-protein interactions. Because immature flavivirus particles can undergo reversible conformational changes to the mature particle morphology at low pH provided there is no cleavage of the pr peptide, the topological changes in the lipid membrane during the maturation process are presumably also reversible. The calculation of flavivirus membrane curvatures suggests that the flavivirus viral membrane elastically and dynamically accommodates the changes in protein organization that occur during maturation.
Structure accession numbers
The cryoEM density map for WNV was deposited in the EM databank under accession number EMD-5296, and the fitted atomic coordinates were deposited in the Protein Data Bank under PDB accession number 3J0B.
Supplementary Material
Acknowledgments
We are grateful to Drs. Jue Chen and Rushika Perera for helpful comments. The work was supported by an NIH Program Project Grant (AI055672 to R.J.K. and M.G.R.) and an NIH R21 grant (R21AI079473 to W.Z.). The computational work of membrane curvatures was conducted at the Minnesota Supercomputing Institute, University of Minnesota.
Abbreviation
- cryo-EM
cryo-electron microscopy
- 3D
three-dimensional
- WNV
West Nile virus
- DENV
dengue virus
Footnotes
Publisher's Disclaimer: This is a PDF file of an unedited manuscript that has been accepted for publication. As a service to our customers we are providing this early version of the manuscript. The manuscript will undergo copyediting, typesetting, and review of the resulting proof before it is published in its final citable form. Please note that during the production process errors may be discovered which could affect the content, and all legal disclaimers that apply to the journal pertain.
References
- Allan D. Mapping the lipid distribution in the membranes of BHK cells (mini-review) Mol Membr Biol. 1996;13:81–4. doi: 10.3109/09687689609160580. [DOI] [PubMed] [Google Scholar]
- Baker TS, Cheng RH. A model-based approach for determining orientations of biological macromolecules imaged by cryoelectron microscopy. J Struct Biol. 1996;116:120–30. doi: 10.1006/jsbi.1996.0020. [DOI] [PubMed] [Google Scholar]
- Chen YJ, Zhang P, Egelman EH, Hinshaw JE. The stalk region of dynamin drives the constriction of dynamin tubes. Nat Struct Mol Biol. 2004;11:574–5. doi: 10.1038/nsmb762. [DOI] [PubMed] [Google Scholar]
- Cockburn JJ, Abrescia NG, Grimes JM, Sutton GC, Diprose JM, et al. Membrane structure and interactions with protein and DNA in bacteriophage PRD1. Nature. 2004;432:122–5. doi: 10.1038/nature03053. [DOI] [PubMed] [Google Scholar]
- Ford MG, Mills IG, Peter BJ, Vallis Y, Praefcke GJ, et al. Curvature of clathrin-coated pits driven by epsin. Nature. 2002;419:361–6. doi: 10.1038/nature01020. [DOI] [PubMed] [Google Scholar]
- Frolov VA, Shnyrova AV, Zimmerberg J. Lipid polymorphisms and membrane shape. Cold Spring Harb Perspect Biol. 2011;3:a004747. doi: 10.1101/cshperspect.a004747. [DOI] [PMC free article] [PubMed] [Google Scholar]
- Gonen T, Cheng Y, Sliz P, Hiroaki Y, Fujiyoshi Y, et al. Lipid-protein interactions in double-layered two-dimensional AQP0 crystals. Nature. 2005;438:633–8. doi: 10.1038/nature04321. [DOI] [PMC free article] [PubMed] [Google Scholar]
- Grigorieff N, Ceska TA, Downing KH, Baldwin JM, Henderson R. Electron-crystallographic refinement of the structure of bacteriorhodopsin. J Mol Biol. 1996;259:393–421. doi: 10.1006/jmbi.1996.0328. [DOI] [PubMed] [Google Scholar]
- Hite RK, Raunser S, Walz T. Revival of electron crystallography. Curr Opin Struct Biol. 2007;17:389–95. doi: 10.1016/j.sbi.2007.06.006. [DOI] [PMC free article] [PubMed] [Google Scholar]
- Huang C, Mason JT. Geometric packing constraints in egg phosphatidylcholine vesicles. Proc Natl Acad Sci U S A. 1978;75:308–10. doi: 10.1073/pnas.75.1.308. [DOI] [PMC free article] [PubMed] [Google Scholar]
- Ji Y, Marinescu DC, Zhang W, Zhang X, Yan X, et al. A model-based parallel origin and orientation refinement algorithm for cryoTEM and its application to the study of virus structures. J Struct Biol. 2006;154:1–19. doi: 10.1016/j.jsb.2005.06.009. [DOI] [PMC free article] [PubMed] [Google Scholar]
- Kaufmann B, Nybakken GE, Chipman PR, Zhang W, Diamond MS, et al. West Nile virus in complex with the Fab fragment of a neutralizing monoclonal antibody. Proc Natl Acad Sci U S A. 2006;103:12400–4. doi: 10.1073/pnas.0603488103. [DOI] [PMC free article] [PubMed] [Google Scholar]
- Kuhn RJ, Zhang W, Rossmann MG, Pletnev SV, Corver J, et al. Structure of dengue virus: implications for flavivirus organization, maturation, and fusion. Cell. 2002;108:717–25. doi: 10.1016/s0092-8674(02)00660-8. [DOI] [PMC free article] [PubMed] [Google Scholar]
- Laurinmaki PA, Huiskonen JT, Bamford DH, Butcher SJ. Membrane proteins modulate the bilayer curvature in the bacterial virus Bam35. Structure. 2005;13:1819–28. doi: 10.1016/j.str.2005.08.020. [DOI] [PubMed] [Google Scholar]
- McMahon HT, Gallop JL. Membrane curvature and mechanisms of dynamic cell membrane remodelling. Nature. 2005;438:590–6. doi: 10.1038/nature04396. [DOI] [PubMed] [Google Scholar]
- Mitsuoka K, Hirai T, Murata K, Miyazawa A, Kidera A, et al. The structure of bacteriorhodopsin at 3.0 A resolution based on electron crystallography: implication of the charge distribution. J Mol Biol. 1999;286:861–82. doi: 10.1006/jmbi.1998.2529. [DOI] [PubMed] [Google Scholar]
- Mukhopadhyay S, Kim BS, Chipman PR, Rossmann MG, Kuhn RJ. Structure of West Nile virus. Science. 2003;302:248. doi: 10.1126/science.1089316. [DOI] [PubMed] [Google Scholar]
- Nybakken GE, Nelson CA, Chen BR, Diamond MS, Fremont DH. Crystal structure of the West Nile virus envelope glycoprotein. J Virol. 2006;80:11467–74. doi: 10.1128/JVI.01125-06. [DOI] [PMC free article] [PubMed] [Google Scholar]
- Perera R, Riley C, Isaac G, Hopf-Jannasch AS, Moore RJ, et al. Dengue virus infection perturbs lipid homeostasis in infected mosquito cells. PLoS Pathog. 2012;8:e1002584. doi: 10.1371/journal.ppat.1002584. [DOI] [PMC free article] [PubMed] [Google Scholar]
- Press WH, Flannery BP, Teukolsky SA, Vetterling WT. Numerical Recipes in C: The Art of Scientific Computing. 2. Cambridge University Press; 1992. [Google Scholar]
- Reichow SL, Gonen T. Lipid-protein interactions probed by electron crystallography. Curr Opin Struct Biol. 2009;19:560–5. doi: 10.1016/j.sbi.2009.07.012. [DOI] [PMC free article] [PubMed] [Google Scholar]
- Rossmann MG. Fitting atomic models into electron-microscopy maps. Acta Crystallogr D Biol Crystallogr. 2000;56:1341–9. doi: 10.1107/s0907444900009562. [DOI] [PubMed] [Google Scholar]
- Rugis J. Digital Surface Curvature: Identifying and Visualizing Surface Detail. VDM Verlag Dr. Müller; 2008. [Google Scholar]
- Unwin N. Refined structure of the nicotinic acetylcholine receptor at 4A resolution. J Mol Biol. 2005;346:967–89. doi: 10.1016/j.jmb.2004.12.031. [DOI] [PubMed] [Google Scholar]
- Xiao C, Rossmann MG. Interpretation of electron density with stereographic roadmap projections. J Struct Biol. 2007;158:182–7. doi: 10.1016/j.jsb.2006.10.013. [DOI] [PMC free article] [PubMed] [Google Scholar]
- Yan X, Sinkovits RS, Baker TS. AUTO3DEM--an automated and high throughput program for image reconstruction of icosahedral particles. J Struct Biol. 2007;157:73–82. doi: 10.1016/j.jsb.2006.08.007. [DOI] [PMC free article] [PubMed] [Google Scholar]
- Zhang P, Hinshaw JE. Three-dimensional reconstruction of dynamin in the constricted state. Nat Cell Biol. 2001;3:922–6. doi: 10.1038/ncb1001-922. [DOI] [PubMed] [Google Scholar]
- Zhang W, Chipman PR, Corver J, Johnson PR, Zhang Y, et al. Visualization of membrane protein domains by cryo-electron microscopy of dengue virus. Nat Struct Biol. 2003a;10:907–12. doi: 10.1038/nsb990. [DOI] [PMC free article] [PubMed] [Google Scholar]
- Zhang X, Ge P, Yu X, Brannan JM, Bi G, et al. Cryo-EM structure of the mature dengue virus at 3.5-A resolution. Nat Struct Mol Biol. 2013;20:105–10. doi: 10.1038/nsmb.2463. [DOI] [PMC free article] [PubMed] [Google Scholar]
- Zhang Y, Kostyuchenko VA, Rossmann MG. Structural analysis of viral nucleocapsids by subtraction of partial projections. J Struct Biol. 2007a;157:356–64. doi: 10.1016/j.jsb.2006.09.002. [DOI] [PMC free article] [PubMed] [Google Scholar]
- Zhang Y, Kaufmann B, Chipman PR, Kuhn RJ, Rossmann MG. Structure of immature West Nile virus. J Virol. 2007b;81:6141–5. doi: 10.1128/JVI.00037-07. [DOI] [PMC free article] [PubMed] [Google Scholar]
- Zhang Y, Zhang W, Ogata S, Clements D, Strauss JH, et al. Conformational changes of the flavivirus E glycoprotein. Structure. 2004;12:1607–18. doi: 10.1016/j.str.2004.06.019. [DOI] [PMC free article] [PubMed] [Google Scholar]
- Zhang Y, Corver J, Chipman PR, Zhang W, Pletnev SV, et al. Structures of immature flavivirus particles. Embo J. 2003b;22:2604–13. doi: 10.1093/emboj/cdg270. [DOI] [PMC free article] [PubMed] [Google Scholar]
- Zimmerberg J, Kozlov MM. How proteins produce cellular membrane curvature. Nat Rev Mol Cell Biol. 2006;7:9–19. doi: 10.1038/nrm1784. [DOI] [PubMed] [Google Scholar]
Associated Data
This section collects any data citations, data availability statements, or supplementary materials included in this article.