

PAS kinase is a conserved sensory protein kinase required for glucose homeostasis. The interactome for yeast PAS kinase 1 (Psk1) is identified, revealing 93 binding partners. Evidence is provided for in vivo phosphorylation of Cbf1 and subsequent inhibition of respiration, supporting a role for Psk1 in partitioning glucose for cell growth.
Abstract
Per-Arnt-Sim (PAS) kinase is a sensory protein kinase required for glucose homeostasis in yeast, mice, and humans, yet little is known about the molecular mechanisms of its function. Using both yeast two-hybrid and copurification approaches, we identified the protein–protein interactome for yeast PAS kinase 1 (Psk1), revealing 93 novel putative protein binding partners. Several of the Psk1 binding partners expand the role of PAS kinase in glucose homeostasis, including new pathways involved in mitochondrial metabolism. In addition, the interactome suggests novel roles for PAS kinase in cell growth (gene/protein expression, replication/cell division, and protein modification and degradation), vacuole function, and stress tolerance. In vitro kinase studies using a subset of 25 of these binding partners identified Mot3, Zds1, Utr1, and Cbf1 as substrates. Further evidence is provided for the in vivo phosphorylation of Cbf1 at T211/T212 and for the subsequent inhibition of respiration. This respiratory role of PAS kinase is consistent with the reported hypermetabolism of PAS kinase–deficient mice, identifying a possible molecular mechanism and solidifying the evolutionary importance of PAS kinase in the regulation of glucose homeostasis.
INTRODUCTION
Sensory protein kinases sense the nutrient or stress status of the cell and adjust metabolic processes accordingly. Per-Arnt-Sim (PAS) kinase is a sensory protein kinase with a conserved N-terminal sensory PAS domain and a C-terminal S/T kinase domain required for congruous glucose homeostasis in yeast, mice, and humans (for recent reviews see Hao and Rutter, 2008; Grose and Rutter, 2010; Cardon and Rutter, 2012; DeMille and Grose, 2013). A single point mutation (G1117E) in human PAS kinase has been associated with maturity-onset diabetes of the young, is seemingly hyperactive, and produces basal insulin hypersecretion when expressed in mouse islets (Semplici et al., 2011). This role of PAS kinase in insulin secretion had been reported in mice, where PAS kinase is essential for glucose-responsive preproinsulin and pancreatic duodenum homeobox 1 gene expression in Min6 cells (da Silva Xavier et al., 2004; Fontes et al., 2009). PAS kinase–deficient mice also display increased insulin sensitivity, as well as resistance to fat and triglyceride accumulation, when placed on a high-fat diet (Hao et al., 2007). These mice are hypermetabolic, consuming more oxygen while gaining less weight than their wild-type littermates despite the same food intake and physical activity. Yeast PAS kinase also has a conserved role in glucose homeostasis through the phosphorylation of Ugp1, a well-characterized substrate and a key enzyme in glucose allocation (Rutter et al., 2002; Smith and Rutter, 2007; Cardon and Rutter, 2012; Grose et al., 2007). Despite this crucial role of PAS kinase in eukaryotic glucose homeostasis, little is known about the molecular mechanisms of its function, including protein substrates. This lack of understanding is predominately due to the difficulty in elucidating protein kinase function.
Protein kinases play critical roles in disease development due to their ability to simultaneously regulate multiple interrelated pathways (recent reviews include Eglen and Reisine, 2011; Zhang and Daly, 2012; Fang et al., 2013; Gallinetti et al., 2013; Lal et al., 2013), yet they are difficult to study. This difficulty is primarily due to the abundance of eukaryotic protein kinases and their multiple and overlapping targets, with hundreds of protein kinases that phosphorylate >50% of the proteome, often at multiple sites within a single protein (Johnson and Hunter, 2005; Sopko and Andrews, 2008; Mok et al., 2011; Knight et al., 2012; Graves et al., 2013). This overlapping function makes it difficult to perturb a single kinase due to cellular feedback mechanisms. A fruitful method for identifying protein kinase substrates is to identify direct protein–protein interactions (Johnson and Hunter, 2005). The two widespread approaches for identifying protein binding partners are the yeast two-hybrid (Y2H; Fields and Song, 1989) and copurification followed by quantitative mass spectrometry (Jessulat et al., 2011; Dunham et al., 2012; Kean et al., 2012; Marcilla and Albar, 2013).
The first protein–protein interactome for PAS kinase is reported here, obtained through both comprehensive Y2H and copurification approaches. The 93 identified putative binding partners support and expand the role of PAS kinase in glucose homeostasis, including new pathways involved in mitochondrial metabolism. The relevance of our interactome is demonstrated through in vitro kinase assays using 25 identified putative binding partners. In addition, in vivo evidence is provided for the PAS kinase 1 (Psk1)–dependent phosphorylation and inhibition of Cbf1, a novel substrate involved in the regulation of mitochondrial respiration. These results are consistent with yeast PAS kinase partitioning glucose away from respiration and may explain the mechanism by which PAS kinase–deficient mice display a hypermetabolic phenotype.
RESULTS
Identification of ΔN692Psk1, a construct with increased protein-binding proficiency
Initial Y2H screens employing full-length yeast Psk1 as bait yielded only false positive hits despite it being a functional construct (functionality of the bait was verified by its ability to rescue Ugp1 toxicity, as previously described; Grose et al., 2009). This difficulty in detecting binding partners is consistent with the classic notion that kinase/substrate interactions are transient, making them difficult to detect by conventional protein–protein interaction screens. To identify Psk1 constructs with increased protein–protein interaction capabilities, Y2H screens were conducted using various Psk1 truncations as bait (Figure 1A) and a genomic library as prey (pJG428; James et al., 1996). These Psk1 truncations were previously isolated from a screen for hyperactive mutants that suppress Ugp1 toxicity (Grose et al., 2009), and all corresponding bait constructs were verified as functional by this same assay. One truncation, beginning at amino acid 693 (ΔN692Psk1), yielded multiple true positive hits from the Y2H screen, suggesting enhanced binding proficiency (Figure 1B). These hits were tested against the full-length protein and showed very weak but reproducible growth above background, suggesting the ΔN692Psk1 construct increased the strength of the Y2H interactions. The bona fide Psk1 substrate Ugp1 was not used as prey because epitope tags are known to destroy the ability of Psk1 to phosphorylate Ugp1 (Smith and Rutter, 2007).
FIGURE 1:
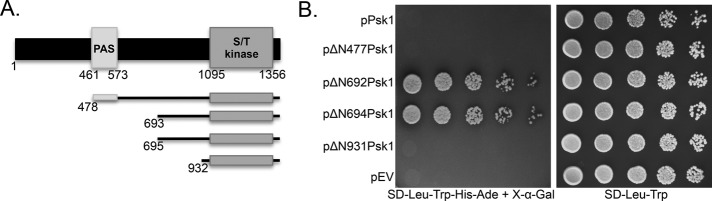
A Psk1 Y2H construct with increased protein–protein interaction proficiency. (A) A diagram of previously isolated hyperactive truncations of Psk1 (Grose et al., 2009) that were screened for their ability to bind protein partners in a Y2H screen. (B) The relative Y2H interaction strength of each Psk1 truncation is shown using Pbp1, a Psk1 binding partner identified in this study by both Y2H and copurification approaches. Y2HGold cells (Clontech) containing the Pbp1 prey (pJG1001) were cotransformed with bait plasmids harboring full-length Psk1 (pJG441), truncated Psk1 (ΔN477Psk1 [pJG1005], pΔN692Psk1 [pJG598], pΔN694Psk1 [pJG1006], pΔN931Psk1 [pJG568]) or empty vector (pJG425). Overnights were grown in SD-Leu-Trp for plasmid maintenance, diluted fivefold serially, and plated on Y2H selective media (SD-Leu-Trp-His-Ade + X-α-Gal), as well as a control plate (SD-Leu-Trp). Plates were incubated at 30°C for 3–4 d until colonies were apparent. The Y2H Gold strain contains four reporters under the control of three different Gal4-responsive promoters (Clontech), allowing selection for histidine (His) or adenine (Ade) biosynthesis, as well as blue colony formation on media containing X-α-Gal.
PAS kinase binding partners identified through Y2H and copurification
The Psk1 truncation ΔN692Psk1 was then used to perform large-scale Y2H screens for Psk1 binding partners. Advantages of the Y2H approach include the identification of direct protein–protein interactions and sensitivity due to transcriptional amplification of an interaction. This sensitivity may be particularly useful when studying protein kinases due to transient interactions with substrates; however, the yeast two-hybrid can also yield false positives that allow growth independent of the bait. To minimize false positives, the Y2HGold strain was used, which harbors four different reporters controlled by three different GAL4-responsive promoters (Clontech Matchmaker Gold Yeast Two-hybrid System). Y2H screens were conducted with three yeast genomic libraries (James et al., 1996) and two cDNA libraries (this study). From ∼40 million transformants or matings screened (Table 1), 28 Psk1 binding partners were identified (Table 2). Each of these binding partners was verified by purifying the prey plasmid from yeast and retransforming into naive Y2HGold along with the ΔN692Psk1 bait or an empty bait plasmid. Remarkably, 100% of the binding partners were dependent on the Psk1 plasmid and were thus true positives in the Y2H assay.
TABLE 1:
Libraries screened in the yeast two-hybrid.
| Library name | Library type | Number of matings/transformants |
|---|---|---|
| pJG427 | Genomic library cloned into pGAD-C1 reading frame | 4,825,880 |
| pJG428 | Genomic library cloned into pGAD-C2 reading frame | 2,071,560 |
| pJG429 | Genomic library cloned into pGAD-C3 reading frame | 7,461,150 |
| pJG1074 | cDNA isolated from stationary-phase yeast and cloned into pGADT7 | 24,000,000 |
| pJG1098 | cDNA isolated from exponential-phase yeast and cloned into pGADT7 | 2,000,000 |
| Total | 40,358,590 |
The genomic libraries were a generous gift from David Stillman, Unversity of Utah, and James et al. (2006), and cDNA libraries were prepared for this study using Clontech's Make Your Own “Mate & Plate” Library System. The mRNA from yeast grown to either stationary phase or exponential phase was isolated (RNeasy Mini Kit; Qiagen). Y2H Gold cells (Clontech) containing pJG598 were mated with yeast containing cDNA libraries (JGY1074 or JGY1098) or transformed with genomic libraries (pJG427, pJG428, and pJG429). Cells were plated on SD-Leu-Trp-His-Ade or SGal-Leu-Trp-His-Ade to select for yeast two-hybrid protein–protein interactions.
TABLE 2:
Psk1 binding partners identified by the yeast two-hybrid.
| Gene | Human homologue | Gene name description | Localization | Number of hits | Prey library used | Carbon source | Construct (total number of amino acids [aa]) | Growth strength |
|---|---|---|---|---|---|---|---|---|
| Glucose metabolism | ||||||||
| KRE6 | Killer toxin resistant | C/V/ER | 1 | Gen | G | aa 300–550 (720) | M | |
| MTH1 | MSN3 homologue | C | 1 | Gen | G | aa 1–433 (433) | S | |
| STD1 | PSMD81 | Suppressor of Tbp deletion | C | 1 | Gen | G | aa 124–444 (444) | M |
| YAP6 | Yeast homologue of AP-1 | C | 14 | Gen | G/D | aa 41–383 (383) | S | |
| Gene/protein expression | ||||||||
| CBF1 | USF11 | Centromere- binding factor | C/N/M | 3 | Gen | G | aa 202–351 (351) | M |
| GCD14 | TRMT61A2 | General control nonderepressible | C/N | 2 | cDNA | D | aa 152–383 (383) | S |
| HAP2 | NFYA1 | Heme activator protein | C/N | 2 | cDNA | D | aa 56–249 (265) | M |
| IES6 | Ino80 subunit | N | 108 | cDNA | D | aa 1–166 (166) | S | |
| MOT3 | PLAGL13 | Modifier of transcription | C/N | 1 | Gen | G | aa 311–490 (490) | S |
| NOB1 | NOB12 | Nin1(one)-binding protein | C/N | 1 | cDNA | D | aa 230–459 (459) | S |
| PBP1 | ATXN21 | Pab1p-binding protein | C/N/M | 44 | Gen | D | aa 356–, 197–722 (722) | S |
| PMD1 | Paralogue of MDS3 | C | 2 | Both | D | aa 1482–1753 (1753) | S | |
| SAP30 | NCOR23 | SIT4 protein phosphatase–associated protein | N | 1 | cDNA | D | aa 110–201 (201) | S |
| SIR4 | NOLC11 | Silent information regulator | C/N | 4 | Gen | G | aa 1094-1358 (1358) | M |
| SSN2 | Suppressor of SNf1 | C/N | 8 | Both | G/D | aa 504–703 (1420) | S | |
| TOM1 | WWP11 | Temperature-dependent organization in mitotic nucleus | N | 4 | Gen | G/D | aa 2055–2459 (3268) | M |
| Replication/cell division | ||||||||
| FOB1 | Fork blocking less | C/N | 11 | Gen | D | aa 3–421 (566) | M | |
| IBD2 | Inhibition of bud division 2 | C | 50 | Gen | G/D | aa 106–, 183–351 (351) | M | |
| ZDS1 | Zillion different screens | C | 2 | Gen | G | aa 795–915 (915) | S | |
| ZDS2 | Zillion different screens | C/N | 6 | Gen | G | aa 692–, 516–942 (942) | S | |
| Amino acid biosynthesis/catabolism | ||||||||
| CYS3 | CTH2 | Cystathionine γ-lyase | C | 6 | cDNA | D | aa 169–394 (394) | S |
| LYS14 | MBD61 | Lysine requiring | C/N | 1 | Gen | D | aa 179–790 (790) | M |
| Protein/RNA degradation | ||||||||
| PRB1 | PCSK91 | Proteinase B | C | 3 | Gen | G/D | aa 80–249 (635) | S |
| RPM2 | RNase P mitochondrial | M | 2 | cDNA | D | aa 740–1202 (1202) | W | |
| Mitochondrial function | ||||||||
| NFS1 | NFS12 | NiFS-like cysteine desulfurase | M | 7 | Gen | D | aa 20–, 70–497 (497) | S |
| Unknown | ||||||||
| YFR006W | PEPD2 | C | 1 | cDNA | D | aa 47–186 (535) | S | |
| YIL108W | C | 9 | Gen | D | aa 3–498 (696) | M | ||
| YNL144C | M | 2 | Gen | G/D | aa 1–600 (740) | M | ||
Y2H Gold cells (Clontech) containing pJG598 (ΔN692Psk1 fused to the GAL4 BD) were mated with cDNA libraries produced with Clonetech's Make Your Own “Mate & Plate” Library System (JGY1074 or JGY1098) or transformed with genomic libraries (pJG427, pJG428, and pJG429; James et al., 1996). Cells were plated on SD-Leu-Trp-His-Ade or SGal-Leu-Trp-His-Ade to select for yeast two-hybrid protein–protein interactions. Plasmids were purified from colonies that arose, sequenced, and verified as true positives by transforming back into naive Y2H Gold cells containing the bait (pJG598) or empty bait plasmid (pJG425) and then restreaking on yeast two-hybrid selective media. Columns indicate the gene symbol, human homologue (where applicable, and database retrieved from 1MIT Isobase, 2NCBI HomoloGene, 3NCBI Blast), gene name description, cellular localization (from the Saccharomyces Genome Database and FunSpec), number of times the protein was retrieved from the screen, the prey library used in the screen (Genomic [Gen] or cDNA library), the carbon source used (either galactose [G] or dextrose [D]), the amino acids present in the prey construct, with the total known amino acids for the protein given in parentheses, and the strength of growth, which is an indication of the interaction strength (S, strong; M, medium; W, weak). For localization, C corresponds to cytoplasm, M to mitochondrion, N to nucleus, ER to endoplasmic reticulum, and V to vacuole.
An alternative sensitive and reliable approach for identifying protein binding partners is copurification followed by quantitative mass spectrometry (MS). Full-length Psk1 fused with histidine (HIS), Myc, or FLAG epitopes was affinity purified in triplicate, and samples were subjected to quantitative liquid chromatography (LC)–tandem MS. Sixty-seven putative binding partners were identified for Psk1 (Table 3). Most of the reported proteins were only present in the Psk1 samples, not the empty vector control, and were identified in at least two of three independent replicates. For abundant proteins found in both samples, the cutoff was set at ≥3.4× the protein score in the Psk1 sample. For the HIS-epitope purifications, the ΔN692Psk1 construct was also used. Remarkably, 85% of the full-length or ΔN692Psk1 binding partners retrieved in the HIS-tag purifications were also identified with significance in at least one of the samples of the alternate construct, suggesting that the truncated form of Psk1 behaves similar to wild type and was only necessary in the Y2H screen. This could be due to differences in sensitivity or alternate folding of the Y2H fusion construct. A majority of the proteins in Table 3 were obtained from the HIS purifications. This is likely due to the increased expression of the HIS construct in yeast when compared with the FLAG or Myc constructs (unpublished data), as well as the six replicates (three for full-length and three for truncated Psk1) compared with three for FLAG or Myc. PAS kinase 2 (Psk2), a Psk1 homologue arising from whole-genome duplication, was the only protein that was retrieved from more than one of the copurification approaches. It is common, however, to retrieve different proteins when using different epitopes due to differences in purification methods and/or epitope effects on the fusion protein (Breitkreutz et al., 2010). This interaction suggests that Psk1/Psk2 heterodimers exist within the cell and is consistent with the tendency for kinases to dimerize (Endicott et al., 2012).
TABLE 3:
Psk1 binding partners identified by copurification, followed by quantitative mass spectrometry.
| Gene | Human homologue | Name description | Localization | In Psk1 only | Psk1/EV ratio | In ΔN692 only | ΔN692/EV ratio |
|---|---|---|---|---|---|---|---|
| Glucose metabolism | |||||||
| GAL2 | SLC2A101 | Galactose metabolism | C | 1 | 2 | ||
| GAL83 | PRKAB23 | Galactose metabolism | C | 2 | 2 | ||
| GLK1 | IGFBP41 | Glucokinase | C | 1 | 2 | ||
| GND1 | PGD1 | 6-Phosphogluconate dehydrogenase | C/N/M | 2 | 1 | ||
| HXK2 | HK12 | Hexokinase | C | 1 | 2 | ||
| PSK2 | PASK1 | PAS kinase 2 | C/M | 3, 2# | 2 | ||
| SIP2 | PRKAB22 | Snf1-interacting protein | C/PM | 1 | 5.2 | 4.6 | |
| SNF1 | PRKAA22 | Sucrose nonfermenting | C/M | 5.1, 5.2 | 3.8 | ||
| TDH2 | GAPDH2 | Triose-phosphate dehydrogenase | C/N/W | 2† | |||
| TDH3 | GAPDH2 | Triose-phosphate dehydrogenase | C/N/W | 2† | |||
| Gene/protein expression | |||||||
| ABF1 | ARS-binding factor 1 | C/N | 1 | 5.9, 4.7 | |||
| BMH1 | YWHAZ1 | Brain modulosignalin homologue | C | 3 | 1 | ||
| BMH2 | YWHAE1 | Brain modulosignalin homologue | C/N | 3 | 1 | ||
| EAF6 | MED151 | Esa1p-associated factor | C/N | 1 | 2 | ||
| EFT1 | EEF22 | Elongation factor 1 | C | 1 | 2 | ||
| EFT2 | EEF22 | Elongation factor 2 | C | 1 | 2 | ||
| HUB1 | UBL51 | Homologous to ubiquitin | C | 2 | |||
| INO2 | Inositol requiring | N | 1 | 2 | |||
| LSM12 | LSM121 | Like SM | C/N | 2 | 1 | ||
| PAB1 | PABPC12 | Poly(A)-binding protein | C | 2 | |||
| PBP1 | ATXN21 | Pab1p-binding protein | C/N/M | 1 | 4.3 | 3.4, 3.7 | |
| SSD1 | DIS31 | Suppressor of SIT4 deletion | C/N | 2 | 5.97 | 1 | 5.3 |
| SSZ1 | HSPA83 | Hsp70 protein | C | 1 | 2 | ||
| TEF1 | EEF1A11 | Translation elongation factor | C | 2† | |||
| VTS1 | SAMD4A1 | VTi1-2 suppressor | C | 2 | |||
| Replication/cell division | |||||||
| CDC33 | EIF4E1 | Cell division cycle | C | 4.2, 26.6 | 22.72 | ||
| MYO1 | MYH111 MYH92 | Myosin | C/B | 1 | 2 | ||
| NUM1 | Nuclear migration | B/M | 3 | 2 | |||
| TUB2 | TUBB2 | Tubulin | C | 1 | 2 | ||
| Amino acid biosynthesis/catabolism | |||||||
| ASN2 | ASNS1 | Asparagine requiring | C | 1 | 2 | ||
| CAR2 | OAT2 | Catabolism of arginine | C/N | 2 | 2 | ||
| GAD1 | SGPL11 | Glutamate decarboxylase | C | 2 | 1 | ||
| ILV1 | SRR1 | Isoleucine-plus-valine requiring | M | 1 | 2 | ||
| Protein/RNA degradation | |||||||
| DPM1 | DPM11 | Dolichol phosphate mannose synthase | ER/M | 1 | 2 | ||
| HSP82 | HSP90AA12 | Heat shock protein 90 | C/N | 1 | 2 | ||
| HTZ1 | H2AFV2 | Histone 2 A Z1 | N | 2 | 1 | ||
| LCL2 | Long chronological lifespan 2 | C | 2 | ||||
| PRB1 | PCSK91 | Proteinase B | C | 1 | 6.0, 8.7 | 1 | 6.4 |
| YDJ1 | DNAJA11 DNAJA22 | Yeast dnaJ | C/N | 1 | 2 | ||
| Mitochondrial function | |||||||
| AIM32 | Altered inheritance rate of mitochondria | C/M | 2 | 1 | |||
| ATP1 | ATP5A12 | ATP synthase | C/M | 1 | 2 | ||
| ATP2 | ATP5B2 | ATP synthase | M | 2 | 1 | ||
| COQ4 | COQ42 | Coenzyme Q | C/M | 1 | 2 | ||
| MIR1 | SLC25A31 | Mitochondrial phosphate carrier | M | 2 | 1 | ||
| MMT2 | SLC30A91 | Mitochondrial metal transporter | C/M | 2 | |||
| MRM1 | MRM12 | Mitochondrial rRNA methyltransferase | M | 1 | 2 | ||
| QCR6 | Ubiquinol-cytochrome C oxidoreductase | C/M | 2 | ||||
| Stress tolerance | |||||||
| AHP1 | PRDX51 | Alkyl hydroperoxide reductase | C/N | 2 | 3 | ||
| DLD3 | D2HGDH1 | d-Lactate dehydrogenase | C/N | 1 | 2 | ||
| IPP1 | PPA11PPA22 | Inorganic pyrophosphatase | C/N | 2 | 2 | ||
| NST1 | STIM11 | Negatively affects salt tolerance | C | 1 | 2 | ||
| TPS3 | Trehalose-6-phosphate synthase | C | 1 | 2 | |||
| UTH1 | Youth | V | 1 | 2 | |||
| YHB1 | NGB1 | Yeast hemoglobin-like protein | C/M | 1 | 2 | ||
| Sterol metabolism | |||||||
| ERG9 | FDFT12 | Ergosterol biosynthesis | C/ER | 1 | 2 | ||
| OSH7 | OSBPL82OSBPL91 | Oxysterol-binding protein homologue | C/N/M | 1 | 2 | ||
| Nucleotide biosynthesis | |||||||
| IRA1 | NF11 | Inhibitory regulator of RAS-cAMP pathway 1 | C/M | 2 | 1 | ||
| IRA2 | NF11 | Inhibitory regulator of RAS-cAMP pathway 2 | C/M | 1 | 4.8 | 4.0, 4.9 | |
| URA2 | CAD1 | Uracil requiring | C/M | 2 | 2 | ||
| UTR1 | NADK3 | Unidentified transcript (NAD kinase) | C/N | 2 | 1 | ||
| Protein transport/modification | |||||||
| BUL1 | Binds ubiquitin ligase | C | 1 | 2 | |||
| CPR5 | PPIB2 | Cyclosporin-sensitive proline rotamase | C/V | 2 | |||
| GVP36 | Golgi vesicle protein | C | 1 | 2 | |||
| PPH21 | PPP2CA2 | Protein phosphatase 21 | C/N | 1 | 2 | ||
| Vacuolar function | |||||||
| VMA1 | ATP6V1A2 | Vacuolar membrane ATPase | C/V | 1 | 2 | ||
| VNX1 | Vacuolar Na+/H+ exchanger | C/ER | 1 | 2 | |||
| Unknown | |||||||
| JIP4 | Jumonji domain–interacting protein | M | 1 | 2 | |||
HIS-tagged full-length (pJG858) or ΔN692Psk1 (pJG960), as well as full-length FLAG (pJG1217) and Myc-tagged Psk1 (pJG1181), were purified in triplicate and associated proteins analyzed by quantitative mass spectrometry. Most of the reported proteins were only present in the Psk1 samples, not the empty vector control, and were identified in at least two of three independent replicates. For abundant proteins found in both samples, the cutoff was set at ≥3.4 times the protein score in the Psk1 sample. Columns indicate the gene symbol, human homologue (database retrieved from 1MIT Isobase, 2NCBI HomoloGene, or 3NCBI Blast), gene name description, cellular localization (from the Saccharomyces Genome Database and FunSpec), number of times the protein was retrieved from the full-length Psk1 sample but not the control, ratio of protein in the full-length HIS-, Myc-, or FLAG-tagged Psk1 compared with control, number of times retrieved from the HIS-tagged ΔN692Psk1 sample but not the control, and the ratio of protein in the ΔN692Psk1 sample compared with control. Proteins retrieved from each purification are either unmarked (HIS), or marked with # (Myc) or † (FLAG). EV, empty vector. For localization: C, cytoplasm; M, mitochondrion; N, nucleus; ER, endoplasmic reticulum; PM, plasma membrane; W, cell wall; V, vacuole; B, Bud. Several ribosomal proteins were also identified in both full-length and ∆N692Psk1 and not in the EV; however, they are excluded from the list due to their high abundance in the cell, which makes them likely false positives (RPL10, RPL15A, RPL15B, RPL1A, RPL1B, RPL29, RPL7A, RPL7B, RPP0, RPS17A, RPS17B, RPS18A, RPS18B, RPS19A, RPS19B, RPS24A, RPS3, and RPS7A).
The Y2H screen retrieved all novel binding partners, whereas the copurification screens retrieved both expected and novel binding partners. The copurification screen retrieved several proteins known to regulate PAS kinase or interact with Ugp1, the only well-characterized Psk1 substrate. The Snf1 protein kinase, master commander of the shift from respiration to fermentation in yeast (for recent reviews see Hardie, 2007; Hedbacker and Carlson, 2008), and its β subunits Gal83 and Sip2 were all identified with significance in both the HIS-tagged full-length and ΔN692Psk1 samples. The Snf1 protein kinase is necessary and sufficient for Psk1 activation by carbon sources that stimulate respiration (Grose et al., 2007). We recently validated this direct interaction between Psk1 and Gal83 via the yeast two-hybrid (unpublished data). The Ssd1 protein was also identified in both the HIS-tagged full-length and ΔN692Psk1 samples and was recently shown to interact with phosphorylated Ugp1 (Cardon and Rutter, 2012).
Only two of the putative Psk1 binding partners were identified in both screens (Pbp1 and Prb1). This incongruous result is not surprising, given the diverse strengths of each approach, as previously reported (Rajagopala et al., 2012). Copurification is likely to yield larger protein complexes, whereas the Y2H primarily identifies direct protein–protein interactions. Neither the Y2H or copurification screens identified Ugp1, the well-characterized PAS kinase substrate. For the Y2H, this may be explained by the inability of PAS kinase to phosphorylate epitope-tagged Ugp1 (Smith and Rutter, 2007). For the copurification screen, Ugp1 was abundant in all of the samples (both the Psk1 samples and the control) due to its high abundance in the cell and did not pass our stringent cutoff. In addition to the proteins reported in Table 3, all Psk1 copurification constructs retrieved various ribosomal proteins (see the footnote to Table 3). This may also be due to the high expression of ribosomal proteins in yeast cells. Further work is needed to verify these putative binding partners.
Validation of the Psk1 interactome through in vitro kinase assays
The Psk1 interactome may include Psk1 substrates, proteins that regulate Psk1 activity, or proteins present in a larger complex. To identify novel Psk1 substrates, 25 random putative binding partners were expressed in bacteria, purified, and evaluated by in vitro kinase assays with radiolabeled ATP (Figure 2). Thirty-eight putative Psk1 binding partners were randomly chosen for this analysis; however, 13 did not express well for purification.
FIGURE 2:

Evidence for in vitro phosphorylation of Psk1 binding partners. A subset of 25 Psk1 binding partners was expressed and purified from E. coli BL21 cells and then assayed for in vitro phosphorylation by Psk1. (A) Utr1, Osh7, Cbf1, and Zds1 were shown to be phosphorylated by Psk1 in vitro. (B) Mot3 displayed faint bands with full-length Psk1 and was confirmed as an in vitro Psk1 substrate using a hyperactive Psk1 truncation (∆N931Psk1). (C) Cbf1, Utr1, Zds1, and Mot3 were verified as Psk1 substrates using a kinase-dead mutant (Psk1-D1230A). For kinase assays, purified proteins were incubated with radiolabeled ATP (32P) in the presence or absence of purified Psk1. Kinase reactions were visualized on 8 or 12% SDS–PAGE gels, stained with Coomassie brilliant blue (CB), and exposed on x-ray film.
Psk1 directly phosphorylated Cbf1, Mot3, Osh7, Zds1, and Utr1 (Figure 2A). The phosphorylation of Mot3 was faint, so we purified the truncated, hyperactive Psk1 and verified phosphorylation (Figure 2B). Other binding partners were also assayed using this truncation but were not phosphorylated (unpublished data), suggesting that the truncated kinase is specific for its substrates.
To show Psk1 dependence and rule out contaminating kinases, a kinase-dead mutant of Psk1 (D1230A) was designed and constructed. This mutation is predicted to abolish the terminal hydrogen–accepting aspartic acid in the canonical kinase domain from sequence alignment with PKA (Taylor et al., 2004). The D1230A mutant expressed well and displayed no detectable kinase activity, as assessed by both in vitro kinase assays using Ugp1 (Figure 2C) and in vivo activity assays (Grose et al., 2009) for suppression of Ugp1 toxicity (unpublished data). Four of the five in vitro substrates (Cbf1, Mot3, Zds1, and Utr1) were Psk1 dependent (Figure 2C). Osh7 was phosphorylated by both wild-type and kinase-dead constructs, suggesting a contaminating kinase activity that masks Psk1 activity.
Bioinformatic analysis of the Psk1 interactome revealed both known and novel functions
FunSpec (Robinson et al., 2002) was used to reveal the basic processes of Psk1 function. FunSpec determines the number of proteins within a set that belong to each Gene Ontology (GO) process and calculates the probability of these proteins being coidentified, given a random pool of the yeast gene products. Thirty-one different GO processes were significantly enriched (p < 0.05) in our interactome (Figure 3A). These processes identified pathways that regulate Psk1, as well as pathways in which Psk1 is likely to function. The most significant process enriched includes the Snf1 kinase, which was been mentioned earlier in this article as necessary and sufficient for Psk1 activation (Grose et al., 2007). In fact, the Snf1 kinase (or subunits Gal83 and Sip2) are found in five of the enriched GO processes: signal transduction (p = 7.256e−06), replicative cell aging (p = 2.081e−03), cell adhesion (p = 3.936e−03), the regulation of complex formation (p = 3.936e−03), and the negative regulation of translation (p = 8.206e−03).
FIGURE 3:

Enrichment of GO processes and cellular localization for the putative Psk1 binding partners. (A) GO processes enriched in the Psk1 interactome with corresponding p-values from FunSpec (Robinson et al., 2002) analysis. Putative Psk1 binding partners belonging to each process are provided above the bar. GO process names are simplified due to space constraints, and abbreviations include signal transduction (sig. trans.) and negative regulation (neg. reg.). (B) FunSpec analysis reveals enrichment of proteins localized to the cytoplasm and mitochondria. Percentage of proteins from the Psk1 interactome and corresponding p-values are reported. Of the 93 putative binding partners, eight were not enriched in either the cytoplasm or mitochondria and were placed in an “other” category.
The related processes of glucose metabolism (p = 1.37e−05, including the GLK1, HXK2, TDH2, TDH3, and STD1 proteins), glycolysis (p = 5.829e−04, including the GLK1, HXK2, TDH2, and TDH3 proteins), and glucose import (p = 5.834e−04, including the GLK1 and HXK2 proteins) were all enriched due to these related proteins. TDH2 and TDH3 are also involved in the reactive oxygen species metabolic process (p = 1.156e−03), and GLK1 and HXK2 also function in the mannose metabolic process (p = 1.156e−03). Mannose biosynthesis is related to the known role of Psk1 in the regulation of β-1,6 glucan biosynthesis (Rutter et al., 2002; Smith and Rutter, 2007; Grose et al., 2009). Specifically, PAS kinase–deficient yeast display decreased β-1,6 glucan levels, increased sensitivity to cell wall–disturbing agents (Smith and Rutter, 2007), and increased glycogen accumulation (Rutter et al., 2002). In addition, there were six processes in which IRA1/IRA2 function was also enriched, including the positive regulation of RAS GTPase (p = 5.834e−04). These proteins are also involved in the regulation of glycogen and trehalose biosynthesis (Chvojka et al., 1981).
The processes of ATP metabolism and ATP hydrolysis–coupled protein transport were also enriched (p = 1.071e−05 and 1.594e−03, respectively) and include the ATP1, ATP2, and VMA1 proteins that are critical for ATP synthesis. In addition, the interactome supports a mitochondrial role for Psk1, in that the proteins are enriched for mitochondrial targets (Figure 3B). A mitochondrial role for Psk1 would be novel but consistent with the hypermetabolic phenotype of PAS kinase–deficient mice. Specifically, they consume more O2 and release more CO2 than their wild-type littermates, suggesting increased respiration rates (Hao et al., 2007).
We were surprised that none of the pathways identified by FunSpec were lipid pathways, because of the dramatically altered liver triglyceride accumulation seen in PAS kinase–deficient mice (Hao et al., 2007) and because the yeast Psk1 interactome is enriched with proteins that have a human homologue (Tables 2 and 3). Approximately 73% of the putative Psk1 binding partners appear to have a human homologue, whereas only 20–30% of the yeast proteome is reportedly conserved from yeast to humans (Makino and McLysaght, 2012). This fact was used to identify lipid-related proteins using the Human Protein Reference Database (www.hsls.pitt.edu/obrc/index.php?page=URL1055173331). Diseases associated with human homologues of the interactome proteins revealed several involved in cholesterol/triglyceride homeostasis and cardiac disease (Table 4).
TABLE 4:
Diseases associated with PAS kinase binding partners reveal a trend toward cardiac/lipid-related disease.
| Yeast gene | Human homologue | Associated disease |
|---|---|---|
| Cardiac/lipid-related | ||
| CBF1 | USF1 | Familial combined hyperlipidemia |
| GAL2 | SLC2A10 | Arterial tortuosity syndrome |
| IRA1 | NF1 | Neurofibromatosis-Noonan syndrome |
| IRA2 | NF1 | Neurofibromatosis-Noonan syndrome |
| MIR1 | SLC25A3 | Mitochondrial phosphate carrier deficiency |
| MYO1 | MYH11 | Familial thoracic aortic aneurysm |
| PRB1 | PCSK9 | Familial hypercholesterolemia |
| Blood/anemia | ||
| HXK2 | HK1 | Hexokinase deficiency hemolytic anemia |
| MYO1 | MYH9 | May-Hegglin anomaly |
| Cancers | ||
| IRA1 | NF1 | Juvenile myelomonocytic leukemia |
| IRA2 | NF1 | Juvenile myelomonocytic leukemia |
| Other | ||
| CAR2 | OAT | Gyrate atrophy |
| CYS3 | CTH | Cystathioninuria |
| DPM1 | DPM1 | Congenital disorder of glycosylation type Ie |
| PBP1 | ATXN2 | Spinocerebellar ataxia 2 |
| YFR006W | PEPD | Prolidase deficiency |
Each of the human homologues identified for the yeast Psk1 interactome was screened for association with human diseases using the Human Protein Reference Database. The columns indicate the original yeast gene retrieved in the Psk1 interactome study, the gene name of its human homologue, and the name of the associated disease. All associations retrieved are shown.
Mapping and in vitro verification of Cbf1 phosphosites
Cbf1/USF1 became the focus of this study due to its ability to be phosphorylated in vitro by Psk1 and its association with the two major mammalian PAS kinase phenotypes (namely, lipid biosynthesis and mitochondrial metabolism). Cbf1 was first identified as a centromere-binding factor (Bram and Kornberg, 1987; Baker et al., 1989; Cai and Davis, 1990) and has since been shown to regulate the expression of genes involved in methionine biosynthesis (Cai and Davis, 1990; Thomas et al., 1992; Kuras and Thomas, 1995; Kuras et al., 1996, 1997), phosphate metabolism (O'Connell and Baker, 1992; Zhou and O'Shea, 2011; Aow et al., 2013), and lipid biosynthesis (Kolaczkowski et al., 2004). Recent evidence suggests that Cbf1 is also a major player in controlling the expression of genes involved in mitochondrial respiration (Petti et al., 2012; Haynes et al., 2013; Lin et al., 2013).
A putative protein kinase substrate is often validated by several approaches, including phosphosite mapping and mutation, followed by genetic epistasis experiments (Johnson and Hunter, 2005). The Psk1-dependent Cbf1 phosphorylation sites were mapped by in vitro kinase assays, followed by mass spectrometry. Five phosphorylation sites were detected with confidence (Figure 4A). The five putative phosphosites were mutated to alanine (T211A/T212A and T154A/S156A in combination and T138A singly), and proteins were reassessed for Psk1-dependent phosphorylation via in vitro kinase assays (Figure 4B). The T211A/T212A protein displayed a dramatic decrease in Psk1-dependent phosphorylation. The relevance of these Cbf1 phosphorylation sites requires in vivo analysis and is assessed later by determining the effects of phosphorylation on Cbf1 activity. The other phosphosites (T138, T154, and S156) are most likely secondary sites that get phosphorylated after the primary site and may be artifacts of in vitro phosphorylation.
FIGURE 4:

In vitro and in vivo evidence for the Psk1-dependent phosphorylation of Cbf1 at T211/T212. (A) Mass spectrometry of Cbf1 phosphorylated in vitro revealed five Psk1-dependent phosphorylation sites (T138, T154, S156, T211, and T212) that are indicated on a diagram, along with the conserved helix-loop-helix (HLH) domain. (B) In vitro kinase assays using purified wild type and mutant Cbf1 (T211A/T212A, T138A, and T154A/S156A) reveal T211/T212 as necessary sites for Psk1-dependent phosphorylation. Kinase assays were run with radiolabeled ATP (32P), visualized on 12% SDS–PAGE gels, stained with Coomassie brilliant blue (CB; bottom), and exposed on x-ray film (top). (C–F) In vivo evidence for Psk1-dependent respiratory inhibition through the phosphorylation and inactivation of Cbf1. (C) PSK-deficient yeast (JGY1244) display increased respiration rates, whereas CBF1-deficient (JGY1227) or CBF1PSK-deficient (JGY1261) yeast display decreased rates. (D) Overexpression of PSK1 (JGY1241) causes a significant decrease in respiration rates. (E) Yeast harboring Cbf1-T211A/T212A (JGY1263) display dramatically increased respiration rates compared with yeast harboring wild type (JGY1265) or Cbf1-T154A/S156A (JGY1264). Routine respiration (R) was determined by measuring O2 consumption using an Oroboros O2K Oxygraph in the absence of substrate and then with glucose (20 mM), ethanol (2%), or in the presence of the uncoupler carbonyl cyanide p-(trifluoro-methoxy) phenylhydrazine (FCCP; 70 μM). OD600 was taken to ensure equal growth among strains. (F) Phosphosite mutants were expressed in yeast and analyzed by Western blot to ensure equal expression.
Evidence for Psk1-dependent respiratory inhibition through the phosphorylation and inactivation of Cbf1
To determine the effects of Cbf1 and Psk1-dependent phosphorylation on yeast respiration rates, mitochondrial function was assessed in CBF1- and/or PSK- deficient yeast. Yeast have two PAS kinase homologues that are both able to phosphorylate Ugp1, and hence respiration rates were determined in the double knockout (psk1psk2 or PSK-deficient yeast) to abolish any overlapping function. As predicted, CBF1-deficient yeast displayed a significant decrease in respiration, whereas PSK-deficient yeast displayed a dramatic increase (Figure 4C). To our knowledge, this is the first demonstration of the effects of CBF1 or PSK1 on respiration rates. To test whether the respiratory stimulation seen in PSK-deficient yeast was dependent on the phosphorylation and inhibition of Cbf1, respiration was also assessed in CBF1PSK-deficient yeast. The cbf1 mutant was epistatic to the psk1psk2 mutant, in that the respiration rates of CBF1PSK-deficient yeast mirrored those of CBF1-deficient yeast. These results support the PSK1-dependent regulation of respiration through the phosphorylation and inhibition of Cbf1. As further evidence, overexpressing PSK1 results in a significant inhibition of respiration (Figure 4D).
To assess the in vivo significance of the T211/T212 phosphorylation sites, respiration rates were determined for CBF1-deficient yeast expressing either wild type or Cbf1-T211A/T212A. Yeast expressing Cbf1-T211A/T212A display a dramatic increase in respiration (Figure 4E), consistent with the disruption of both phosphorylation and subsequent inhibition by Psk1. In contrast, yeast expressing Cbf1-T154A/S156A had rates similar to wild type, supporting in vitro evidence that these sites are either secondary phosphorylation sites or in vitro artifacts. Each strain bearing a phosphosite mutant was analyzed by Western blot to ensure equal growth among strains (Figure 4F). Phosphomimetic mutants (in which the phosphorylated threonine residue was replaced with either a glutamic [T211E/T212E] or aspartic acid residue [T211D/T212D]) were constructed and assayed in an otherwise cbf1− strain; however, they behaved like the wild-type protein (unpublished data). This inability to mimic the phosphorylation state was also previously observed for Ugp1 (Rutter et al., 2002).
DISCUSSION
Despite the clear importance of PAS kinase in eukaryotic glucose homeostasis, only one substrate has been well-characterized in yeast (Ugp1; Rutter et al., 2002; Smith and Rutter, 2007; Grose et al., 2007) and five putative substrates reported in mammalian cells: glycogen synthase (Wilson et al., 2005), PDX-1 (An et al., 2006), S6 (Schlafli et al., 2011), GSK3β (Semache et al., 2013), and elongation factor 1 (Eckhardt et al., 2007). This study describes the first global interactome for PAS kinase, identifying 93 novel putative binding partners and expanding the role of PAS kinase in glucose homeostasis, including new pathways involved in mitochondrial metabolism. In addition, the interactome suggests novel roles for PAS kinase in cell growth (gene/protein expression, replication/cell division, and protein modification and degradation), vacuole function, and stress tolerance.
The Psk1 interactome could contain Psk1 substrates, regulators of its function, or proteins belonging to a larger complex that were present in the copurification. Each putative binding partner will require subsequent characterization to determine its relationship to Psk1. In this study the interactome was validated by the identification of proteins already known to be related to Psk1, the verification of four putative binding partners as in vitro substrates, and the detailed in vivo and in vitro characterization of one substrate, Cbf1.
The interactome is supported by enrichment of binding partners previously associated with PSK1. FunSpec (Robinson et al., 2002) analysis revealed significant enrichment of several GO processes in which Snf1 is a player (Figure 3). Snf1 protein kinase is necessary and sufficient for Psk1 activation by carbon sources that stimulate respiration (Grose et al., 2007). This evidence of a protein–protein interaction between Psk1, Snf1, Gal83, and Sip2 implies direct phosphorylation and activation by Snf1, which is the subject of a research article in preparation. In addition, several processes were enriched that are linked to glycogen and cell wall biosynthesis. PAS kinase–deficient yeast display decreased β-1,6 glucan levels, increased sensitivity to cell wall–disturbing agents (Smith and Rutter, 2007), and increased glycogen accumulation (Rutter et al., 2002). This phenotype is dependent on the lack of PAS kinase–dependent phosphorylation of Ugp1; however, the results from this study suggest involvement of additional proteins in a concerted effort to shunt glucose toward cell wall biosynthesis. Another binding partner identified in our study, Ssd1, has been shown to interact with phospho-Ugp1 in order to suppress TOR2 deficiency (Cardon and Rutter, 2012). Because TOR2 is involved in regulating cell growth in response to nutrients (for a recent review see Loewith and Hall, 2011), this suppression posits a progrowth role for yeast PAS kinase, which has been shown to be a positive regulator of protein synthesis (Rutter et al., 2002). Many of the Psk1 binding partners identified in this study are involved in cell growth and division, predicting key targets for future study.
In addition to bioinformatic verification, in vitro kinase assays using 25 random binding partners suggests that 16% of the interactome represent substrates of Psk1. Four of the 25 proteins displayed clear, Psk1-dependent phosphorylation (Cbf1, Utr1, Mot3, and Zds1). This estimate may be low since proteins overexpressed and purified from bacteria may misfold, accessory proteins may be missing, or assay conditions may not be optimal. In fact, previous kinase substrates have been shown to only be phosphorylated when truncated, as reported for Psk2 and its putative substrate Sro9 (Rutter et al., 2002). Such truncations may trap the protein in a conformation found in vivo. In vitro artifacts such as these mean that in vitro substrates must be confirmed through in vivo methods. Further study of Cbf1 provided in vivo confirmation of the interactome.
Bioinformatic analysis of the protein interactome (Figure 3 and Table 4), combined with the hypermetabolic and hyperlipidomic phenotypes of PAS kinase-deficient mice, suggested a focus on Cbf1. Further investigation showed that CBF1-deficient yeast display decreased respiration rates, whereas PSK-deficient yeast display increased rates (Figure 4). In addition, cbf1 appears to be epistatic to psk. These results are consistent with direct phosphorylation and inhibition of Cbf1 by Psk1. Further evidence is provided for the direct in vitro phosphorylation of Cbf1 at T211/T212, as well as the dramatic increase in the respiration rates of yeast expressing an unphosphorylatable mutant, Cbf1-T211A/T212A. Although Cbf1 had been reported to increase the expression of genes involved in respiratory metabolism (Lin et al., 2013; Petti et al., 2012; Haynes et al., 2013), to our knowledge this study is the first to demonstrate its effects on respiration rates. Because PAS kinase–deficient mice have a higher rate of O2 consumption and CO2 production (Hao et al., 2007) and there is a conserved CBF1 homologue in mammals (USF1), these results may shed valuable insight into the mechanisms of mammalian respiratory regulation. Although no role in respiration has been reported for USF1, USF1 plays a major role in regulating lipid biosynthesis in mammals (Pajukanta et al., 2004; Naukkarinen et al., 2006; Auer et al., 2012). The phosphorylation of USF1 by PAS kinase may also explain the decreased hepatic lipid accumulation seen in PAS kinase–deficient mice (Hao et al., 2007).
The findings from this study support a model in which yeast PAS kinase is regulating multiple pathways in order to direct glucose metabolites toward the biosynthesis of structural components necessary for cell growth (Figure 5). PAS kinase has been shown to phosphorylate Ugp1 to direct UDP-glucose utilization away from glycogen biosynthesis and toward the biosynthesis of structural carbohydrates such as β-glucans (Rutter et al., 2002; Smith and Rutter, 2007; Grose et al., 2007, 2009). At the same time, the inhibitory Psk1-dependent phosphorylation of Cbf1 would decrease respiration, leading to a further diversion of glucose toward structural carbohydrates necessary for growth.
FIGURE 5:
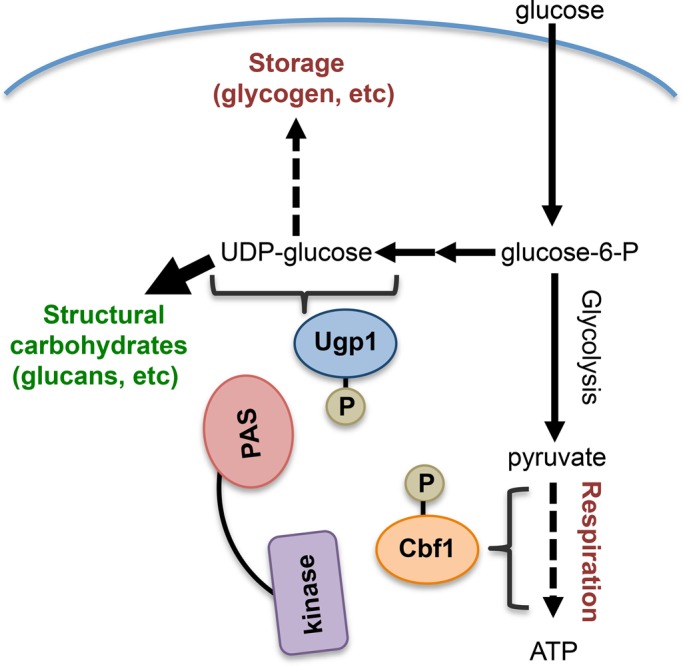
A model for the role of PAS kinase in regulating glucose allocation. The PAS kinase–dependent phosphorylation of Ugp1 directs UDP-glucose utilization away from glycogen biosynthesis and toward the biosynthesis of structural carbohydrates such as β-glucans (Rutter et al., 2002; Smith and Rutter, 2007; Grose et al., 2007, 2009). The inhibitory phosphorylation of Psk1 on Cbf1 decreases respiration, which may lead to a further diversion of glucose toward structural carbohydrates necessary for growth. Dashed lines indicate inhibition of a pathway, and thick lines indicate activation.
The results of this study provide insight into the cellular mechanisms for regulating glucose allocation in eukaryotic cells. In addition to expanding our knowledge of yeast PAS kinase, the Psk1 interactome may be used to identify novel substrates for the mammalian homologue. Approximately 73% of the interactome is conserved from yeast to humans, including proteins involved in glucose homeostasis, a process known to be regulated by PAS kinase in mice (Hao et al., 2007) and humans (da Silva Xavier et al., 2011; MacDonald and Rorsman, 2011; Semplici et al., 2011). Because human PAS kinase is a putative therapeutic target, identifying and characterizing PAS kinase binding partners may yield more narrow therapeutic strategies, as well as predict unknown cellular effects.
MATERIALS AND METHODS
Yeast cells, plasmids, and culture media
A list of strains, plasmids, and primers used in this study is given in Table 5. All restriction enzymes were purchased from New England Biolabs (NEB, Ipswich, MA). Deletion mutant and chromosomal-integrated epitope-tagged strains were created by standard PCR-based homologous recombination methods (Longtine et al., 1998). Psk1 Y2H bait plasmids were constructed by PCR amplification of Psk1 truncations previously isolated (Grose et al., 2009) and subsequent cloning into the EcoRI/Pst1 sites of pGBDC2 (pJG425). The plasmid for overexpression and purification of HIS-tagged yeast Psk1 (pJG858) was made by PCR amplifying the GAL1-10 promoter with primers JG2894 and JG2895, then transforming the product into yeast along with SpeI-digested pJG232 to replace the Psk1 promoter through homologous recombination. The empty HIS-tagged vector (pJG859) was constructed by annealing primers JG2901 and JG2902 and transforming into yeast along with EcoRI/XhoI-digested pJG858. Myc-tagged yeast expression vectors (pJG1181 and pJG1183) were made by PCR amplifying the Myc tag with primers JG3422 and JG3423, digesting, and cloning into pJG858 and pJG859 (XhoI/SphI) to replace the HIS tag. FLAG-tagged yeast expression vectors (pJG1217 and pJG1218) were made by annealing overlapping primers JG3522 and JG3523 and ligating into the XhoI/SphI sites of pJG858 and pJG859 to replace the HIS tag.
TABLE 5:
Strains, plasmids, and primers.
| Strain | Background | Genotype | Abbreviation | a/α | Reference or source | |
| JGY1 | W303 | ade2-1 can1-100 his3-11,15 leu2-3112 trp1-1 ura3-1 | WT | a | David Stillman, University of Utah | |
| JGY4 | W303 | psk1::his3 psk2::kan-MX4 leu2, lys2, met15, trp1, ura3 | psk1psk2 | a | Grose et al. (2007) | |
| JGY8 | JK9 | leu2-3112 ura3-52 rme1 trp1 his4 GAL+ HMLa | WT | a | Michael Hall, University of Basel | |
| JGY43 | BY4741 | His3D1 leu2D0 met15D0 ura3D0 | WT | a | Winzeler et al. (1999) | |
| Y2H Gold (JGY1031) | LYS2::GAL1UAS-GAL1TATA-His3 GAL2UAS-Gal2TATA-Ade2 URA3::MEL1UAS-MEL1TATA, AUR1-CMEL1, ura3-52, his3-200, ade2-101, trp1-901, leu2-3, 112, gal4del, gal80del, met- | Y2H Gold | a | Clontech | ||
| JGY1241 | BY4741 | pJG858 into JGY43 | PSK1OE | a | This study | |
| JGY1242 | BY4741 | pJG859 into JGY43 | EV | a | This study | |
| Y187 (JGY1073) | URA3::GAL1-GAL1-LacZ, MEL1, ura3-52, his3-200, ade2-101, trp1-901, leu2-3, 112, gal4del, gal80del, met- | Y187 | α | Clontech | ||
| JGY1074 | pGADT7 Mate and Plate stationary phase YPAD library in JGY1073 | YPAD library | α | This study | ||
| JGY1098 | pGADT7 Mate and Plate mid-log YPAGal library in JGY1073 | YPAGal library | α | This study | ||
| JGY1099 | pJG598 (ΔN692Psk1) in JGY1031 (Y2H Gold) | ΔN692Psk1 | a | This study | ||
| JGY1227 | BY4741 | cbf1::kan-MX4 his3-1, leu2-0, met15-0, ura3-0 | cbf1 | a | Winzeler et al. (1999) | |
| JGY1261 | BY4741 | psk2::nat-MX4 psk1::hph-MX4 cbf1::kan-MX4 his3-1, leu2, met15, ura3 | psk1psk2cbf1 | a | This study | |
| JGY1262 | BY4741 | pJG725 (EV) into JGY1227 | cbf1 pEV | a | This study | |
| JGY1263 | BY4741 | pJG1122 (CBF1-T211A/T212A) into JGY1227 | pCBF1-T211A/T212A | a | This study | |
| JGY1264 | BY4741 | pJG1123 (CBF1-T154A/S156A) into JGY1227 | pCBF1-T154A/S156A | a | This study | |
| JGY1265 | BY4741 | pJG1125 (CBF1) transformed into JGY1227 | pCBF1 | a | This study | |
| JHG504 | BL21DE3 | F− ompT hsdSB(rB−mB−) gal dcm (DE3) | BL21 | Novagen | ||
| Plasmid | Gene | Description | Backbone | Yeast origin | Selection | Reference or source |
| pJG232 | PSK1 | C-terminal HIS/HA-tagged PSK1 | pRS426 | 2u | URA | Jared Rutter, University of Utah |
| pJG410 | PSK1 | PSK1-D1230A in pJG232 | pRS426 | 2u | URA | This study |
| pJG421 | EV | pGAD-C1 empty Y2H prey vector | YEp-GAD | 2u | LEU | James et al. (1996) |
| pJG422 | EV | pGAD-C2 empty Y2H prey vector | YEp-GAD | 2u | LEU | James et al. (1996) |
| pJG423 | EV | pGAD-C3 empty Y2H prey vector | YEp-GAD | 2u | LEU | James et al. (1996) |
| pJG425 | EV | pGBD-C2 empty Y2H bait vector | YEp-GAD | 2u | TRP | James et al. (1996) |
| pJG427 | Library | pGAD-C1 genomic library | YEp-GAD | 2u | LEU | James et al. (1996) |
| pJG428 | Library | pGAD-C2 genomic library | YEp-GAD | 2u | LEU | James et al. (1996) |
| pJG429 | Library | pGAD-C3 genomic library | YEp-GAD | 2u | LEU | James et al. (1996) |
| pJG441 | PSK1 | Full-length PSK1 in pJG425 | YEp-GBD | 2u | TRP | This study |
| pJG549 | EV | pGADT7 empty Y2H prey vector | pGADT7 | 2u | LEU | Clontech |
| pJG568 | PSK1 | ΔN931Psk1 in pJG425 | YEp-GBD | 2u | TRP | This study |
| pJG598 | PSK1 | ΔN692Psk1 in pJG425 | YEp-GBD | 2u | TRP | This study |
| pJG725 | EV | pAdh-myc | pRS416 | CEN | URA | This study |
| pJG858 | PSK1 | pGAL1-10, PSK1-HIS/HA | pRS426 | 2u | URA | This study |
| pJG859 | EV | pGAL1-10, HIS/HA | pRS426 | 2u | URA | This study |
| pJG960 | PSK1 | ΔN692Psk1-HIS/HA in pJG858 | pRS426 | 2u | URA | This study |
| pJG1000 | PSK1 | ∆N931Psk1-HIS/HA in pJG858 | pRS426 | 2u | URA | This study |
| pJG1001 | PBP1 | ΔN355Pbp1 from library pJG427 | YEp-GAD | 2u | LEU | This study |
| pJG1005 | PSK1 | ΔN477Psk1 in pJG425 | YEp-GBD | 2u | TRP | This study |
| pJG1006 | PSK1 | ΔN694Psk1 in pJG425 | YEp-GBD | 2u | TRP | This study |
| pJG1009 | EV | pET15b with James Y2H MCS | pET15b | AMP | This study | |
| pJG1012 | GLK1 | GLK1 into pET15b (pJG1009) | pET15b | AMP | This study | |
| pJG1013 | GND1 | GND1 into pET15b (pJG1009) | pET15b | AMP | This study | |
| pJG1014 | AHP1 | AHP1 into pET15b (pJG1009) | pET15b | AMP | This study | |
| pJG1015 | PBP1 | PBP1 into pET15b (pJG1009) | pET15b | AMP | This study | |
| pJG1017 | UTR1 | UTR1 into pET15b (pJG1009) | pET15b | AMP | This study | |
| pJG1021 | CYS3 | CYS3 into pET15b (pJG1009) | pET15b | AMP | This study | |
| pJG1022 | GCD14 | GCD14 into pET15b (pJG1009) | pET15b | AMP | This study | |
| pJG1023 | SAP30 | SAP30 into pET15b (pJG1009) | pET15b | AMP | This study | |
| pJG1024 | STD1 | STD1 into pET15b (pJG1009) | pET15b | AMP | This study | |
| pJG1025 | IPP1 | IPP1 into pET15b (pJG1009) | pET15b | AMP | This study | |
| pJG1026 | MTH1 | MTH1 into pET15b (pJG1009) | pET15b | AMP | This study | |
| pJG1030 | HAP2 | HAP2 into pET15b (pJG1009) | pET15b | AMP | This study | |
| pJG1031 | CBF1 | CBF1 into pET15b (pJG1009) | pET15b | AMP | This study | |
| pJG1032 | ZDS1 | ZDS1 into pET15b (pJG1009) | pET15b | AMP | This study | |
| pJG1033 | MOT3 | MOT3 into pET15b (pJG1009) | pET15b | AMP | This study | |
| pJG1035 | NOB1 | NOB1 into pET15b (pJG1009) | pET15b | AMP | This study | |
| pJG1041 | YAP6 | YAP6 into pET15b (pJG1009) | pET15b | AMP | This study | |
| pJG1054 | OSH7 | OSH7 into pET15b (pJG1009) | pET15b | AMP | This study | |
| pJG1057 | CAR2 | CAR2 into pET15b (pJG1009) | pET15b | AMP | This study | |
| pJG1059 | ERG9 | ERG9 into pET15b (pJG1009) | pET15b | AMP | This study | |
| pJG1063 | PRB1 | PRB1 into pET15b (pJG1009) | pET15b | AMP | This study | |
| pJG1074 | ATP2 | ATP2 into pET15b (pJG1009) | pET15b | AMP | This study | |
| pJG1078 | MRM1 | MRM1 into pET15b (pJG1009) | pET15b | AMP | This study | |
| pJG1079 | HXK2 | HXK2 into pET15b (pJG1009) | pET15b | AMP | This study | |
| pJG1081 | PAB1 | PAB1 into pET15b (pJG1009) | pET15b | AMP | This study | |
| pJG1111 | CBF1 | CBF1-T211A/T212A in pET15b | pET15b | AMP | This study | |
| pJG1112 | CBF1 | CBF1-T138A in pET15b | pET15b | AMP | This study | |
| pJG1113 | CBF1 | CBF1-T154A/S156A in pET15b | pET15b | AMP | This study | |
| pJG1122 | CBF1 | pAdh-Myc-CBF1-T211A/T212A | pRS416 | 2u | URA | This study |
| pJG1123 | CBF1 | pAdh-Myc-CBF1-T154A/S156A | pRS416 | 2u | URA | This study |
| pJG1170 | PSK1 | pGAL1-10-PSK1-D1230A-HIS/HA | pRS426 | 2u | URA | This study |
| pJG1181 | PSK1 | pGAL1-10-PSK1-Myc | pRS426 | 2u | URA | This study |
| pJG1183 | EV | pGAL1-10-Myc | pRS426 | 2u | URA | This study |
| pJG1217 | PSK1 | pGAL1-10-PSK1-FLAG | pRS426 | 2u | URA | This study |
| pJG1218 | EV | pGAL1-10-FLAG | pRS426 | 2u | URA | This study |
| Primer | Sequence | |||||
| JG2228 | CCAGGGTATTGTTCACAGAGCTATCAAGGATGAGAATGTTA | |||||
| JG2229 | TAACATTCTCATCCTTGATAGCTCTGTGAACAATACCCTGG | |||||
| JG2894 | CAAGCGCGCAATTAACCCTCACTAAAGGGAACAAAAGCTGGAGCTCCACCGCGGTGGCGGCCGCTCTAGAACTACAATTCGACAGGTTATCAGCAAC | |||||
| JG2895 | CTTTAACGTCAAGGAGAAAAAACCCGAATTCATGCCCTACATCGGTGCTTCCAACCTCTCAGAACATTCATTTGTTAATTTGAAGGAAAAACATGCGAT | |||||
| JG2901 | TTAATATACCTCTATACTTTAACGTCAAGGAGAAAAAACCCGAATTCATGCCTCGAGGATCCCACCACCATCATCATCACGGATACCCGTATGATGTTCC | |||||
| JG2902 | GGAACATCATACGGGTATCCGTGATGATGATGGTGGTGGGATCCTCGAGGCATGAATTCGGGTTTTTTCTCCTTGACGTTAAAGTATAGAGGTATATTAA | |||||
| JG3173 | TATGGAATTCCCCGGGGGATCCATCGATGT | |||||
| JG3174 | AATTTCAGTCAGTCAAGATCTCTGCAGGTCGACATCGATGGATCCCCCGGGGAATTCCA | |||||
| JG3356 | GACTCCTTCATTTGATGGGGCTATGGCTCTTTCCCC | |||||
| JG3357 | GGGGAAAGAGCCATAGCCCCATCAAATGAAGGAGTC | |||||
| JG3375 | GTAGATTCCATTGGTGGCAGACGCCATTCCCTCCAGGGAGG | |||||
| JG3376 | CCTCCCTGGAGGGGAATGGCGTCTGCACCAATGGAATCTAC | |||||
| JG3422 | GGCCTCGAGGTGGTGGAGGAGGTGAACAAAAGCTAATCTCCGAGGAAGAC | |||||
| JG3423 | GGCGCATGCTTAGTGATTGATTAATTTTTGTTCACCGTTC | |||||
| JG3522 | TCGAGGTGATTACAAGGATGACGATGACAAGTAAGCATG | |||||
| JG3523 | CTTACTTGTCATCGTCATCCTTGTAATCACC | |||||
| JG3380 | GTCGTGGAAGAAAACCTGCTGCTTTGGCCACAACAGACG | |||||
| JG3381 | CGTCTGTTGTGGCCAAAGCAGCAGGTTTTCTTCCACGAC | |||||
Plasmids for HIS-tagged expression in bacteria were constructed by expanding the multiple cloning site of pET15b (Novagen, Darmstadt, Germany). This pET15b derivative (pJG1009) was made by annealing overlapping primers JG3173 and JG3174 and ligating into NdeI/BamHI-digested pET15b. For cloning putative substrates, the first 22–28 coding nucleotides were used as a forward primer and the last 22–28 coding nucleotides, including the STOP codon, as a reverse (along with the desired restriction sites). Inserts were amplified using Phusion polymerase (NEB), and either the NdeI/XhoI, BamHI/XhoI, or EcoRI/XhoI restriction sites were used based on the gene sequences (SalI was substituted for XhoI in a few cases when necessary).
The Psk1 kinase-dead and Cbf1 phosphosite mutants were produced by site-directed mutagenesis using Stragene's QuikChange Lightening Site-directed Mutagenesis Kit (Agilent Technologies, Santa Clara, CA). The Psk1-D1230A was made by using pJG232 as template with primers JG2228 and JG2229 to create pJG410. It was then subcloned into pJG858 (BglII/XhoI) for GAL1-10 expression (pJG1170). For Cbf1 phosphosite mutants, pJG1031 was used as template with primers JG3356 and JG3357 for the T138A mutant (pJG1112), primers JG3375 and JG3376 for the T154A/S156A mutant (pJG1113), and primers JG3380 and JG3381 for the T211A/T212A mutant (pJG1111). For medium expression of Cbf1 constructs in yeast, Cbf1 was subcloned from pJG1031, pJG1111, and pJG1113 into a plasmid (pJG725) for expression under the ADH promoter. Yeast were transformed by the lithium acetate method and grown at 30°C in synthetic (SD) medium (0.67% yeast nitrogen base, 2% glucose) with appropriate amino acids or 1% yeast extract, 2% peptone, 2% glucose, and 0.03% adenine (YPAD) and appropriate antibiotics. Alternate carbon sources (galactose or raffinose) were used at 2%. X-α-Gal was used at 20 μg/ml according to manufacturer's directions (Clontech, Mountain View, CA).
Growth assays
Growth assays were performed using saturated overnights serially diluted 1:5 in water. Diluted samples were spotted onto synthetic minimal medium lacking the appropriate amino acid(s) for Y2H selection (SD-Leu-Trp-His-Ade + X-α-Gal). Plates were then incubated at the indicated temperature for 3–7 d. Growth experiments were replicated three to six times, and control spot plates on nonselective media (SD-Leu-Trp) were always grown to ensure even dilution and spotting.
Y2H library generation
For cDNA library construction, yeast strain JGY8 (WT) was grown in either YPAD or YPAGal to stationary phase or mid log, respectively. RNA was extracted using Qiagen's RNeasy Mini Kit (Valencia, CA) followed by removal of Genomic DNA using Turbo rDNase. Full-length cDNA was generated using Clontech's Make Your Own “Mate & Plate” Library System, which uses SMART cDNA synthesis technology, and cloned into pGADT7 recombination vector (pJG549). JGY8 was chosen for library generation due to the wild-type SSD1 genotype (Cardon and Rutter, 2012).
Y2H screens
For genomic library screens, the Y2HGold (Clontech) strain (JGY1031) bearing pJG598 (ΔN692Psk1) was transformed with genomic libraries (pJG427, pJG428, or pJG429) obtained from David Stillman, University of Utah (James et al., 1996). For cDNA library screens, yeast harboring a cDNA Y2H prey library (JGY1074 or JGY1098) were mated to yeast harboring pJG598 (JGY1099) using the standard Matchmaker mating protocol (Clontech). More than 26 million matings were performed and ∼14 million transformations. Colonies that arose on Y2H selection plates (SD-Leu-Trp-His-Ade) were patched to alternate Y2H selection plates (SD-Leu-Trp-His-Ade + X-α-Gal) for phenotype validation using the His, Ade, and Mel1 reporters. The library plasmid inserts were identified by colony PCR with subsequent sequencing (Brigham Young University DNA Sequencing Center) and National Center for Biotechnology Information (NCBI) BLAST analysis (an unambiguous hit with e-value of ≥10e−30). For verification and elimination of false positives, library plasmids were purified from yeast (Amberg et al., 2005), amplified in Escherichia coli (GenElute Plasmid Mini-prep Kit, Sigma-Aldrich, St. Louis, MO), and transformed into naive yeast harboring the bait plasmid (pJG598) or the empty bait plasmid (pJG425). Colonies arising on the SD-Leu-Trp transformation plates were streaked to SD or SGal synthetic media (-Leu-Trp-His-Ade + X-α-Gal) in duplicate and allowed to grow for 3–5 d to test for Psk1 dependence.
HIS, Myc, and FLAG epitope protein purification
Yeast containing a plasmid for HIS-tagged protein expression were grown for 10–12 h in SD-Ura, pelleted, and resuspended in SGal-Ura for 36 h to induce expression from the GAL1-10 promoter. Pelleted yeast were then resuspended in lysis buffer (50 mM 4-(2-hydroxyethyl)-1-piperazineethanesulfonic acid [HEPES], 300 mM NaCl, 20 mM imidazole, 10 mM KCl, 1 mM β-mercaptoethanol, and 1:300 of Sigma-Aldrich Mammalian PICS or Roche (Indianapolis, IN) cOmplete Protease Inhibitor Cocktail Tablet, pH 7.8, with phosphatase inhibitors [50 mM NaF and glycerophosphate when appropriate]) and lysed using the Microfluidics (Westwood, MA) M-110L homogenizer. Cell debris was pelleted at 12,000 rpm for 30 min. Supernates were incubated with 200 μl of nickel-nitriloacetic acid (Ni-NTA) agarose (Qiagen) for 3 h, and beads were washed twice with 15 ml of lysis buffer and then transferred to a column to be washed with 50 ml of lysis buffer. Protein was eluted with 0.3 ml of lysis buffer containing 250 mM imidazole and 100 mM NaCl but lacking protease and phosphatase inhibitor cocktails. Full-length (pJG858) and truncated Psk1 (pJG960) proteins were expressed in JGY1 along with an empty vector control (pJG859) for mass spectrometry analysis. Yeast containing plasmids for FLAG- or Myc-tagged protein expression were prepared similar to the HIS-tagged samples with the following exceptions: FLAG lysis buffer (1× phosphate-buffered saline buffer, 1 mM β-mercaptoethanol, cOmplete Protease Inhibitor Cocktail Tablet, pH 7.4) and Myc lysis buffer (20 mM HEPES, 10 mM KCl, 1 mM EDTA, 1 mM ethylene glycol tetraacetic acid [EGTA], 50 mM NaCl, 10% glycerol, 1 mM β-mercaptoethanol, and cOmplete Protease Inhibitor Cocktail Tablet, pH 7.4). For Myc purification, 50 μl of Myc-tag Sepharose bead conjugate (Cell Signaling, Danvers, MA) was used. For FLAG purification, 50 μl of Protein G Dynabeads (Life Technologies, Grand Island, NY) incubated with monoclonal anti-FLAG antibody (Sigma-Aldrich) was used. Columns were not used for the Myc and FLAG washing steps. The beads were pelleted at 1000 rpm in a centrifuge tube and washed seven times before eluting. Proteins were eluted with 60 μl of trifluoroethanol and then boiled for 5 min for Myc purification and 100 μl of FLAG-peptide diluted in the wash buffer for FLAG purification. Full-length Psk1-FLAG (pJG1217) and Psk1-Myc (pJG1181) were expressed in JGY1 along with their respective empty vector controls (pJG1218 and pJG1183) for mass spectrometry analysis.
Bacterial plasmids containing 38 of the Y2H and copurification hits were cloned into a derivative of pET15b (Novagen) with an altered multiple cloning site to provide diverse restriction enzymes (pJG1009). The resulting pET15b plasmids were sequence verified and transformed into BL21 DE3 cells (Novagen) for expression. Overnights were grown in LB-AMP (lysis buffer with 100 μg/ml ampicilin; Sigma-Aldrich), diluted 1:100 in 500 ml of LB-AMP, and grown at 37°C for 3 h before induction with 0.5 mM isopropyl-β-d-thiogalactoside. Cells were pelleted after 5 h of induction, and proteins were purified using Ni-NTA agarose as described. In some cases these growth conditions inhibited growth or gave high degradation of the protein, in which case lower temperature (30°C) and lower aeration (rpm 80) were required for expression (Cbf1, Hap2, Zds1, Erg9).
Quantitative mass spectrometry
HIS-epitope Psk1 copurification samples were prepared for mass spectrometry using a modified filter-aided sample preparation technique (FASP; Wisniewski et al., 2009). Samples were digested in 30–40 μl of 50 mM ammonium bicarbonate (ReagentPlus Grade; Sigma-Aldrich) with 0.1–2.0 μg of modified sequence-grade trypsin (Promega, Madison, WI) for 4–7 h or overnight at 37°C on the filters. Samples within each replicate were digested with equal quantities of trypsin for equal amounts of time. Samples were acidified to ∼1% formic acid (Optima LC-MS Grade from Fisher Scientific, Pittsbergh, PA) before LC-MS. To increase protein recovery, FLAG- and Myc-tagged PSK1 coimmunoprecipitations were prepared without a filter. Briefly, samples were suspended in 50% 2,2,2-trifluoroethanol (Acros; 99.8%) 25 or 50 mM ammonium bicarbonate (Acros; 99%), reduced with dithiothreitol (Acros; 99%, or Sigma-Aldrich), alkylated with iodoacetamide, dried on a SpeedVac, resuspended in 25 mM ammonium bicarbonate (Acros; 99%), and digested with ∼0.1 μg of trypsin (Promega Sequencing Grade or Pierce MS grade) at 37°C for 6–7 h or overnight. Digestions were quenched with formic acid or phenylmethanesulfonyl fluoride (MP Biomedicals, Santa Ana, CA) trypsin inhibitor. Samples were dried on a SpeedVac and resuspended in 3% acetonitrile/0.1% formic acid. All replicate experiments received the same preparation.
Mass spectral analysis was performed on the Thermo LTQ Orbitrap XL mass spectrometer coupled with the Eksigent NanoLC Ultra. Peptides were eluted from a Waters Peptide Separation Technology C18 column over 90 (for Myc, FLAG, and HIS epitope samples) or 150 min (for one set of HIS replicates) using an acetonitrile/H2O 0.1% formic acid gradient (Optima LC-MS Grade from Fischer Scientific) flowing at 325 nl/min. Peptides were ionized using a nanospray source. MS scans were performed in the Orbitrap at a resolution of 60,000 at 400 m/z. The top 5 or top 10 most abundant species were fragmented in the LTQ with collision-induced dissociation (CID) with a dynamic exclusion repeat count of 1. Charge-state screening was enabled, rejecting charge state 1 and unassigned charge states with monoisotopic precursor selection. Samples within each replicate were analyzed with the same LC-MS parameters.
For phosphosite mapping, Cbf1 underwent similar FASP preparation and mass spectral analysis, with a few exceptions. Samples were digested in 50 mM ammonium bicarbonate with 0.1 μg of trypsin overnight. MS data were collected at a resolution of 30,000 at 400 m/z in the Orbitrap, and the top 10 most abundant species underwent pseudo MS (Perkins et al., 1999) multistage CID in the LTQ with phosphate neutral losses at 32.66, 48.99, and 97.97 Da (Schroeder et al., 2004).
Data analysis was performed with Mascot (Perkins et al., 1999) using Proteome Discover Software versions 1.3 and 1.4. Spectra were searched against the uni_yeast database. Mass deviation in the Orbitrap and ion trap were set to ±10 ppm and ±0.8 Da, respectively. The search allowed two or three maximum missed trypsin cleavages, with the following dynamic modifications: Carbamidomethyl (C), Oxidation (M), Phospho (ST), and Phospho (Y). Peptide confidence was set using the Proteome Discoverer 1.3 or 1.4 medium peptide confidence filter, which decided using percolator (Käll et al., 2007) or the Mascot significance threshold.
Bioinformatic analysis
FunSpec was used to access enrichment of both cellular localization patterns or GO processes in the Psk1 interactome (Robinson et al., 2002). Identification of human homologues was done through searches on NCBI HomoloGene (www.ncbi.nlm.nih.gov/homologene), NCBI protein BLAST (Johnson et al., 2008), and the MIT Isobase database (Park et al., 2011). Our criteria for determining human homologues were as follows: 1) a clear hit in Isobase or NCBI HomoloGene database, 2) an NCBI Blast hit of e−30 or a hit of less homology (e−10) that was small, such as a conserved domain of function, and 3) any questionable Isobase hit had to have some limited homology.
In vitro kinase assays
Purified protein was assayed for in vitro phosphorylation by PAS kinase using radiolabeled ATP (32P; 1–5 μCi) in 30 μl of reaction buffer containing 1× kinase buffer, 0.2 mM ATP, ∼0.5 μg of purified substrate, and ∼0.1 μg of purified full-length Psk1 (pJG858), ∆N931Psk1 (pJG1000), or Psk1-D1230A (pJG1170). Both full-length and ∆N931Psk1 were purified from JGY1, and Psk1-D1230A was purified from JGY4. Assays were run at 30°C for 12 min and were started by the addition of Psk1 and stopped with SDS–PAGE sample buffer. Samples were run on 8 or 12% SDS–PAGE, depending on the size of the protein, stained with Coomassie brilliant blue, and imaged. Gels were then dried and imaged on x-ray film.
Mitochondrial respiration assays
Yeast not under selection were grown overnight in YPAD and then diluted 1:50 and allowed to grow in YPAraffinose for 4 h. Yeast harboring a plasmid were grown in minimal SD-Ura overnight, pelleted, and resuspended in SGal-Ura for 20–24 h, diluted 1:50, and allowed to grow in SGal-Ura for 4 h. The OD600 was taken to ensure equal growth among strains. High-resolution O2 consumption was determined at 37°C using the Oroboros (Innsbruck, Austria) O2K Oxygraph. Before addition of sample into respiration chambers, a baseline respiration rate was determined. Samples were centrifuged at 1000 × g for 10 min and resuspended in warm mitochondrial respiration buffer 05 (MiR05; 0.5 mM EGTA, 10 mM KH2PO4, 3 mM MgCl2–6 H2O, 60 mM K-lactobionate, 20 mM HEPES, 110 mM sucrose, 1 mg/ml fatty acid–free bovine serum albumin, pH 7.1). After addition of sample, the chambers were hyperoxygenated to ∼350 nmol/ml. After this, routine respiration was determined by measuring O2 consumption in the absence of any substrate (R). Next, glucose (Glc; 20 mM) and then ethanol (EtOH; 2%) was added to the respiration chambers to determine substrate-specific respiration. After this, the uncoupler carbonyl cyanide p-(trifluoro-methoxy) phenylhydrazine (70 μM) was added to determine noncoupled respiration as a measure of maximal electron transport system capacity (E). Finally, respiration was inhibited by the addition of the cytochrome c oxidase inhibitor azide (20 mM), eliciting a state of residual oxygen consumption (ROX), which provided a control for all values. Each strain was grown in triplicate, and respiration rates were averaged.
Acknowledgments
We thank Brigham Young University undergraduates Andrew Gessel, Eliza Lawrence, Katie Harris, Colby Haines, Serena Loeb, Lauren Faucer, and Raul Hererra for their contributions to the Y2H screen. This work was supported by National Institutes of Health Grant R15 GM100376-01, a Brigham Young University Mentoring Environmental Grant, and the Brigham Young University Department of Microbiology and Molecular Biology.
Abbreviations used:
- MS
mass spectrometry
- Psk1
PAS kinase 1
- Y2H
yeast two-hybrid
Footnotes
This article was published online ahead of print in MBoC in Press (http://www.molbiolcell.org/cgi/doi/10.1091/mbc.E13-10-0631) on May 21, 2014.
REFERENCES
- Amberg DC, Burke D, Strathern JN. Methods in Yeast Genetics: A Cold Spring Harbor Laboratory Course Manual. Cold Spring Harbor, NY: Cold Spring Harbor Laboratory Press; 2005. [Google Scholar]
- An R, da Silva Xavier G, Hao HX, Semplici F, Rutter J, Rutter GA. Regulation by Per-Arnt-Sim (PAS) kinase of pancreatic duodenal homeobox-1 nuclear import in pancreatic beta-cells. Biochem Soc Trans. 2006;34:791–793. doi: 10.1042/BST0340791. [DOI] [PubMed] [Google Scholar]
- Aow JS, Xue X, Run JQ, Lim GF, Goh WS, Clarke ND. Differential binding of the related transcription factors Pho4 and Cbf1 can tune the sensitivity of promoters to different levels of an induction signal. Nucleic Acids Res. 2013;41:4877–4887. doi: 10.1093/nar/gkt210. [DOI] [PMC free article] [PubMed] [Google Scholar]
- Auer S, Hahne P, Soyal SM, Felder T, Miller K, Paulmichl M, Krempler F, Oberkofler H, Patsch W. Potential role of upstream stimulatory factor 1 gene variant in familial combined hyperlipidemia and related disorders. Arterioscler Thromb Vasc Biol. 2012;32:1535–1544. doi: 10.1161/ATVBAHA.112.245639. [DOI] [PubMed] [Google Scholar]
- Baker RE, Fitzgerald-Hayes M, O'Brien TC. Purification of the yeast centromere binding protein CP1 and a mutational analysis of its binding site. J Biol Chem. 1989;264:10843–10850. [PubMed] [Google Scholar]
- Bram RJ, Kornberg RD. Isolation of a Saccharomyces cerevisiae centromere DNA-binding protein, its human homolog, and its possible role as a transcription factor. Mol Cell Biol. 1987;7:403–409. doi: 10.1128/mcb.7.1.403. [DOI] [PMC free article] [PubMed] [Google Scholar]
- Breitkreutz A, et al. A global protein kinase and phosphatase interaction network in yeast. Science. 2010;328:1043–1046. doi: 10.1126/science.1176495. [DOI] [PMC free article] [PubMed] [Google Scholar]
- Cai M, Davis RW. Yeast centromere binding protein CBF1, of the helix-loop-helix protein family, is required for chromosome stability and methionine prototrophy. Cell. 1990;61:437–446. doi: 10.1016/0092-8674(90)90525-j. [DOI] [PubMed] [Google Scholar]
- Cardon CM, Rutter J. PAS kinase: integrating nutrient sensing with nutrient partitioning. Semin Cell Dev Biol. 2012;23:626–630. doi: 10.1016/j.semcdb.2011.12.007. [DOI] [PMC free article] [PubMed] [Google Scholar]
- Chvojka A, Barlas M, Ruis H, Padrao GR, Panek AD, Mattoon JR. A regulatory mutation in yeast which affects catalase T formation and metabolism of carbohydrate reserves. Curr Genet. 1981;4:47–50. doi: 10.1007/BF00376785. [DOI] [PubMed] [Google Scholar]
- da Silva Xavier G, et al. Per-Arnt-Sim (PAS) domain-containing protein kinase is downregulated in human islets in type 2 diabetes and regulates glucagon secretion. Diabetologia. 2011;54:819–827. doi: 10.1007/s00125-010-2010-7. [DOI] [PMC free article] [PubMed] [Google Scholar]
- da Silva Xavier G, Rutter J, Rutter GA. Involvement of Per-Arnt-Sim (PAS) kinase in the stimulation of preproinsulin and pancreatic duodenum homeobox 1 gene expression by glucose. Proc Natl Acad Sci USA. 2004;101:8319–8324. doi: 10.1073/pnas.0307737101. [DOI] [PMC free article] [PubMed] [Google Scholar]
- DeMille D, Grose JH. PAS kinase: a nutrient sensing regulator of glucose homeostasis. IUBMB Life. 2013;65:921–929. doi: 10.1002/iub.1219. [DOI] [PMC free article] [PubMed] [Google Scholar]
- Dunham WH, Mullin M, Gingras AC. Affinity-purification coupled to mass spectrometry: basic principles and strategies. Proteomics. 2012;12:1576–1590. doi: 10.1002/pmic.201100523. [DOI] [PubMed] [Google Scholar]
- Eckhardt K, et al. Male germ cell expression of the PAS domain kinase PASKIN and its novel target eukaryotic translation elongation factor eEF1A1. Cell Physiol Biochem. 2007;20:227–240. doi: 10.1159/000104169. [DOI] [PubMed] [Google Scholar]
- Eglen R, Reisine T. Drug discovery and the human kinome: recent trends. Pharmacol Ther. 2011;130:144–156. doi: 10.1016/j.pharmthera.2011.01.007. [DOI] [PubMed] [Google Scholar]
- Endicott JA, Noble ME, Johnson LN. The structural basis for control of eukaryotic protein kinases. Annu Rev Biochem. 2012;81:587–613. doi: 10.1146/annurev-biochem-052410-090317. [DOI] [PubMed] [Google Scholar]
- Fang Z, Grutter C, Rauh D. Strategies for the selective regulation of kinases with allosteric modulators: exploiting exclusive structural features. ACS Chem Biol. 2013;8:58–70. doi: 10.1021/cb300663j. [DOI] [PubMed] [Google Scholar]
- Fields S, Song O. A novel genetic system to detect protein-protein interactions. Nature. 1989;340:245–246. doi: 10.1038/340245a0. [DOI] [PubMed] [Google Scholar]
- Fontes G, Semache M, Hagman DK, Tremblay C, Shah R, Rhodes CJ, Rutter J, Poitout V. Involvement of Per-Arnt-Sim kinase and extracellular-regulated kinases-1/2 in palmitate inhibition of insulin gene expression in pancreatic beta-cells. Diabetes. 2009;58:2048–2058. doi: 10.2337/db08-0579. [DOI] [PMC free article] [PubMed] [Google Scholar]
- Gallinetti J, Harputlugil E, Mitchell JR. Amino acid sensing in dietary-restriction-mediated longevity: roles of signal-transducing kinases GCN2 and TOR. Biochem J. 2013;449:1–10. doi: 10.1042/BJ20121098. [DOI] [PMC free article] [PubMed] [Google Scholar]
- Graves LM, Duncan JS, Whittle MC, Johnson GL. The dynamic nature of the kinome. Biochem J. 2013;450:1–8. doi: 10.1042/BJ20121456. [DOI] [PMC free article] [PubMed] [Google Scholar]
- Grose JH, Rutter J. The role of PAS kinase in PASsing the glucose signal. Sensors (Basel) 2010;10:5668–5682. doi: 10.3390/s100605668. [DOI] [PMC free article] [PubMed] [Google Scholar]
- Grose JH, Smith TL, Sabic H, Rutter J. Yeast PAS kinase coordinates glucose partitioning in response to metabolic and cell integrity signaling. EMBO J. 2007;26:4824–4830. doi: 10.1038/sj.emboj.7601914. [DOI] [PMC free article] [PubMed] [Google Scholar]
- Grose JH, Sundwall E, Rutter J. Regulation and function of yeast PAS kinase: a role in the maintenance of cellular integrity. Cell Cycle. 2009;8:1824–1832. doi: 10.4161/cc.8.12.8799. [DOI] [PMC free article] [PubMed] [Google Scholar]
- Hao HX, Cardon CM, Swiatek W, Cooksey RC, Smith TL, Wilde J, Boudina S, Abel ED, McClain DA, Rutter J. PAS kinase is required for normal cellular energy balance. Proc Natl Acad Sci USA. 2007;104:15466–15471. doi: 10.1073/pnas.0705407104. [DOI] [PMC free article] [PubMed] [Google Scholar]
- Hao HX, Rutter J. The role of PAS kinase in regulating energy metabolism. IUBMB Life. 2008;60:204–209. doi: 10.1002/iub.32. [DOI] [PubMed] [Google Scholar]
- Hardie DG. AMP-activated/SNF1 protein kinases: conserved guardians of cellular energy. Nat Rev Mol Cell Biol. 2007;8:774–785. doi: 10.1038/nrm2249. [DOI] [PubMed] [Google Scholar]
- Haynes BC, Maier EJ, Kramer MH, Wang PI, Brown H, Brent MR. Mapping functional transcription factor networks from gene expression data. Genome Res. 2013;23:1319–1328. doi: 10.1101/gr.150904.112. [DOI] [PMC free article] [PubMed] [Google Scholar]
- Hedbacker K, Carlson M. SNF1/AMPK pathways in yeast. Front Biosci. 2008;13:2408–2420. doi: 10.2741/2854. [DOI] [PMC free article] [PubMed] [Google Scholar]
- James P, Halladay J, Craig EA. Genomic libraries and a host strain designed for highly efficient two-hybrid selection in yeast. Genetics. 1996;144:1425–1436. doi: 10.1093/genetics/144.4.1425. [DOI] [PMC free article] [PubMed] [Google Scholar]
- Jessulat M, et al. Recent advances in protein-protein interaction prediction: experimental and computational methods. Expert Opin Drug Discov. 2011;6:921–935. doi: 10.1517/17460441.2011.603722. [DOI] [PubMed] [Google Scholar]
- Johnson M, Zaretskaya I, Raytselis Y, Merezhuk Y, McGinnis S, Madden TL. NCBI BLAST: a better web interface. Nucleic Acids Res. 2008;36:W5–W9. doi: 10.1093/nar/gkn201. [DOI] [PMC free article] [PubMed] [Google Scholar]
- Johnson SA, Hunter T. Kinomics: methods for deciphering the kinome. Nat Methods. 2005;2:17–25. doi: 10.1038/nmeth731. [DOI] [PubMed] [Google Scholar]
- Käll L, Canterbury JD, Weston J, Noble WS, MacCoss MJ. Semi-supervised learning for peptide identification from shotgun proteomics datasets. Nat Methods. 2007;4:923–925. doi: 10.1038/nmeth1113. [DOI] [PubMed] [Google Scholar]
- Kean MJ, Couzens AL, Gingras AC. Mass spectrometry approaches to study mammalian kinase and phosphatase associated proteins. Methods. 2012;57:400–408. doi: 10.1016/j.ymeth.2012.06.002. [DOI] [PubMed] [Google Scholar]
- Knight JD, Pawson T, Gingras AC. Profiling the kinome: current capabilities and future challenges. J Proteomics 81, 43–55. 2012 doi: 10.1016/j.jprot.2012.10.015. [DOI] [PubMed] [Google Scholar]
- Kolaczkowski M, Kolaczkowska A, Gaigg B, Schneiter R, Moye-Rowley WS. Differential regulation of ceramide synthase components LAC1 and LAG1 in Saccharomyces cerevisiae. Eukaryot Cell. 2004;3:880–892. doi: 10.1128/EC.3.4.880-892.2004. [DOI] [PMC free article] [PubMed] [Google Scholar]
- Kuras L, Barbey R, Thomas D. Assembly of a bZIP-bHLH transcription activation complex: formation of the yeast Cbf1-Met4-Met28 complex is regulated through Met28 stimulation of Cbf1 DNA binding. EMBO J. 1997;16:2441–2451. doi: 10.1093/emboj/16.9.2441. [DOI] [PMC free article] [PubMed] [Google Scholar]
- Kuras L, Cherest H, Surdin-Kerjan Y, Thomas D. A heteromeric complex containing the centromere binding factor 1 and two basic leucine zipper factors, Met4 and Met28, mediates the transcription activation of yeast sulfur metabolism. EMBO J. 1996;15:2519–2529. [PMC free article] [PubMed] [Google Scholar]
- Kuras L, Thomas D. Identification of the yeast methionine biosynthetic genes that require the centromere binding factor 1 for their transcriptional activation. FEBS Lett. 1995;367:15–18. doi: 10.1016/0014-5793(95)00528-h. [DOI] [PubMed] [Google Scholar]
- Lal H, Kolaja KL, Force T. Cancer genetics and the cardiotoxicity of the therapeutics. J Am Coll Cardiol. 2013;61:267–274. doi: 10.1016/j.jacc.2012.05.066. [DOI] [PubMed] [Google Scholar]
- Lin Z, Wang TY, Tsai BS, Wu FT, Yu FJ, Tseng YJ, Sung HM, Li WH. Identifying cis-regulatory changes involved in the evolution of aerobic fermentation in yeasts. Genome Biol Evol. 2013;5:1065–1078. doi: 10.1093/gbe/evt067. [DOI] [PMC free article] [PubMed] [Google Scholar]
- Loewith R, Hall MN. Target of rapamycin (TOR) in nutrient signaling and growth control. Genetics. 2011;189:1177–1201. doi: 10.1534/genetics.111.133363. [DOI] [PMC free article] [PubMed] [Google Scholar]
- Longtine MS, McKenzie A, 3rd, Demarini DJ, Shah NG, Wach A, Brachat A, Philippsen P, Pringle JR. Additional modules for versatile and economical PCR-based gene deletion and modification in Saccharomyces cerevisiae. Yeast. 1998;14:953–961. doi: 10.1002/(SICI)1097-0061(199807)14:10<953::AID-YEA293>3.0.CO;2-U. [DOI] [PubMed] [Google Scholar]
- MacDonald PE, Rorsman P. Per-Arnt-Sim (PAS) domain kinase (PASK) as a regulator of glucagon secretion. Diabetologia. 2011;54:719–721. doi: 10.1007/s00125-011-2072-1. [DOI] [PubMed] [Google Scholar]
- Makino T, McLysaght A. Positionally biased gene loss after whole genome duplication: evidence from human, yeast, and plant. Genome Res. 2012;22:2427–2435. doi: 10.1101/gr.131953.111. [DOI] [PMC free article] [PubMed] [Google Scholar]
- Marcilla M, Albar JP. Quantitative proteomics: a strategic ally to map protein interaction networks. IUBMB Life. 2013;65:9–16. doi: 10.1002/iub.1081. [DOI] [PubMed] [Google Scholar]
- Mok J, Zhu X, Snyder M. Dissecting phosphorylation networks: lessons learned from yeast. Expert Rev Proteomics. 2011;8:775–786. doi: 10.1586/epr.11.64. [DOI] [PMC free article] [PubMed] [Google Scholar]
- Naukkarinen J, Ehnholm C, Peltonen L. Genetics of familial combined hyperlipidemia. Curr Opin Lipidol. 2006;17:285–290. doi: 10.1097/01.mol.0000226121.27931.3f. [DOI] [PubMed] [Google Scholar]
- O'Connell KF, Baker RE. Possible cross-regulation of phosphate and sulfate metabolism in Saccharomyces cerevisiae. Genetics. 1992;132:63–73. doi: 10.1093/genetics/132.1.63. [DOI] [PMC free article] [PubMed] [Google Scholar]
- Pajukanta P, et al. Familial combined hyperlipidemia is associated with upstream transcription factor 1 (USF1) Nat Genet. 2004;36:371–376. doi: 10.1038/ng1320. [DOI] [PubMed] [Google Scholar]
- Park D, Singh R, Baym M, Liao CS, Berger B. IsoBase: a database of functionally related proteins across PPI networks. Nucleic Acids Res. 2011;39:D295–300. doi: 10.1093/nar/gkq1234. [DOI] [PMC free article] [PubMed] [Google Scholar]
- Perkins DN, Pappin DJ, Creasy DM, Cottrell JS. Probability-based protein identification by searching sequence databases using mass spectrometry data. Electrophoresis. 1999;20:3551–3567. doi: 10.1002/(SICI)1522-2683(19991201)20:18<3551::AID-ELPS3551>3.0.CO;2-2. [DOI] [PubMed] [Google Scholar]
- Petti AA, McIsaac RS, Ho-Shing O, Bussemaker HJ, Botstein D. Combinatorial control of diverse metabolic and physiological functions by transcriptional regulators of the yeast sulfur assimilation pathway. Mol Biol Cell. 2012;23:3008–3024. doi: 10.1091/mbc.E12-03-0233. [DOI] [PMC free article] [PubMed] [Google Scholar]
- Rajagopala SV, Sikorski P, Caufield JH, Tovchigrechko A, Uetz P. Studying protein complexes by the yeast two-hybrid system. Methods. 2012;58:392–399. doi: 10.1016/j.ymeth.2012.07.015. [DOI] [PMC free article] [PubMed] [Google Scholar]
- Robinson MD, Grigull J, Mohammad N, Hughes TR. FunSpec: a web-based cluster interpreter for yeast. BMC Bioinformatics. 2002;3:35. doi: 10.1186/1471-2105-3-35. [DOI] [PMC free article] [PubMed] [Google Scholar]
- Rutter J, Probst BL, McKnight SL. Coordinate regulation of sugar flux and translation by PAS kinase. Cell. 2002;111:17–28. doi: 10.1016/s0092-8674(02)00974-1. [DOI] [PubMed] [Google Scholar]
- Schlafli P, Troger J, Eckhardt K, Borter E, Spielmann P, Wenger RH. Substrate preference and phosphatidylinositol monophosphate inhibition of the catalytic domain of the Per-Arnt-Sim domain kinase PASKIN. FEBS J. 2011;278:1757–1768. doi: 10.1111/j.1742-4658.2011.08100.x. [DOI] [PubMed] [Google Scholar]
- Schroeder MJ, Shabanowitz J, Schwartz JC, Hunt DF, Coon JJ. A neutral loss activation method for improved phosphopeptide sequence analysis by quadrupole ion trap mass spectrometry. Anal Chem. 2004;76:3590–3598. doi: 10.1021/ac0497104. [DOI] [PubMed] [Google Scholar]
- Semache M, Zarrouki B, Fontes G, Fogarty S, Kikani C, Chawki MB, Rutter J, Poitout V. Per-Arnt-Sim kinase regulates pancreatic duodenal homeobox-1 protein stability via phosphorylation of glycogen synthase kinase 3beta in pancreatic beta-cells. J Biol Chem. 2013;288:24825–24833. doi: 10.1074/jbc.M113.495945. [DOI] [PMC free article] [PubMed] [Google Scholar]
- Semplici F, et al. Human mutation within Per-Arnt-Sim (PAS) domain-containing protein kinase (PASK) causes basal insulin hypersecretion. J Biol Chem. 2011;286:44005–44014. doi: 10.1074/jbc.M111.254995. [DOI] [PMC free article] [PubMed] [Google Scholar]
- Smith TL, Rutter J. Regulation of glucose partitioning by PAS kinase and Ugp1 phosphorylation. Mol Cell. 2007;26:491–499. doi: 10.1016/j.molcel.2007.03.025. [DOI] [PubMed] [Google Scholar]
- Sopko R, Andrews BJ. Linking the kinome and phosphorylome—a comprehensive review of approaches to find kinase targets. Mol Biosyst. 2008;4:920–933. doi: 10.1039/b801724g. [DOI] [PubMed] [Google Scholar]
- Taylor SS, Yang J, Wu J, Haste NM, Radzio-Andzelm E, Anand G. PKA: a portrait of protein kinase dynamics. Biochim Biophys Acta. 2004;1697:259–269. doi: 10.1016/j.bbapap.2003.11.029. [DOI] [PubMed] [Google Scholar]
- Thomas D, Jacquemin I, Surdin-Kerjan Y. MET4, a leucine zipper protein, and centromere-binding factor 1 are both required for transcriptional activation of sulfur metabolism in Saccharomyces cerevisiae. Mol Cell Biol. 1992;12:1719–1727. doi: 10.1128/mcb.12.4.1719. [DOI] [PMC free article] [PubMed] [Google Scholar]
- Wilson WA, Skurat AV, Probst B, de Paoli-Roach A, Roach PJ, Rutter J. Control of mammalian glycogen synthase by PAS kinase. Proc Natl Acad Sci USA. 2005;102:16596–16601. doi: 10.1073/pnas.0508481102. [DOI] [PMC free article] [PubMed] [Google Scholar]
- Winzeler EA, et al. Functional characterization of the S. cerevisiae genome by gene deletion and parallel analysis. Science. 1999;285:901–906. doi: 10.1126/science.285.5429.901. [DOI] [PubMed] [Google Scholar]
- Wisniewski JR, Zougman A, Nagaraj N, Mann M. Universal sample preparation method for proteome analysis. Nat Methods. 2009;6:359–362. doi: 10.1038/nmeth.1322. [DOI] [PubMed] [Google Scholar]
- Zhang L, Daly RJ. Targeting the human kinome for cancer therapy: current perspectives. Critical Rev Oncog. 2012;17:233–246. doi: 10.1615/critrevoncog.v17.i2.70. [DOI] [PubMed] [Google Scholar]
- Zhou X, O'Shea EK. Integrated approaches reveal determinants of genome-wide binding and function of the transcription factor Pho4. Mol Cell. 2011;42:826–836. doi: 10.1016/j.molcel.2011.05.025. [DOI] [PMC free article] [PubMed] [Google Scholar]