Abstract
Introduction
Young’s modulus (E) and Poisson’s ratio (v) of the periodontal ligament are needed in a finite element analysis for investigating the biomechanical behavior of a tooth, periodontal ligament, and bone complex. However, large discrepancies in E (0.01–1,750 MPa) and v (0.28–0.49) were reported previously. The objective of this study was to narrow the ranges and to provide equivalent E and v pairs suitable for finite element modeling of a tooth, periodontal ligament, and bone complex by using a reported crown load-displacement relationship as the criterion.
Methods
A 3-dimensional finite element model of a 3-tooth, periodontal ligament, and bone complex, consisting of a maxillary central incisor with 2 adjacent teeth, from a cone-beam computed tomography scan was created. The dimensions, constraints, and loading condition were kept similar to those reported in the human study. With the load applied to the crown, both v and E were adjusted independently, and the corresponding crown displacements were calculated. The resulting load-displacement curves were compared with those reported in the human study. The mean absolute displacement difference method was used to find the best fit. The E and v pairs that generated the minimum mean absolute displacement difference were identified.
Results
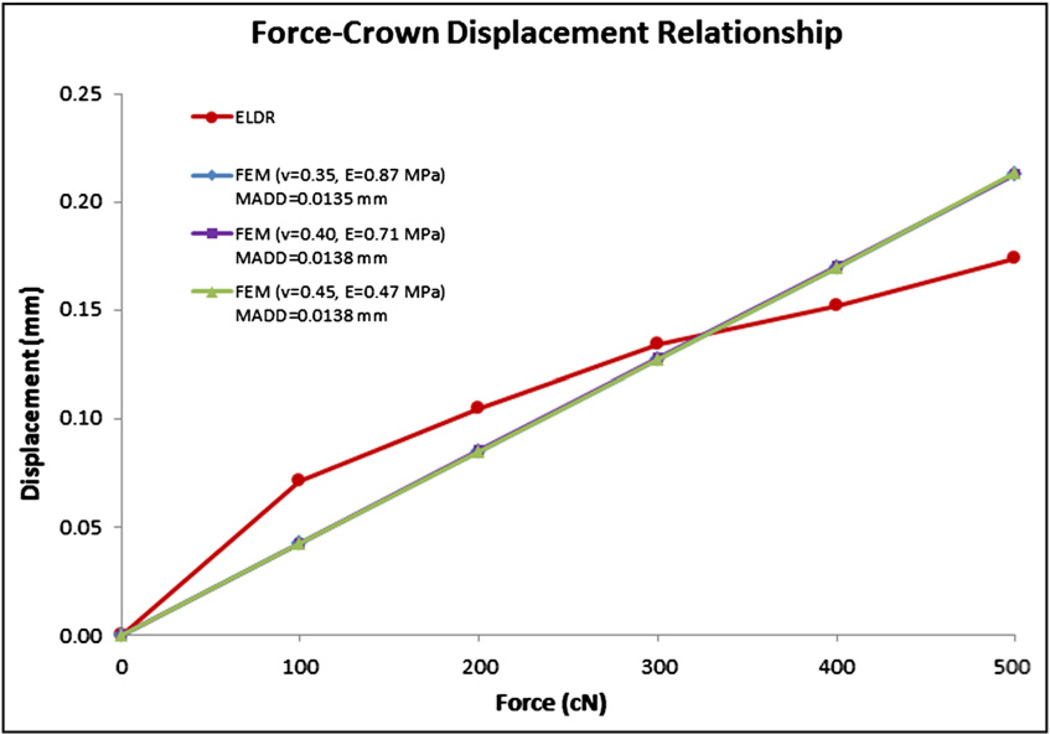
The finite element model with 1 of the 3 E and v pairs (v = 0.35, E = 0.87 MPa; v = 0.4, E = 0.71 MPa; and v = 0.45, E = 0.47 MPa) simulated the tooth, periodontal ligament, and bone complex well. The mean absolute displacement differences were 0.0135, 0.0138, and 0.0138 mm, respectively; these are less than 8% of 0.175 mm, which was the crown displacement of the tooth, periodontal ligament, and bone complex under the load of 500 cN.
Conclusions
The E and v values close to the 3 pairs might be used for finite element modeling of the tooth, periodontal ligament, and bone complex.
The finite element method is widely used to investigate biomechanical behaviors of tooth, periodontal ligament (PDL), and bone complex. In a finite element analysis, 2 mechanical parameters of the PDL are needed: Young’s modulus (E) and Poisson’s ratio (v). These parameters are critical in model accuracy because they primarily determine the deformation of the PDL, which directly links to the calculated stress and strain as well as the instantaneous crown displacement in response to orthodontic forces.1–3
Previous studies have reported quite different values of E and v. Especially, E values were reported in a large range, from 0.01 to 1,750 MPa.4 Pietrzak et al5 determined the values of E as from 0.01 to 0.03 MPa by correlating the result of a nonlinear elastic finite element model to experimental data of a maxillary incisor under axial loadings. Siebers6 and Poppe et al7 used a bilinear parameter set for the elasticity of the PDL and determined the set values of E as approximately 0.05 and 0.28 MPa. Anderson et al8 determined the value of E as 0.07 MPa using a linear-elastic finite element model. Yoshida et al9 determined the values of E from 0.12 to 0.96 MPa for different load ranges and claimed that E increased almost exponentially with the increment of load because of the PDL’s nonlinear elasticity. Jones et al10 stated that an appropriate estimate of E was 1 MPa, through direct measurement on human subjects. Yamada and Evans,11 Mandell et al,12 and Atkinson and Ralph13 determined the values of E as 1.4, 2.4, and 3.0 MPa, respectively. Rees and Jacobsen14 determined the value of E as 50 MPa by correlating the result of a 2-dimensional plain strain finite element model with 2 experimental loading studies. Atmaram and Mohammed15 determined the value of E as between 175 and 350 MPa using 2 types of PDL elements in a finite element model. Most previous finite element studies used E values in the ranges in these reports. The primary reason for the wide discrepancies lies in the difficulties of investigating the physical PDL parameters. First, the parameters are determined by the internal physical and biologic properties of the PDL, and intensive and thorough knowledge of the PDL is limited.2 Second, there is no benchmark approach to investigate these parameters in the PDL; this makes it difficult to judge the validity of the reported data.
Considering the great needs of finite element analysis and the importance of the 2 parameters, E and v, in the analysis, the objectives of our study were to narrow the ranges of E and v, and to provide E and v pairs suitable for more reliable finite element modeling of the tooth, PDL, and bone complex. We were not intending to investigate the physical parameters of the PDL, but rather to find the best equivalent E and v pairs.
MATERIAL AND METHODS
The objectives were achieved by simulating an invivo study by using the finite element method.16 This study included creating a comparable tooth, PDL, and bone complex finite element model with the same loading conditions as reported in the in-vivo study, adjusting the E and v individually and calculating the resulting displacements, and selecting the E and v pairs from the crown displacement that agreed with the in-vivo experimental result. These were considered as the equivalent E and v pairs.
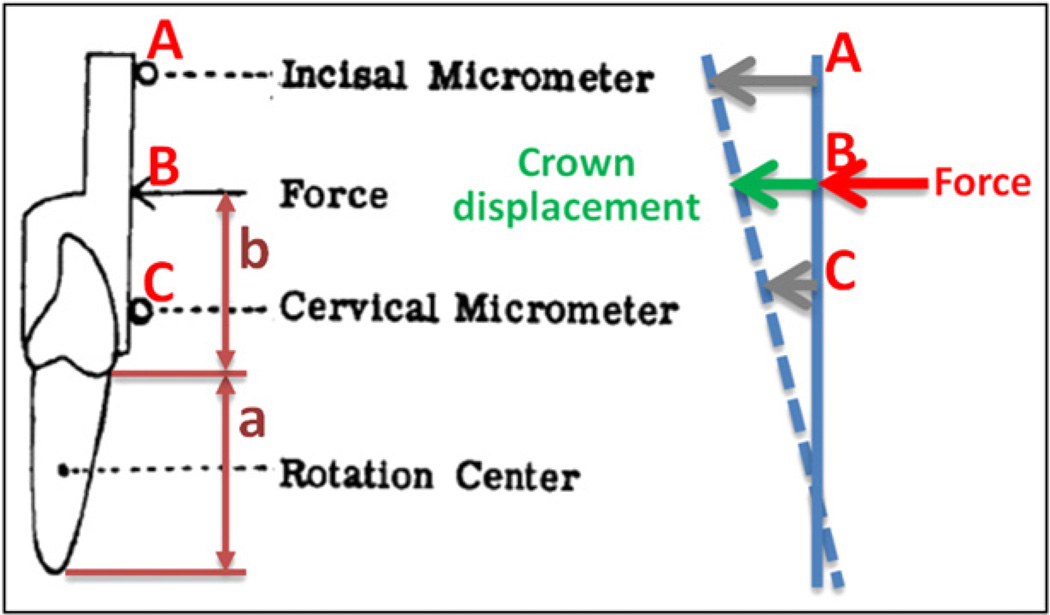
Christiansen and Burstone16 quantified the crown displacements in response to applied forces on the maxillary central incisors in vivo. In this study, the force was applied to an extension bar at Point B (Fig 1). The bar was along the long axis of the measured tooth and attached to the crown. Displacements of 2 other points, A and C, on the extension bar were measured simultaneously (Fig 1). These points were measured for calculating both tooth translation and rotation. Based on the geometric relationship, the displacement of Point, B, where the force was applied, was calculated. Thus, an experimental load-displacement relationship was obtained. The relationship was primarily determined by E and v; thus, it was used as the criterion to determine the equivalent E and v for finite element modeling.
Fig. 1.
Schematics showing the load and crown displacement locations in the study of Christiansen and Burstone.16
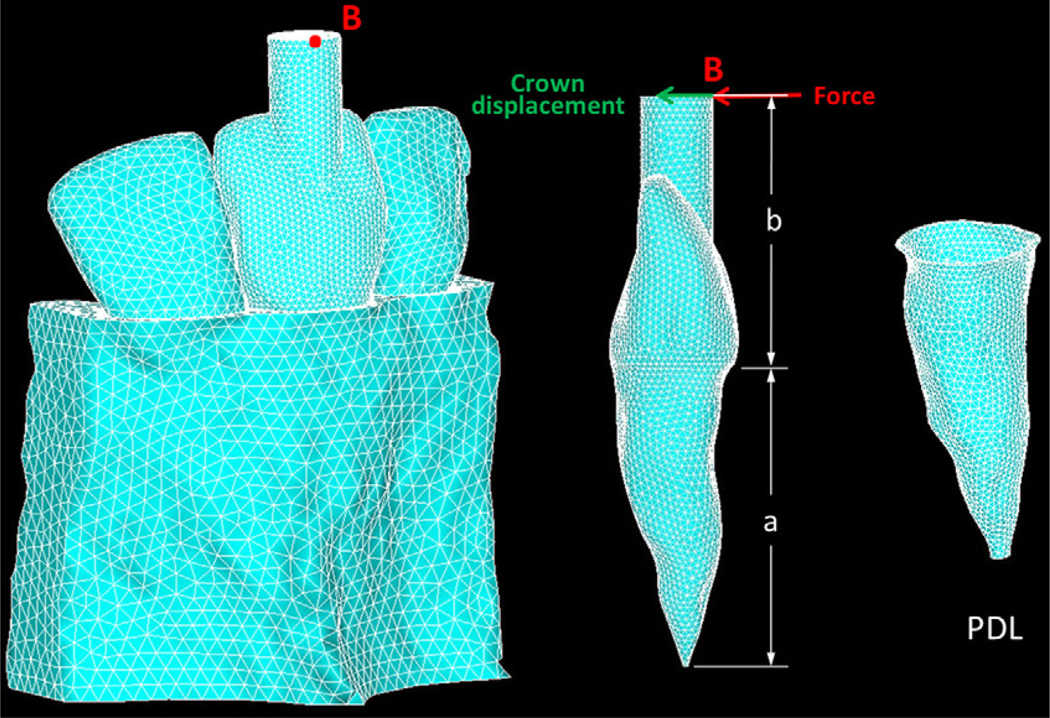
Cone-beam computed tomography images of a selected maxillary central incisor with the 2 neighboring teeth were used to create a finite element model that was comparable with the in-vivo case. The 3-dimensional roots and bone were reconstructed by using Mimics software (version 13.0; Materialise, Leuven, Belgium). The roots were segmented first. The PDL was created surrounding the roots by dilating the roots with 1 voxel (0.25 mm). The teeth, PDL, and bone were assembled to create a virtual tooth, PDL, and bone complex called the solid model. The solid model was then imported into software (version 12.1; ANSYS, Canonsburg, Pa) for meshing and analysis. Geometric parameters affecting the crown displacement in response to the force were kept the same as those in the in-vivo study. The key parameters included the distance, a, from the apex to the alveolar crest (16.8 mm) and the location, B, on the extension bar that is 14.8 mm above the alveolar crest to apply the horizontal force (Fig 2). The study was approved by the Indiana University review board.
Fig. 2.
Finite element model of a 3-tooth periodontal ligament and bone complex.
The tooth, PDL, and bone complex was considered homogeneous and isotropic. The material properties of the bone and the tooth were chosen from the literature (Table).5,10 The teeth, PDL, and bone were meshed with 10-node tetrahedral (SOLID187) elements. The numbers of elements of the target teeth, PDL, and bone were 82,020, 9907, and 84,507, respectively. The side surfaces of the 3-tooth model were fixed. Different static forces ranging from 0 to 500 cN were applied at B, which was perpendicular to the tooth’s long axis as was done in the in-vivo study.16 The resulting crown displacements at Point B were calculated.
Table.
Material properties used in the finite element model of the tooth, periodontal ligament, and bone complex
| Tissue | Model characteristic |
Young’s modulus |
Poisson’s ratio |
|---|---|---|---|
| Tooth | Linear elastic | 2 × 10¹⁰ Pa | 0.3 |
| Bone | Linear elastic | 3.45 × 10⁸ Pa | 0.3 |
| PDL | Linear elastic | - | - |
The equivalent E and v pairs were determined in 2 steps. First, the E range was narrowed, based on the displacement from a 300-cN force from the in-vivo study. Then, the E in the newly determined range was fine-tuned based on the entire experimental load-displacement relationship. Compared with the E value, v has a narrower range, 0.28–0.49, as reported previously.4 Commonly, v values of 0.35 and 0.45 were used for the fibrous and nonfibrous matrix of the PDL, respectively.17 Therefore, 3 representative values of v = 0.35, 0.4, and 0.45were selected first. Considering the values of E used in previous studies, E values in the range of 0.1 to 1,000 MPa were considered.4 For each selected v, E was adjusted to 0.1, 0.25, 0.5, 1, 2.5, 5, 10, 100, and 1000 MPa, respectively. A 300-cN force was applied, and the resulting displacement of Point B was calculated. The E and v pairs that resulted in the displacement closest to the in-vivo one were selected; this resulted in a narrowed range. Next, E in the new range paired with a v was used, and the crown displacements, resulting from orthodontic forces between 0 and 500 cN at a 100-cN increment, were calculated by using the finite element model. The load-displacement relationships were then compared with the experimental load-displacement relationship reported for determining the best fits. The equivalent E and v pairs should be the best fits of the entire load-displacement curve. For this purpose, the mean absolute displacement difference method was used to determine the best fits. The mean absolute displacement difference is a measure of statistical dispersion by using the average absolute difference, which is widely used for curve fitting. Regarding this study, the mean absolute displacement difference considered the differences between crown displacements simulated in the finite element model and these reported in the in-vivo study, under the forces from 0 to 500 cN. For each E and v pair, the mean absolute displacement difference was calculated as
where, D0 − D5 were the crown displacements under the forces of 0, 100, 200, 300, 400, and 500 cN, respectively, simulated with the finite element model, and were the crown displacements corresponding to the forces expressed in the experimental load-displacement relationship.
With the mean absolute displacement difference method, E was adjusted in the neighborhood of the estimated target values. Considering that 0.01 MPa is an acceptable error for the estimation, an interval of 0.01 MPa was used to adjust E. The ranges were
δ = 0.10 MPa was used in the simulations. δ determines the range of the neighborhood and should be large enough to make sure that the neighborhood search covers the pair of E and v values with a minimal mean absolute displacement difference. For each pair of E and v, the crown displacements under forces from 0 to 500 cN were computed by using the finite element model. The simulated load-displacement relationship was then compared with the experimental load-displacement relationship, and the mean absolute displacement difference value was calculated. The E and v pair that resulted in a curve with a minimal mean absolute displacement difference was considered the best fit and thus was the equivalent pair.
RESULTS
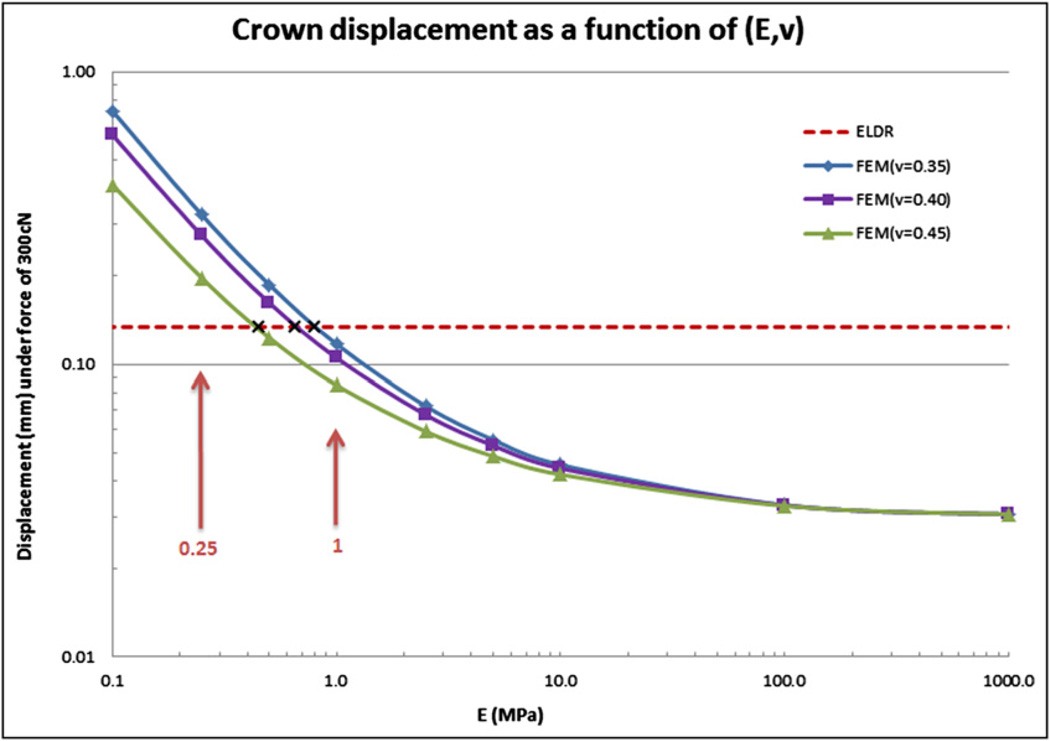
The crown displacements from a 300-cN force corresponding to the various E values and the selected v are shown in Figure 3. The crown displacement, 0.130 mm, from 300 cN of force expressed in the experimental load-displacement relationship, was used as the criterion (dashed line in Fig 3). The 3 curves plotted in logarithmic scales are the crown displacements for v = 0.35, 0.4, and 0.45, respectively. The intersections between the dashed line and the crown displacement curves narrowed the E range between 0.25 and 1 MPa.
Fig. 3.
Crown displacement as a function of (E, v), with E from 0.1 to 1,000 MPa, under a 300-cN force.
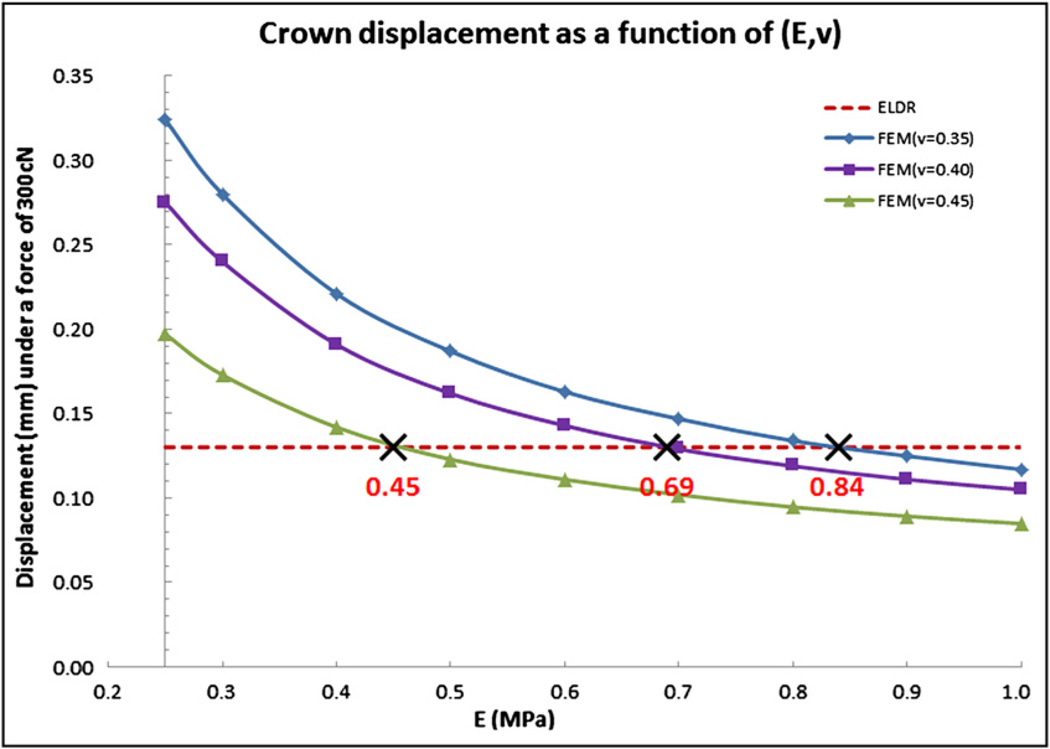
The E was further fine-turned by adjusting it from 0.25 to 1 MPa with an interval of 0.1 MPa. The crown displacements from the 300-cN force are shown in Figure 4. The 3 intersections were found through interpolations. The values were estimated as 0.84 MPa (v = 0.35), 0.69 MPa (v = 0.4), and 0.45 MPa (v = 0.45).
Fig. 4.
Crown displacement as a function of (E, v), with E from 0.25 to 1 MPa, under a 300-cN force.
Three pairs of E and v have been identified by using the mean absolute displacement difference method (Fig 5). The dashed line was the experimental load-displacement relationship that was used as the criterion, whereas the other 3 curves were the simulated load-displacement relationships of the 3 E-v pairs that resulted in the minimal mean absolute displacement difference. The 3 identified pairs of E and v were E = 0.87 MPa for v = 0.35, E = 0.71 MPa for v = 0.4, and E = 0.47 MPa for v = 0.45. The mean absolute displacement difference values were 0.0135, 0.0138, and 0.0138 mm, respectively. The mean absolute displacement difference values were less than 8% of 0.175 mm, which was the crown displacement amount under the force of 500 cN reported in the in-vivo study.
Fig. 5.
Crown-displacement relationships with minimal mean absolute displacement differences for the 3 best E and v pairs. The experimental load-displacement relationship is also shown.
DISCUSSION
In this study, we selected the properties from a broad range of E, reported, and validated them using a published load-displacement relationship. It provided the best equivalent E and v pairs to simulate the reported crown displacement of the maxillary incisor; thus, the pairs can be best used in finite element modeling of the tooth, PDL, and bone complex with a similar single-root structure. The values based on experimental measurements reported by Yoshida et al9 and Jones et al10 were close to our results. Yoshida et al applied forces on the center of resistance of the tooth and then measured the resulting displacements. The estimated E value was between 0.44 and 0.96 MPa when the load varied from 1 to 2 N, whereas v was not involved in the estimation.9 Jones et al reported an appropriate value of E as 1 MPa, through in-vivo measurements, and validated their results by a finite element mdoel.10 In their finite element model, they used similar material properties for the bone and tooth as in our study. Considering the large discrepancy of E values in the previous reports, the results in these 3 studies are quite close.
In engineering, a common method to validate finite element models is to ensure that the calculated displacement matches that from the experiments. This method was used in this study to estimate the material properties. The experimental load-displacement relationship reported earlier was simulated as close as possible so that the PDL’s material properties were the only variables. Therefore, if the material properties are correct, the calculated crown displacement should match the in-vivo results.
The PDL properties that result in the best fits are called equivalent properties because the biologic PDL has a different structure, which consists of both fiber and matrix. The biologic load-displacement curve shows nonlinearity (Fig 5). The curve is tooth-dependent and difficult to obtain, and thus has not been used for finite element modeling. As a result, most finite element models previously reported considered the PDL as a linear, homogenous, and isotropic material. Our E and v pairs are for these kinds of analyses; therefore, the PDL properties from this study can only be called equivalent properties. The load displacement is tooth-specific, but the PDL material properties are not. Thus, if the equivalent E and v pair works well for the incisor, it can be used for other teeth with a similar root structure.
The equivalent E and v pairs provided the best fits to the load-displacement curves. The resulting mean absolute displacement difference values were about 8% of the crown displacement when a load of 500 cN was applied; this is considered acceptable in computer modeling.
The quality of a finite element model relies on its accuracy to predict the biologic load-displacement relationship, which is sensitive to the magnitudes of E. Different E values resulted in significant differences in crown displacements as shown in Figure 3. As E increased, crown displacement reduced exponentially until a value of E = 10 MPa was reached. Then, the amount of displacement became less sensitive to the E value. The accuracy of the finite element model is characterized by the calculated displacement. Therefore, having a more realistic E in the model will improve the quality of model. On the other hand, the v has a narrower range. Its effects on tooth displacement are less significant.
Biomechanics provides fundamental principles for orthodontic treatment. More biomechanical analyses have been reported by using finite element methods. A reliable model depends on correct material properties. The results from this study should help orthodontists to make good judgments on the reliability of the models reported.
CONCLUSIONS
E and ν values close to the 3 pairs—E = 0.87 MPa for v = 0.35, E = 0.71 MPa for v = 0.4, and E = 0.47 MPa for v = 0.45—can be used for finite element modeling of the tooth, PDL, and bone complex.
Acknowledgments
Partially supported by the NIH/NIDCR under grant 1R01DE018668.
Footnotes
The authors report no commercial, proprietary, or financial interest in the products or companies described in this article.
REFERENCES
- 1.Van Driel WD, Van Lecuwen EJ, Von den Hoff JW, Maltha JC, Kuijpers-Jagtman AM. Time-dependent mechanical behaviour of the periodontal ligament. Proceedings of the Institution of Mechanical Engineers H. 2000;214:497–504. doi: 10.1243/0954411001535525. [DOI] [PubMed] [Google Scholar]
- 2.Natali AN. Dental biomechanics. New York: Taylor & Francis; 2003. [Google Scholar]
- 3.Tanne K, Yoshida S, Kawata T, Sasaki A, Knox K, Jones ML. An evaluation of the biomechanical response of the tooth and periodontium to orthodontic forces in adolescent and adult subjects. Br J Orthod. 1998;25:109–115. doi: 10.1093/ortho/25.2.109. [DOI] [PubMed] [Google Scholar]
- 4.Fill TS, Carey JP, Toogood RW, Major PW. Experimentally determined mechanical properties of, models for, the periodontal ligament: critical review of current literature. J Dent Biomech. 2011;2011:1–10. doi: 10.4061/2011/312980. [DOI] [PMC free article] [PubMed] [Google Scholar]
- 5.Pietrzak AC, Curnier A, Botsis J, Scherrer S, Wiskott A, Belser U. A nonlinear elastic model of the periodontal ligament and its numerical calibration for the study of tooth mobility. Comput Methods Biomech Biomed Engin. 2002;5:91–100. doi: 10.1080/10255840290032117. [DOI] [PubMed] [Google Scholar]
- 6.Siebers G. The influence of the root geometry on the initial tooth mobility [thesis] Bonn, Germany: University of Bonn; 1999. [Google Scholar]
- 7.Poppe M, Bourauel C, Jager A. Determination of the elasticity parameters of the human periodontal ligament and the location of the center of resistance of single-rooted teeth A study of autopsy specimens and their conversion into finite element models. J Orofac Orthop. 2002;63:358–370. doi: 10.1007/s00056-002-0067-8. [DOI] [PubMed] [Google Scholar]
- 8.Andersen KL, Pedersen EH, Melsen B. Material parameters and stress profiles within the periodontal ligament. Am J Orthod Dentofacial Orthop. 1991;99:427–440. doi: 10.1016/S0889-5406(05)81576-8. [DOI] [PubMed] [Google Scholar]
- 9.Yoshida N, Koga Y, Peng CL, Tanaka E, Kobayashi K. In vivo measurement of the elastic modulus of the human periodontal ligament. Med Eng Phys. 2001;23:567–572. doi: 10.1016/s1350-4533(01)00073-x. [DOI] [PubMed] [Google Scholar]
- 10.Jones ML, Hickman J, Middleton J, Knox J, Volp C. Validated finite element method study of orthodontic tooth movement in the human subject. J Orthod. 2001;28:29–39. doi: 10.1093/ortho/28.1.29. [DOI] [PubMed] [Google Scholar]
- 11.Yamada H, Evans FG. Strength of biological materials. Baltimore: Williams & Wilkins; 1970. [Google Scholar]
- 12.Mandel U, Dalgaard P, Viidik A. A biomechanical study of the human periodontal ligament. J Biomech. 1986;19:637–645. doi: 10.1016/0021-9290(86)90169-7. [DOI] [PubMed] [Google Scholar]
- 13.Atkinson HF, Ralph WJ. In vitro strength of the human periodontal ligament. J Dent Res. 1977;56:48–52. doi: 10.1177/00220345770560011001. [DOI] [PubMed] [Google Scholar]
- 14.Rees JS, Jacobsen PH. Elastic modulus of the periodontal ligament. Biomaterials. 1997;18:995–999. doi: 10.1016/s0142-9612(97)00021-5. [DOI] [PubMed] [Google Scholar]
- 15.Atmaram GH, Mohammed H. Estimation of physiologic stresses with a natural tooth considering fibrous PDL structure. J Dent Res. 1981;60:873–877. doi: 10.1177/00220345810600050301. [DOI] [PubMed] [Google Scholar]
- 16.Christiansen RL, Burstone CJ. Centers of rotation within the periodontal space. Am J Orthod. 1969;55:353–369. doi: 10.1016/0002-9416(69)90143-2. [DOI] [PubMed] [Google Scholar]
- 17.Qian H, Chen J, Katona TR. The influence of PDL principal fibers in a 3-dimensional analysis of orthodontic tooth movement. Am J Orthod Dentofacial Orthop. 2001;120:272–279. doi: 10.1067/mod.2001.116085. [DOI] [PubMed] [Google Scholar]


