

Abstract
Astrocytes have been suggested to play several roles in the complex control of brain microenvironment. However, they have been generally considered to constitute a homogeneous population of cells. Here we show that at least three electrophysiologically distinct types of astrocytes can be found in the mature hippocampus. These subpopulations of glia were characterized by expression of different ion currents. In astrocytes exposed to elevated K+, Cs+ prevented influx of K+ only in cells with inwardly rectifying currents (IIR). The topographic distribution of glia with Cs+-sensitive inward rectifying currents (involved in K+ buffering) was nonuniform. Cs+-sensitive astrocytes were predominantly found in CA3 radiatum, whereas most CA1 astrocytes were Cs+-insensitive. Functional significance of the spatial segregation of glial cells with inward rectification was addressed in slices that were bathed in Cs+-containing media. Under these conditions, neuronal stimulation induced spontaneous epileptiform activity, which first appeared in CA3 and was then synaptically propagated to CA1. Intracellular labeling of astrocytes with biocytin revealed that CA1 astrocytes are characterized by a high degree of cell-to-cell coupling; in contrast, cell labeling in CA3 revealed smaller groups and occasionally individual cells. Three individual biocytin-labeled cells had electrophysiological properties indistinguishable from Cs+-sensitive astrocytes but had morphology typical of oligodendroglia. These results provide evidence for a role of K+ uptake via IIR into astrocytes. The segregated expression of potassium channels in a subpopulation of astrocytes suggests that functionally specialized cell types are involved in K+ homeostasis.
Keywords: glia neuronal interactions, oligodendroglia, cell-to-cell coupling, ion homeostasis, extracellular space, patch clamp
Glial ion channel mechanisms involved in ion homeostasis in the brain are poorly understood, and indeed the involvement of astrocytes in ion homeostasis is still in part speculative. The spatial buffer theory (SB) formulated by Orkand et al. (1966) constitutes one of the proposed mechanisms underlying potassium homeostasis and provides the experimental paradigms most used for investigations of ion movements in the brain (Gardner-Medwin, 1983;Gardner-Medwin and Nicholson, 1983; Ballanyi et al., 1987; Dietzel et al., 1989). Potassium SB rests on the assumptions that glia (1) have a resting membrane potential (RMP) that approximatesEK, (2) have a high permeability to potassium, and (3) exhibit coupling through gap-junctions allowing spatial movement of K+. According to the original formulation of SB, local K+ accumulation shifts astrocytic EK toward potentials more positive than RMP resulting in K+ movement toward more negative regions of the glial network distal from K+accumulation.
Newman first suggested a possible involvement of inward rectifier channels (IIR) in K+homeostasis (Newman and Frambach, 1984; Newman, 1985, 1995).IIR channels are well suited for spatial buffering of K+ because they allow K+ influx although impeding potassium efflux. Newman also demonstrated the importance of IIRsegregation in Müller cells and suggested “K siphoning” as an adaptation of SB (Newman and Frambach, 1984; Newman, 1985, 1986).
A key feature of the K+ siphoning hypothesis is the spatial segregation of mechanisms of potassium uptake and release. In the retina, this segregation occurs within a single Müller cell. We reported a heterogeneity among CNS astrocytes that is consistent with segregation of IIR and outward K+ currents in cortical astrocytes (McKhann et al., 1997a). The assumption that cortical astrocytes constitute a homogeneous population is in contrast with the numerous differences found between cortical neurons. In the hippocampus, for example, CA1 and CA3 neurons differ in their intrinsic firing properties, sensitivity to ischemic and hypoxic insult (Kirino et al., 1985), and mechanisms of plasticity (Bear and Malenka, 1994). The differential propensity of these hippocampal regions for epileptiform discharge has been ascribed to intrinsic neuronal differences described above, as well as to non-neuronal factors, including extracellular space (McBain et al., 1990), and delayed CA1 development of homeostatic mechanisms (Haglund et al., 1985). The possibility that the physiopathological differences between CA1 and CA3 may reflect segregation of specialized astrocytes has never been examined. Indeed, most studies on hippocampal glia have been performed exclusively in the CA1 region (Bordey and Sontheimer, 1997; Janigro et al., 1997), and a comparison of the electrophysiological properties of CA1 versus CA3 astrocytes is lacking.
Given these unknowns, experiments were designed to address the following issues: Are hippocampal astrocytes in situcharacterized by heterogeneous properties as are neocortical glia (McKhann et al., 1997a)? Are hippocampal astrocytes homogeneous? Do IIRs constitute a viable mechanism for potassium uptake in these glia? We used the mature rat hippocampal slice preparation to investigate astrocytic properties in the absence of developmental influences; both neuronal and glial cells undergo changes during postnatal maturation (Janigro and Schwartzkroin, 1988a,b; Bordey and Sontheimer, 1997).
MATERIALS AND METHODS
Slice preparation. Hippocampal slices were obtained from 23- to 30-d-old Sprague Dawley rats as described previously (Janigro et al., 1997). Briefly, isoflurane-anesthetized rats were decapitated, and the heads were collected in ice-cold, oxygenated, modified artificial CSF (ACSF) composed of (in mm): 120 NaCl, 3.1 KCl, 3 MgCl2, 1 CaCl2, 1.25 KH2PO4, 26 NaHCO3, and 10 dextrose. This low-calcium and high-magnesium solution was used to reduce cellular damage promoted by Ca2+ influx. The whole brain was rapidly dissected out and cooled down for 2–3 min in ice-cold, oxygenated, modified ACSF. The two hemispheres were then separated by a medial sagittal cut. Each hemisphere was glued on the stage of a vibratome and submerged in fresh oxygenated, modified ACSF. Slices (350 μm thick) were obtained cutting perpendicularly to the main hippocampal axis. Slices were then gently transferred with a pipette to a holding chamber containing ACSF composed of (in mm): 120 NaCl, 3.1 KCl, 1 MgCl2, 2 CaCl2, 1.25 KH2PO4, 26 NaHCO3, and 10 dextrose. Slices were kept at room temperature (24–26°C) for ∼1 hr before recording. Solutions were equilibrated with 95% O2 and 5% CO2 to a final pH of 7.4; solution exchange was achieved by a fast perfusion device located in proximity of the cells (Janigro et al., 1997). The experiments in high K+ were performed by adding K+-gluconate to ACSF to a final [K+]out of 12.35 mm; the concentration of NaCl was left unchanged. The experiments with cesium were performed by adding CsCl (1–2 mm) to the bathing solutions.
Patch-clamp recordings. Slices were gently transferred to a submersion recording chamber in which they were constantly perfused with oxygenated ACSF at a rate of 1–2 ml/min. All the electrophysiological recordings were performed at room temperature (24–26°C); temperature fluctuated <1°C during an individual experiment. Patch-clamp recordings were obtained using an Axopatch 200A amplifier (Axon Instruments, Foster City, CA) in voltage- or current-clamp mode. Whole-cell recordings were obtained with pipettes filled with (in mm): 140 K-gluconate, 1 MgCl2, 2 Na2-ATP, 0.3 Na-GTP, 10 HEPES, and 0.5 EGTA, final pH 7.2 (with NaOH). Pipettes had a resistance of 5–6 MΩ. Series resistance (RS) was monitored throughout the experiment and was usually 15–30 MΩ. Series resistance compensation was routinely performed up to 70–80% (lag time, 10 μsec). Recordings were digitized at 48 KHz, filtered at 2–10 kHz, displayed on an oscilloscope, recorded on tape, and acquired on a 486 computer by pClamp 6 (Axon Instruments).
Glial cells were selected for recording under visual control with a Nikon microscope equipped with Hoffman optics at 400× magnification. Cell membrane potential was corrected for the tip potential determined on withdrawal of the pipette from the cell. Membrane input resistance and cell capacitance were measured in voltage clamp. Unless otherwise specified, data are expressed as mean ± SEM.
Field recordings. Field potentials were recorded with extracellular pipettes filled with normal ACSF equilibrated with 95% O2 and 5% CO2. An Axopatch 200A and an Axopatch 1C (Axon instruments) were used to amplify the signals. Slice stimulation was performed using a World Precision Instruments A365 constant current stimulator. The stimuli were delivered through a bipolar concentric tungsten electrode placed in CA1 stratum radiatum to activate Schaffer collaterals. Stimulation rate was set at 0.1 or 1 Hz (pulse duration, 50 μsec). Experiments performed to determine the subregional origin of epileptiform activity were performed according to the method of Traynelis and Dingledine (1988). Briefly, when synchronized spontaneous epileptiform events appeared in CA3 and CA1, stimulating and recording electrodes were gently removed from the slice. Separation of CA3 from CA1 was performed by cutting the slice with a razor blade chip, the cut reaching from the alveus through stratum moleculare of CA1. In all the slices subjected to this procedure, it was possible to record field potentials in CA1 and CA3 when electrodes were replaced in the tissue.
Intracellular labeling and tissue processing for light and electron microscopy. Glial cells were filled with biocytin (Nε-biotinyl-l-lysine; Sigma, St. Louis, MO) dissolved at 0.5–0.6% in the recording pipette solution. The drug was allowed to diffuse in the cell for the entire duration of the recording. Only one cell was injected with biocytin in any individual slice.
After intracellular labeling, slices were removed from the recording chamber and immersion-fixed in a solution of 4% paraformaldehyde and 0.1% glutaraldehyde in 0.1 m sodium phosphate buffer (PB), pH 7.4, for 4–12 hr at 4°C. The slices were rinsed in 0.1m PB and then infiltrated with 10% sucrose in 0.1m PB for 1 hr, followed by 30% sucrose for 8–12 hr for cryoprotection. Frozen sections were cut (60 μm) on a sliding microtome equipped with a freezing stage and further processed with an immunocytochemical procedure. Sections from a total of 79 slices with biocytin-filled glial cells were subsequently processed for light and electron microscopy.
Sections were rinsed in 0.1 m PB and then in 0.1m Tris-HCL buffer (TB), pH 7.4. Endogenous peroxidases were suppressed with 0.5–1% H2O2 in 0.1m TB for 2 hr. Sections were pretreated with 2% bovine serum albumin (BSA; Boehringer Mannheim, Indianapolis, IN), 0.25% dimethylsulfoxide (DMSO; Sigma), and 0.05 m Tris-buffered saline (TBS), pH 7.4, for 1 hr to reduce nonspecific background staining and to permeabilize membranes.
Sections were rinsed in 0.1 m TBS for 30 min and then incubated in an Elite ABC kit (Vector Laboratories, Burlingame, CA), diluted 1:500 in 0.5% BSA, 0.25% DMSO, and 0.05 m TBS for 36–48 hr at 4°C. Sections were then rinsed thoroughly in 0.1m TBS followed by 0.1 m TB, pH 7.6, and preincubated in 0.025% 3,3′-diaminobenzidine (DAB) with 0.005% NiNH4SO4 for 15 min (added to increase the density of stain). Subsequently, the sections were reacted with fresh DAB and NiNH4SO4 solution containing 0.002% H2O2 for 15–60 min. The reaction was stopped by rinses in 0.1 m TB, and the sections were mounted on gelatin-subbed slides, allow to dry, dehydrated, cleared, and coverslipped.
In some cases, sections containing well filled glial cells (single cells or groups of coupled glial cells) were further processed for electron microscopy using a method that included post-fixation in 1% osmium tetroxide in 0.1 m PB, pH 7.4, for 45 min at room temperature, alcohol dehydration, and flat embedding in Eponate 12 (Ted Pella, Redding, CA) between two aclar sheets for 24 hr at 60°C.
The biocytin-filled glial cells were photographed and reconstructed with camera lucida drawings before remounting and further sectioning. From two slices, containing single biocytin-filled glial cells (CA3 region), and from three slices with biocytin-labeled groups of coupled glial cells (CA1 region), sections were selected for ultrastructural analysis. Areas with selected biocytin-labeled glial cells were cut from embedded hippocampal sections and remounted with Eponate 12 on plastic blocks. Serial ultrathin sections were cut, stained with uranyl acetate and lead citrate, and examined on a Philips (Eindhoven, The Netherlands) 410 electron microscope.
RESULTS
CA3 and CA1 hippocampal slice astrocytes have heterogeneous resting membrane potentials and input resistance values
Glial cells were visually identified in stratum radiatum of the CA1 and CA3 subfields of acutely prepared hippocampal slices as cells with oval somata of <10 μm diameter. These cells never fired action potentials during seal formation or after injection of large depolarizing currents (Janigro et al., 1997); inhibitory or excitatory synaptic potentials or currents were never recorded in these cells, either spontaneously or in response to stimulation. However, to activation of Schaffer collaterals, these glia responded with development of inward potassium currents that were temporally distinct from responses (presumably generated by neurons) recorded with extracellular field electrodes (D’Ambrosio et al., 1996). Visual identification of these cells as astrocytes was in most cases confirmed by biocytin filling and subsequent morphological analysis of fixed sections. However, two cells in CA3 and one in CA1 were characterized morphologically as oligodendroglia (see below). Whole-cell patch-clamp recordings were performed from a total of 101 astrocytes from CA1 and CA3. With K+-gluconate-based intracellular solution, resting membrane potentials spanned a wide range (from −81 to −42 mV); the distribution of these RMPs was bimodal (Fig.1A), in agreement with previous findings obtained from cultured cortical and CA1 hippocampal astrocytes (McKhann et al., 1997a). The RMP distribution fitted with a double Gaussian function displayed peaks at −69 and −51 mV. No difference in RMP distribution was found between CA1 and CA3 astrocytes (Fig. 1B,C).
Fig. 1.

Passive properties of hippocampal astrocytes.A–C, Resting membrane potential. Whole-cell recordings obtained from 101 astrocytes located in CA1 and CA3 revealed distribution of resting membrane potentials from −81 to −42 mV. RMP values were fitted by a double Gaussian function with peaks at −69 and −51 mV. The range and distribution of RMP were the same for radiatum CA1 astrocytes (B) and for radiatum CA3 astrocytes (C). D–F, Input resistance. The average input resistance of the 101 recorded astrocytes was 117 ± 9 MΩ (D), but CA1 and CA3 RIN values had a different pattern of distribution. CA1 astrocytes had RIN ranging from 15 to 195 MΩ with an average of 76 ± 7 MΩ (E), whereas CA3 astrocytes had a broader distribution of RIN, ranging from 46 to 530 MΩ (mean ± SEM, 142 ± 14 MΩ;F).
Mean input resistance based on all the recorded astrocytes was 117 ± 88 MΩ (mean ± SD; n = 101; Fig.1D). The high SD was attributed to the fact that recordings obtained in CA3 and CA1 were characterized by different RIN values. Recordings obtained from CA1 glia yielded an average input resistance of 76 ± 7 MΩ (n = 46), whereas those obtained from CA3 glia gave 142 ± 14 MΩ (n = 55; Fig. 1E,F; p≪ 0.001).
CA1 and CA3 astrocytes display a different degree of intercellular coupling
Previous studies by others (Bordey and Sontheimer, 1997) showed little cell-to-cell dye coupling among CA1 hippocampal astrocytes. In the present study, however, the low RIN values found in CA1 astrocytes could be accounted for, at least in part, by a high degree of gap junctional cell-to-cell coupling. Indeed, CA1 astrocytes were characterized by extensive coupling, as revealed by dye injection during whole-cell recording. Intercellular diffusion of biocytin was clearly greater in CA1 than in CA3 astrocytes (Fig.2). Light microscopic visualization of biocytin-filled CA1 astrocytes revealed that injection of a single cell resulted most often in staining of hundreds of cells. Injection of dye into a CA1 radiatum astrocyte labeled cells not only in radiatum but also in strata lacunosum/moleculare and oriens/alveus (Fig.2A,C). A smaller degree of cell-to-cell coupling was observed among CA3 astrocytes, in which isolated cells or small groups (< 50 cells) were frequent (Fig. 2B,C). Moreover, biocytin injections into stratum radiatum of CA3 never resulted in significant spread of biocytin labeling to astrocytes in the oriens and alveus region.
Fig. 2.
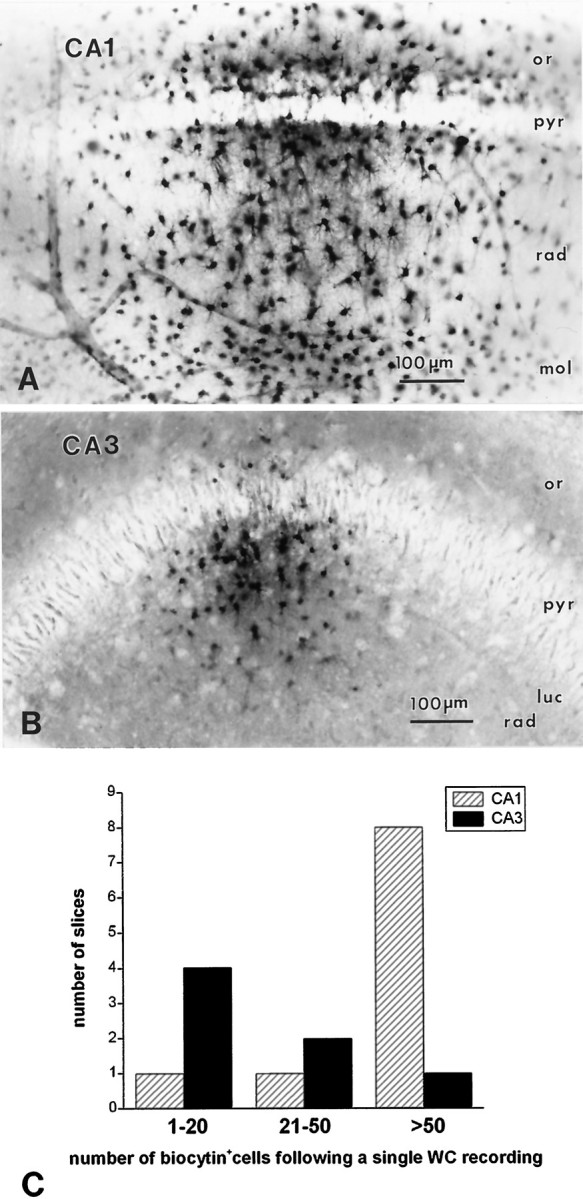
CA1 and CA3 astrocytes have different degrees of cell-to-cell coupling. A, B, Micrographs illustrating typical staining patterns of cells after biocytin injection into a “single” CA1 or CA3 hippocampal astrocyte. A, Labeling an astrocyte in stratum radiatum CA1 typically resulted in staining of hundreds of cells throughout the CA1 region. The dye often spread to stratum lacunosum and moleculare and, through stratum pyramidale, to the stratum oriens. Note that numerous biocytin-positive astrocytes were found distal to the site of injection and in proximity of blood vessels of different caliber. B, Labeling an astrocyte in stratum radiatum of CA3 typically resulted in staining of smaller groups of cells. Biocytin diffused only sparingly to strata moleculare or oriens. C, Number of biocytin-filled astrocytes per injection. CA1 injections yielded no individual cells stained and only two examples in which ≤50 cells were filled with dye. Eight CA1 injections led to widespread (>50 cells) labeling of neighboring astrocytes. In contrast, injections of astrocytes in CA3 yielded labeling of small cell populations. Four injections resulted in labeling of single or pairs of astrocytes, and the other injections stained a small group of cells (21–50). Only one CA3 injection labeled a large group (>50) of cells.
Expression of three different ion current profiles in CA1 and CA3 stratum radiatum astrocytes
The expression of voltage-dependent ionic currents expressed in mature CA1 hippocampal astrocytes was characterized in previous studies by Sontheimer and Waxman (1993) and Bordey and Sontheimer (1997). Ramp protocols revealed numerous regions of anomalous rectification in these cells; a variety of potassium and sodium conductances were responsible for this behavior. In these previous studies, astrocytic currents differed from those found in interneurons (characterized by expression of large sodium currents and lack of pronouncedIK inward rectification at negative potentials) and oligodendroglia (mostly linear profiles with modest inward-going rectification). These studies were performed in the absence of intracellular ATP (whole-cell recording) and were thus obtained under conditions favoring current rundown and closure of intercellular gap junctions (Vera et al., 1997).
We performed similar experiments under more physiological conditions (ATP and GTP added to the recording pipette) to further investigate the expression of ion currents in hippocampal astrocytes. A ramp voltage command (from −170 mV to +100 mV in 750 msec) was applied after establishment of stable recording in the whole-cell configuration. The profile of these quasi-steady-state currents was used to classify 92 cells studied in CA1 and CA3 subregions of the slice. Under voltage clamp, we recorded three profiles of current response to the voltage ramp, termed “complex,” “inward rectifier,” and “linear” (Fig. 3A). Complex profiles were characterized by three pronounced regions of anomalous rectification (Fig. 3A, left panel, arrows) and resembled the ion current profile described in ATP-free recordings from astrocytes by Sontheimer and Waxman (1993). Inward rectifier profiles were characterized by inward-going rectification in the depolarized region of the ramp command. Linear profiles were characterized by nearly ohmic behavior of the whole-cell current (Fig. 3A, right panel).
Fig. 3.

Three whole-cell current profiles are recognizable in subpopulations of hippocampal astrocytes. Whole-cell recordings from 92 CA1 and CA3 astrocytes were classified in three categories, according to the profile of the whole-cell current evoked by a ramp voltage command from −170 to +100 mV (750 msec duration; holding potential, −70 mV). A, A complex profile cell was characterized by three points of current rectification (arrows; left panel). The open arrow indicates a region of rectification that depends on time-dependent activation or inactivation of the transient outward current rather than to a pure voltage dependency. An inward rectifier cell was characterized by pronounced inward-going rectification (middle panel), and a linear profile was characterized by an almost perfect ohmic behavior of the whole-cell current (right panel). B, Complex profile astrocytes were also characterized by expression of depolarization-induced transient outward currents (left panel). Recordings from inward rectifier and linear profile astrocytes displayed no transient outward currents (middle, right panels). For these steady-state voltage-clamp experiments, voltage commands consisted of a negative step to −80 mV (holding potential, −70 mV) followed by depolarization in 10 mV increments (inset). C, Inward currents were also differently expressed in linear, inward rectifier, or complex profile glia. Complex cells expressed inward currents displaying strong voltage- and time-dependent inactivation (arrow, left panel). Inward rectifier cells displayed hyperpolarization-activated current characterized by weak time-dependent activation (middle panel), whereas currents in linear cells had little or no time-dependent activation or inactivation (right panel).
Complex astrocytes were endowed with transient outward currents evoked by membrane depolarization (n = 10); in contrast, no transient outward currents could be elicited during recordings from inward rectifier or linear cells (n = 76; Fig.3B). The time constant of current decay in complex cells was highly voltage-dependent and increased with larger depolarizing commands. This time-dependent current inactivation was, in part, responsible for the apparent rectification of the quasi-steady-stateI–V relationship obtained with ramp protocols (Fig. 3A, open arrow).
The voltage and time dependency of inward currents evoked by hyperpolarization was also different in the three groups. Complex astrocytes expressed typical profiles of inward rectifying currents (Fig. 3C, left panel), with pronounced voltage- and time-dependent inactivation (Fig. 3C, left panel, arrow). Recordings from inward rectifier and linear cells displayed weak or no time-dependent inactivation (Fig. 3C, middle, right panels; also see Guatteo et al., 1996).
Regional distribution of linear, rectifying, and complex glia
A segregated distribution of cells with these whole-cell current profiles was found (Fig. 4). Cells showing complex and inward rectifier profiles represented 86.5% of CA3 glia. Cells with linear profiles represented 13.5% of CA3 glia. Conversely, linear profile recordings constituted 72.5% of the recorded population in CA1, and 27.5% constituted of complex or inward rectifier glia (Fig. 4). Morphological and ultrastructural analysis of three biocytin-filled cells, characterized by high RIN and complex I–V profiles, demonstrated that these cells were oligodendrocytes (see below) (Fig. 4, gray squares). The difference between CA1 and CA3 could not be explained by developmental differences of the glia sampled (Bordey and Sontheimer, 1997), because CA3 cells were recorded from 27.9 ± 0.5-d-old rats, and CA1 cells were obtained from 28.1 ± 0.5-d-old rats.
Fig. 4.

Complex, inward rectifier, and linear current profile astrocytes are topographically segregated. The majority (82.7%) of CA3 astrocytes expressed inwardly rectifying currents, whereas only 25% of astrocytes in CA1 expressed this property. Conversely, the linear profile type constituted 72.5% of the CA1 astrocytes but represented only 13.5% of the CA3 population. Two CA3 complex cells and one CA1 complex cell had the morphological appearance of oligodendroglia; they are shown separately (see Results).
Although our recordings revealed three types of whole-cell current profiles, the RMP values for these cells did not differ within the same region or between CA1 and CA3 (Fig.5A). In complex cells, the RMP was −71 ± 3 mV in CA1 and −68 ± 3 mV in CA3 (p = 0.58); in inward rectifiers, RMP was −69 ± 2 mV in CA1 and −66 ± 2 mV in CA3 (p = 0.16). Linear cells were characterized by an RMP of −67 ± 2 mV in CA1 and −68 ± 2 mV in CA3 (p = 0.82). No statistically significant differences were found by comparing across resting membrane potentials in CA1 versus CA3 or when comparing values between complex, linear, or inward rectifier cells within CA1 or CA3.
Fig. 5.

Passive properties of CA3 and CA1 astrocytes.A, Resting membrane potentials were not statistically significantly different in the three subpopulations (based on current profile) of astrocytes in either CA1 or CA3 regions: CA1 complex, −71 ± 3 mV (n = 3); inward rectifier, −69 ± 2 mV (n = 8); linear, −67 ± 2 mV (n = 29); CA3 complex, −68 ± 3 mV (n = 10); inward rectifier, −66 ± 2 mV (n = 32); and linear, −68 ± 2 mV (n = 7). B, Cell input resistance values were significantly lower in CA1 than CA3 astrocytes regardless of current profile. RIN values were, for complex profile cells: CA1, 70 ± 20 MΩ (n = 3); and CA3, 230 ± 20 MΩ (n = 10); for inward rectifier profile cells: CA1, 65 ± 10 MΩ (n = 8); and CA3, 150 ± 30 MΩ, (n = 32); and for linear profile cells: CA1, 75 ± 15 MΩ (n = 29); and CA3, 68 ± 10 MΩ (n = 7).C, There was no significant correlation between cell resting membrane potential and input resistance in hippocampal astrocytes. Fitting of RIN data plotted against RMP gave a slope of 1.63 MΩ/mV.
CA3 and CA1 complex, inward rectifier, and linear cells were, however, characterized by different input resistances (Fig. 5B). For complex cells, RIN was 70 ± 20 MΩ in CA1 and 230 ± 20 MΩ in CA3 (p < 0.005). Cells with inward rectifier profiles had RIN of 65 ± 10 MΩ in CA1 and 150 ± 30 MΩ in CA3 (p < 0.03). However, RIN of linear cells showed no significant differences between the two regions; input resistance was 75 ± 15 MΩ in CA1 and 68 ± 10 MΩ in CA3 (p = 0.86). Thus, the inward rectifier and complex profile cell was characterized by different input resistance according to the region in which it was recorded. These results are in agreement with the difference in cell-to-cell coupling demonstrated by morphological analysis, because extensive intercellular coupling results in lower input resistance values (Somjen, 1995). It is worthwhile to mention that it was possible to recognize complex, inward rectifier and linear profiles in cells with either low RIN (typically in CA1) or high RIN (typically in CA3), indicating that under our experimental conditions the profile of the ramp-evoked whole-cell currents was not affected by a poor control of voltage across the syncytium (see below).
Because damage to the cell membrane can yield low cell input resistance and depolarized membrane potential, we assessed a possible correlation between depolarized RMP and low cell input resistance. We found no correlation between RMP and RIN. This result is inconsistent with what would be expected if the depolarized membrane potentials were caused by damage, thus suggesting that membrane injury was not responsible for depolarized RMP (McKhann et al., 1997a). Linear regression analysis of RIN plotted against RMP gave a slope of +1.63 MΩ/mV (Fig. 5C).
Complex, inward rectifier and liner astrocytes are differently endowed with Cs+-sensitive currents
Inward rectifying currents expressed in glia are exquisitely sensitive to blockade by extracellular cesium ions (Ransom and Sontheimer, 1995; McKhann et al., 1997a). Bath application of Cs+ (1 mm) revealed a correlation between whole-cell current profile and expression of Cs+-sensitive, inwardly rectifying currents (Figs.6A–C, 7). Complex profile astrocytes were characterized by a large Cs+-sensitive component (78 ± 13% at −140 mV, 41 ± 5% at −90 mV; n = 7). In contrast, linear profile cells showed virtual absence of Cs+-sensitive currents (6.5 ± 1% at −140 mV, 3.1 ± 1% at −90 mV; n = 14). Inward rectifier profiles displayed, on average, an intermediate Cs+sensitivity (between that of complex and linear astrocytes; 27.3 ± 7% at −140 mV, 24 ± 3.5% at −90 mV; n = 15).
Fig. 6.

Complex, inward rectifier, and linear astrocytes have different expression of Cs+-sensitive currents. The voltage ramp-evoked whole-cell current profile was highly predictive of an astrocyte’s sensitivity to Cs+.A, Complex cells exhibited large Cs+-sensitive currents. Linear cells, in contrast, displayed little or no Cs+ sensitivity (C). Inward rectifier cells expressed an intermediate level of Cs+-sensitive currents (B). Recordings characterized by high RIN values were obtained from complex, inward rectifier, and linear cells (D–F); biocytin filling revealed that these recordings were obtained from isolated, uncoupled cells (in the CA3 region). D, An isolated complex astrocyte was characterized by large membrane capacitance (25–50 pF), by three points of whole-cell current rectification, and by inward current that was very sensitive to Cs+.E, An inward rectifier cell was characterized by membrane capacitance of 8–10 pF and by Cs+sensitivity intermediate between that of complex cells and linear cells. F, Whole-cell current profile of an astrocyte with a linear profile, which showed dynamic coupling to another cell. The isolated linear astrocyte had capacitance of 7–10 pF and displayed ohmic behavior; the whole-cell current was not affected by Cs+. Voltage commands consisted of ramps from −170 to +100 mV in 750 msec from a holding potential of −70 mV (see Fig.3A, inset).
Fig. 7.

Relation between whole-cell current profile and expression of Cs+-sensitive, inwardly rectifying currents. The percentages of Cs+-sensitive currents in complex, inward rectifier, and linear cells are shown for holding membrane potentials of −140 and −90 mV. Bath application of Cs+ (1 mm) revealed that complex cells were characterized by a large Cs+-sensitive component (78 ± 13% at −140 mV, 41 ± 5% at −90 mV;n = 7). In contrast, linear profile cells showed a virtual absence of Cs+-sensitive currents (6.5 ± 1% at −140 mV, 3.1 ± 1% at −90 mV; n = 14). Inward rectifier profile cells displayed, on average, an intermediate Cs+ sensitivity (between that of complex and linear cells; 27.3 ± 7% at −140 mV, 24 ± 3.5% at −90 mV; n = 15).
The three types of current profiles are attributable to different properties of elementary units
Recordings characterized by high input resistance (>200 MΩ) and low cell capacitance (<50 pF) and resulting in a single cell filled with biocytin were considered proof of recordings from single cells. By use of these criteria, we were able to distinguish three types of elementary units and isolated astrocytes whose whole-cell current resembled the three current profiles generally found throughout the hippocampal slice and recorded from cellular syncytia of variable magnitude. Isolated complex cells had RIN of 220–300 MΩ and capacitance of 25–50 pF (example shown in Fig.6D). Inward rectifier cells had Rin of 450–570 MΩ and capacitance of 8–10 pF (Fig. 6E). Single linear astrocytes had RIN of 260–400 MΩ and a cell capacitance of 7–9 pF (Fig. 6F).
Spontaneous changes in the electrophysiological properties of glial syncytia, as first described by McKhann et al. (1997a), were sometimes observed during recordings from hippocampal astrocytes. The current profile evoked by the ramp command did not change during this change in coupling. Figure 6F shows one of these episodes, recorded in a linear profile CA1 astrocyte. The cell was voltage-clamped at −70 mV, and ramp voltage commands were imposed every 20 sec. The low capacitance value (7 pF) recorded immediately after establishment of the whole-cell configuration was consistent with a recording from an individual cell. In the ensuing minutes, cell coupling-dependent change in whole-cell current was observed, leading to a doubling of cell capacitance and slope conductance (from 7 to 14 pF and from 3.7 to 6.4 nS); this suggested that the recording was performed from two cells undergoing dynamic coupling–uncoupling changes. This was further demonstrated by morphological analysis that revealed that two cells were stained by biocytin during this recording (see Fig. 9D). As in syncytia characterized by a linear profile, the whole-cell current recorded from these cells was insensitive to Cs+ (2 mm).
Fig. 9.
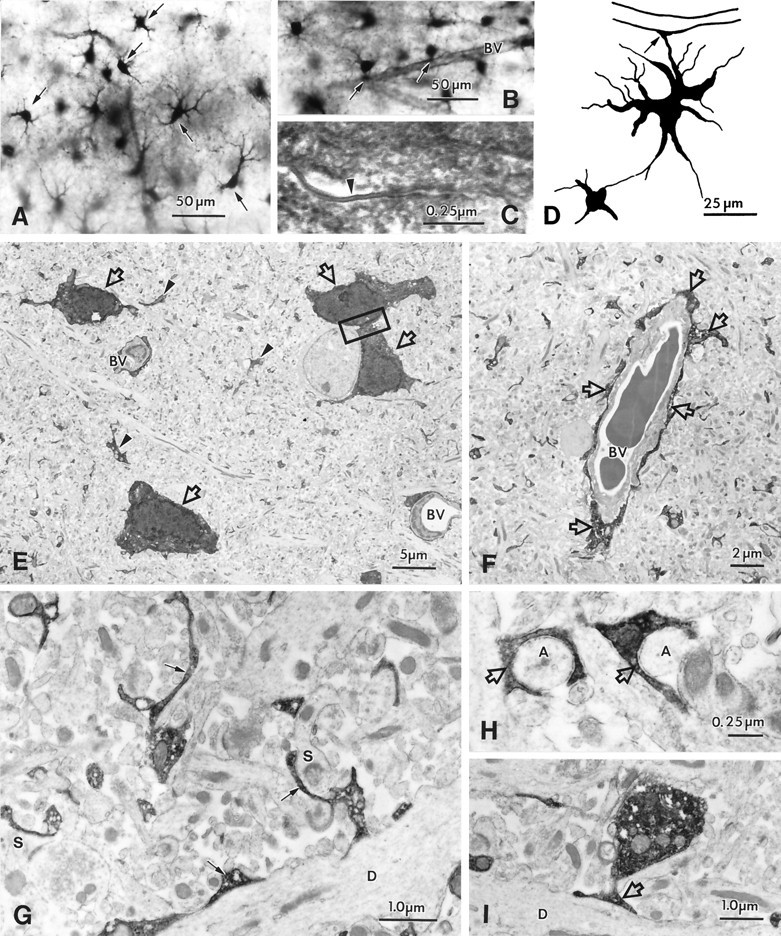
Light and electron microscopy of biocytin-filled astrocytes in the hippocampal CA1 region.A, Biocytin-filled astrocytes (arrows) and their processes in stratum radiatum show random and longitudinal orientation. All astrocytes have primary processes tapering from a large cell body; these processes branch into many fine smooth processes. Astrocytic processes in this region end freely or terminate in end feet onto blood vessels. B, Astrocytes localized close to a blood vessel (BV) with processes forming vascular end feet (arrows).C, Electron micrograph of a gap junction (arrowhead) between cell bodies of two biocytin-filled astrocytes (indicated in E). D, Camera lucida drawing of two coupled astrocytes in the CA1 and subicular region with a vascular end food (arrow) on a capillary; the electrophysiological properties of these cells are shown in Figure 6F.E, Low-power electron micrograph from stratum radiatum in the CA1 region, showing biocytin-filled astrocytes (arrows) and their processes (arrowheads). Note two blood vessels (BV) surrounded by astrocytic processes.F, Electron micrograph of a blood vessel (BV), with vascular end feet forming the glial limiting membrane around the blood vessel (arrows). G–I, Electron micrographs of the neuropil, in stratum radiatum, demonstrating biocytin-filled, fine astrocytic processes. These processes form sheath-like profiles and surround synapses (S in G) and small axons (A in H) or are attached to large dendrites (D in G, I).
Blockade of inward rectifier channels prevents influx of K+
In another set of experiments, we investigated the possible involvement of astrocytic IIR in K+uptake through voltage-dependent ion channels. To this end, we quantified the ability of 1 mm Cs+, applied extracellularly, to prevent the development of inward currents in response to increases in extracellular potassium. We performed these experiments by adding K+-gluconate (8 mm) to the ACSF to a final [K+]out of 12.35 mm. As predicted by the voltage-clamp data presented above (Figs. 6,7), only astrocytes endowed with Cs+-sensitive, inwardly rectifying currents displayed a reduction of K+-induced currents after exposure to extracellular Cs+ (Fig.8). This effect was proportional to the amplitude of the Cs+-sensitive current. Thus, complex and inward rectifier cells exposed to high [K+]out were the most affected by Cs+, whereas K+-evoked inward currents recorded from linear profile astrocytes were virtually unaffected (Fig. 8A). The cumulative results from these experiments are shown in Figure 8B. Because there is a voltage dependency of Cs+ actions onIIR, we report the data obtained after applications of elevated K+ (and Cs+) at two different voltages. In linear astrocytes, Cs+ prevented 7 ± 4% of K-induced inward currents at −90 mV and 15 ± 5% (n = 9) at −100 mV (n = 5). In inward rectifier and complex cells, Cs+ prevented 35 ± 8% of the inward current at −90 mV (n = 7) and 55 ± 10% at −100 mV (n = 3).
Fig. 8.

Cs+ prevents K+-induced inward currents in complex and inward rectifier cells but not in linear astrocytes. A, left panel, Voltage-clamped astrocytes (−90 mV) exposed to high (12 mm) K+ developed inward currents that were blocked by extracellular Cs+ (1 mm). Complex cells showed the greatest sensitivity to Cs+ blockade of these currents. Middle panel, Inward currents in inward rectifier astrocytes displayed intermediate Cs+ sensitivity. Right panel, Inward currents elicited by high K+in linear astrocytes were virtually unaffected by Cs+. Bars indicate the time of K+ and/or Cs+ application. Two traces are superimposed, and baselines were zeroed for clarity.B, Statistical comparison of the cumulative data obtained from the experiments illustrated above. Inward rectifier and complex cells were grouped together to emphasize their similar sensitivity to cesium, and percentage of blockade is given for holding membrane potentials of −90 and −100 mV.
Are complex cells astrocytes?
The results presented above indicate that there is a segregated expression of ion currents in subpopulations of hippocampal astrocytes. Previous findings from other laboratories, however, failed to unveil such heterogeneity among in situ glia. The electrophysiological data in this and previous studies clearly rule out the possibility that these glial recordings were obtained from different neuronal types. Using intracellular labeling with biocytin, we attempted to correlate electrophysiological properties with morphological characteristics. However, because most glial cell injections resulted in the labeling of multiple cells, we assume that these recordings were indeed from astrocytes. To assess individual cell morphological characteristics, however, we were limited to injections in which only a single cell was labeled. We analyzed the light microscopic and ultrastructural features of individual cells.
One cell had expected light microscopic features of an astrocyte (camera lucida reconstruction in Fig.9D). The electrophysiological properties of this cell were characterized by a linear profile. Its morphology was similar to that of cells seen when the biocytin label filled multiple glia (Fig. 9A): a relatively large cell body with tapering primary processes that branched into many fine smooth processes. The processes of such cells were often seen onto blood vessels, not only at the light microscopic level, but also at the ultrastructural level, where glial end feet could be seen on capillaries (Fig. 9B,F). Astrocytic processes in the neuropil were seen applied to large dendrites (Fig.9G,I) and surrounding synapses (Fig. 9G) and small axons (Fig. 9H). As would be predicted by the high frequency of multiple cell labeling, astrocytes made gap junctions with each other (Fig. 9C,E); even the “single” labeled astrocyte was found to be coupled to another cell (Fig.9D).
In contrast, three other cells (electrophysiologically characterized as complex) had a small cell body and numerous thin, filamentous processes that originated directly from the soma (Fig.10A–C); these processes were punctuated with wider segments (varicosities) suggestive of regions of specializations. Such processes were never seen in proximity of blood vessels, nor were there regions of contact with capillary endothelial cells. The ultrastructure of these cells suggested that they were oligodendrocytes rather than astrocytes (Fig.10D–K). In particular, the beaded processes of these glia were frequently associated with thin axonal processes. Even with the dense biocytin staining obscuring some of the fine detail, it was clear that these labeled glia provided myelin ensheathment of axons running through the region.
Fig. 10.

Light and electron microscopy of biocytin-filled complex cells with oligodendrocyte morphology in the hippocampal CA3 region. A–C, Photomicrograph (A) and camera lucida drawings (B, C; B, same cell as in A) of oligodendrocytes. The fine processes of these oligodendrocytes radiate from polygonal cell bodies, are rather more delicate than those of astrocytes, and show periodic swellings (compare with Fig. 9A–D). D, Low-power magnification of the neuropil in stratum moleculare in CA3 showing a cross-section of the oligodendrocyte cell body (arrow inA) and processes (areas 1, 2).E, Electron micrograph of a biocytin-filled oligodendrocyte’s process, which forms a myelin sheath (arrowheads) around an axon (A).F, A myelinated axon (A) without biocytin is shown for comparison. G, Electron micrograph of a myelinated axon (A) showing the connecting process of the oligodendrocyte (arrows), the external tongue process (T), and the myelin sheath (MS). H, Higher magnification of a portion of the myelin sheath (indicated area in G) demonstrating that the myelin sheath is biocytin-filled. Note the axolemma (A), the lamellae, and outer membrane (OM) of the myelin sheath. I, Higher magnification of a varicosity-like swelling (arrow) of an oligodendrocyte process (area1 in D). J, K, Longitudinal sections of myelinated axons (cell in A; area 2 in D) demonstrate biocytin-filled oligodendrocyte processes (arrows) and the surrounding myelin sheaths (arrowheads). Note the different axon diameter and thickness of the myelin sheaths of both axons.
Although the electrophysiological properties of these complex cells were similar to those described previously for astrocytes (Sontheimer and Waxman, 1993), these ultrastructural morphological analyses demonstrated that at least some of the complex cells were oligodendroglia. We therefore reanalyzed the data presented in Figure 4after removal of the cells morphologically characterized as oligodendroglia (n = 3). Because the number of such cells was small, the overall heterogeneous distribution of Cs+-sensitive versus Cs+-insensitive astrocytes in CA1 versus CA3 was preserved.
Cs+-induced epileptiform activity originates in the CA3 region
In previous reports, we and others demonstrated that bath application of Cs+ paired to orthodromic stimulation leads to [K+]outaccumulation in CA1 radiatum, leading to epileptiform activity and loss of synaptic plasticity (Maccaferri et al., 1994; Janigro et al., 1997). We attributed these effects to impaired uptake of K+into glia caused by the blockade of IIRchannels. Our present results, however, suggest that radiatum CA3 astrocytes are likely to be more sensitive to Cs+than those located in CA1, and that CA1 astrocytic function is unlikely to be greatly affected by Cs+ application. We thus hypothesized that neuronal synchronization in CA1 was a consequence of impaired glial function in CA3. To test this hypothesis we investigated the topographic origin and time course of Cs+-induced epileptogenesis in hippocampal slices. Cs+ was applied to the bath during activation of Schaffer collaterals (SCs), and paired field recordings were obtained from strata pyramidale of CA1 and CA3. (Fig.11).
Fig. 11.

Cs+-induced epileptiform activity originates in the CA3 region. Pairing extracellular Cs+ with SC stimulation induces spontaneous activity. The left panel shows the configuration of the recording and stimulating electrodes. Field electrodes were placed in strata pyramidale CA1 and CA3. The stimulating electrode was initially placed in stratum radiatum of CA2. SC stimulation for 15 min at 1 Hz and subsequent stimulation at 0.1 Hz revealed the appearance of spontaneous discharge that was first detected in CA3. A, Panels show the field recordings at 2, 5, and 7 min after 1 Hz stimulation in Cs+; records were taken in the absence of orthodromic stimulation. B, After an increase in spontaneous activity in CA3, synchronized discharges appeared in CA1 radiatum. Asterisks mark stimulus-induced activation. Unstimulated (spontaneous) synchronous activity increased in frequency and appeared simultaneously in both regions (right).C, After SC resection, CA3 retained spontaneous activity (in the absence of stimulation), whereas CA1 become silent (middle, right panels).
Bath application of Cs+ (2 mm) during 15 min of 1 Hz SC stimulation and during a subsequent 5–25 min period of stimulation at 0.1 Hz induced a progressive development of spontaneous epileptiform burst activity as described previously (Maccaferri et al., 1994; Janigro et al., 1997). The occurrence of spontaneous discharge in CA3 preceded the appearance of any field potential events in CA1 (Fig.11A); subsequently, synchronous spontaneous episodes appeared in both CA3 and CA1 (Fig. 11B). To determine whether spontaneous burst discharge was generated in CA1 or whether CA3 was synaptically driving CA1, we cut the SCs that synaptically connect CA3 to CA1. Recording electrodes were then replaced on the slice at their original positions (Fig. 11C). In all the slices tested, this procedure revealed interictal-like spontaneous activity in CA3; however, spontaneous discharge was no longer apparent in CA1 when CA1 was separated from CA3 (n = 6).
DISCUSSION
To our knowledge, this is the first report demonstrating functional segregation of discrete classes of astrocytes within the hippocampus. We showed that at least three electrophysiologically distinct subpopulations of astrocytes can be recorded in stratum radiatum. Furthermore, cells displaying electrophysiological properties previously ascribed only to astrocytes (complex cells) exhibit morphological properties typical of oligodendroglia. Most CA3 astrocytes were characterized by expression of time- and voltage-dependent currents, including high levels of Cs+-sensitive IIR; in contrast, most CA1 cells were characterized by linear current–voltage relationships. Most recordings were associated with glial syncytia (as seen with biocytin labeling) consisting of variable numbers of cells. However, successful recordings from individual cells confirmed that the three electrophysiological categories reflected properties of individual astrocytes or oligodendroglia. In addition to different expression of ionic currents, CA1 and CA3 astrocytes displayed different levels of cell-to-cell coupling, further demonstrating that hippocampal glia are characterized by a pattern of regional specialization. These findings, together with numerous reports describing neuronal heterogeneity in the hippocampus, add an additional level of complexity to the intricacy of hippocampal neurophysiology.
Passive properties of hippocampal astrocytes
Hippocampal astrocyte RMPs were characterized by a bimodal distribution, but RMP distribution in CA1 versus CA3 did not differ significantly. In contrast, a striking difference was found when comparing RIN values; CA1 astrocytes were characterized by a higher whole-cell conductance than CA3 cells, suggesting that CA1 glia either expressed higher densities of ion currents or engaged in higher cell-to-cell coupling. We have not tested the first possibility, but the correlation of morphological data with the electrophysiology of biocytin-filled cells strongly supports the hypothesis that low RIN values observed in CA1 reflect a large degree of cell-to-cell coupling.
Why should CA1 and CA3 differ so dramatically in astrocytic coupling? These regions differ in the vascular arborization (Coyle, 1978). Compared with CA3 stratum radiatum, the corresponding CA1 region is poorly supplied with capillaries and branches of the internal transverse artery. Therefore, it may require more astrocyte-to-astrocyte coupling to connect to a blood vessel at any given point in CA1. Consistent with anatomical and functional considerations, it is believed that the localization of astrocytic profiles in proximity to blood vessels serves the dual role of regulating blood–brain barrier integrity and cerebral blood flow (Paulson and Newman, 1987; Pekny et al., 1997). It is possible that the large extent of interastrocytic coupling in CA1 is attributable to the requirement of conveying electrical or metabolic signals across poorly vascularized regions.
Heterogeneity of voltage-dependent currents
The staining of biocytin-filled cells suggested that recordings from an apparent single astrocyte actually consisted of recordings from electrical syncytia. A noticeable exception was a fraction of complex cells exhibiting morphological properties and axonal wraps typical of myelinating oligodendroglia (see below).
Three whole-cell current profiles could be recorded from electrically coupled astrocytes; we hypothesized that the electrical properties of complex, linear, and inward rectifying syncytia could be ascribed to membrane properties of individual cells. An alternative explanation for these distinct current profiles is that they represent the “electrical average” of the syncytium, weighted by the distance from the recording site of contributing cells. We decided against the use of gap junction uncouplers because of their nonspecific effects on K channels (McKhann et al., 1997b) but rather analyzed the results from experiments in which morphological analysis of biocytin-filled cells demonstrated that recordings were obtained from individual cells. These results confirmed that linear, complex, and inward rectifier profiles are intrinsic properties of individual cells.
The majority of cells in CA1 expressed almost exclusively time-independent currents characterized by a virtual absence of voltage dependency (linear cells). The remaining CA1 astrocytes expressed combinations of inward rectifier and outward currents. Three considerations lead us to conclude that recordings of ohmic currents were a faithful representation of the whole-cell currents in these cells. First, similar current profiles were recorded from CA3 astrocytes, in which lesser cell-to-cell coupling was present; in addition, these profiles could be recorded from individual cells or form pairs of coupled cells. Second, previous experiments on cultured astrocytes have demonstrated that voltage-clamp control obtained across gap junctions allows the discrimination of whole-cell currents expressed in neighboring cells (McKhann et al., 1997a); thus, space-clamp control across coupled astrocytes is feasible. Finally, reports from other laboratories also demonstrated the existence of astrocytes expressing exclusively linear, or ohmic, currents (Czeh et al., 1993; Sontheimer and Waxman, 1993).
Electrophysiological and morphological properties of complex glia
Previous studies (Sontheimer and Waxman, 1993; Bordey and Sontheimer, 1997) suggested that hippocampal slice astrocytes are often characterized by the expression of time- and voltage-dependent conductance that is responsible for the complex appearance of their current–voltage relationship. In contrast, in situoligodendroglia are believed to express a less-sophisticated set of ionic conductances (Sontheimer and Waxman, 1993). Our study confirms that complex astrocytes could be recorded in both CA1 and CA3 subregions. However, detailed ultrastructural investigation revealed that at least some of the isolated complex cells were actually oligodendroglia. Thus, although a categorical study of hippocampal slice oligodendroglia is beyond the scope of the present study, it is nevertheless important to emphasize that complex behavior does not always correlate with astrocytic morphology.
There are at least two other divergences between our present findings and those reported previously by Bordey and Sontheimer (1997). First, we found a prominent level of coupling between CA1 astrocytes, although this was less evident in their recordings (Bordey and Sontheimer, 1997). The most likely explanation for this discrepancy is that these investigators included no energy substrates in their patch pipettes during whole-cell recording (and dialysis). This omission may lead to numerous effects on cell physiology directly involved in gating of gap junction pores (McKhann et al., 1997b; Vera et al., 1997). Second, linear profiles constituted the vast majority of CA1 recordings in our study, although Bordey and Sontheimer (1997) reported a predominant expression of complex profiles in these glia. The reason for this difference is not fully explainable by the different intracellular solution used for the studies; however, it is worthwhile noting that lack of internal energy supplies may result in decreased pump activity, leading to abnormal accumulation of [Na+]i, a condition known to affect outward potassium currents (Robert and Magistretti, 1997).
Cs+-induced synchronicity initiates in the CA3 region
We demonstrated that Cs-mediated epileptogenesis is independent of its actions on neuronal currents (Janigro et al., 1997). We thus hypothesized that blockade of voltage-dependent potassium uptake into glia may be responsible for Cs+ effects. If Cs+ indeed impedes SB, then our current findings of a segregated distribution of Cs+-sensitive astrocyte currents lead to the prediction that the CA3 region should be more sensitive to Cs+. This prediction was tested by CA1 and CA3 recordings. Cs+-induced interictal-like activity was invariably initiated in CA3 and appeared in CA1 only after a delay. Epileptiform activity in CA1 was synaptically driven by CA3, because surgical separation of the two regions obliterated spontaneous bursting in CA1 but not in CA3. Thus, the epileptogenic actions of Cs+ are primarily mediated by effects on astrocyteIIR in the CA3 subfield because of the preferential expression of astrocytic IIR of this region.
Implications for hippocampal physiology
A direct demonstration that IIR plays a role in potassium uptake into glia has only been recently provided (Newman, 1995; McKhann et al., 1997a). We show that elevated [K]out can be partially dissipated by mechanisms related to IIR expression. Thus, in most CA3 but only some CA1 astrocytes, inward currents elicited by [K]outwere reduced by Cs+. The relative contribution of other K uptake mechanisms, particularly in CA1 glia (in which currents were minimally sensitive to, and K fluxes were unaffected by, Cs+) remains to be elucidated.
The propensity of the hippocampus toward synchronicity has been related to numerous mechanisms, including tight packaging of pyramidal neurons and ephaptically mediated excitability, and the presence of recurrent excitation in CA3. Synchronous discharge induced by a variety of epileptogenic stimuli, including high K+ (Traynelis and Dingledine, 1988), often originates in the CA3 region and spreads synaptically to CA1. The propensity of CA3 to generate epileptiform bursts correlates well with the intrinsic properties of CA3 neurons (burst firing) and with recurrent excitatory synapses from one CA3 neuron onto others. Other features of CA3, however, provide resistance against hyperexcitability and synchronicity. First, inhibitory synaptic mechanisms counter synaptic excitation of the recurrent circuitry. Second, the vascular supply to CA3 is more extensive than in other cortical regions, and the size of the CA3 extracellular space is larger than in CA1 (McBain et al., 1990); these conditions favor preservation of electrochemical gradients during intense neuronal activity. Our results are consistent with CA3 expression of physiological mechanisms involved in ion homeostasis; the presence of energy-independent, ion channel-mediated pathways to buffer [K]out confers this region with a powerful mechanism for preserving normal neuronal function.
In summary, we have described a functional segregation of three categories of hippocampal astrocytes, based on their sensitivity to Cs+. Further heterogeneity was evident when considering the voltage- and time-dependent properties of these glia. Based on our results and reports from other laboratories, it appears that astrocytic IIR channels involved in spatial buffering play an important role in maintaining normal excitability in mammalian hippocampus.
Footnotes
This work was supported by National Institutes of Health National Institute of Environmental Health Sciences Grants ES07033 and NS51614 to D.J., NS35548 to P.A.S., and NS10217–01 to G.M.M. and by a grant from the Research Foundation of The American Association of Neurological Surgeons to G.M.M.
Correspondence should be addressed to Dr. Damir Janigro, University of Washington 359914, Harborview Medical Center, 325 Ninth Avenue, Seattle, WA 98104.
REFERENCES
- 1.Ballanyi K, Grafe P, Bruggencate GT. Ion activities and potassium uptake mechanisms of glial cells of guinea-pig olfactory cortex slices. J Physiol (Lond) 1987;382:159–174. doi: 10.1113/jphysiol.1987.sp016361. [DOI] [PMC free article] [PubMed] [Google Scholar]
- 2.Bear MF, Malenka RC. Synaptic plasticity: LTP and LTD. Curr Opin Neurobiol. 1994;4:389–399. doi: 10.1016/0959-4388(94)90101-5. [DOI] [PubMed] [Google Scholar]
- 3.Bordey A, Sontheimer H. Postnatal development of ionic currents in rat hippocampal astrocytes in situ. J Neurophysiol. 1997;78:461–477. doi: 10.1152/jn.1997.78.1.461. [DOI] [PubMed] [Google Scholar]
- 4.Coyle P. Spatial features of the rat hippocampal vascular system. Exp Neurol. 1978;58:549–561. doi: 10.1016/0014-4886(78)90108-5. [DOI] [PubMed] [Google Scholar]
- 5.Czeh G, Aitken PG, Somjen GG. Membrane currents in CA1 pyramidal cells during spreading depression (SD) and SD-like hypoxic depolarization. Brain Res. 1993;632:195–208. doi: 10.1016/0006-8993(93)91154-k. [DOI] [PubMed] [Google Scholar]
- 6.D’Ambrosio R, McKhann GM, Janigro D. Whole-cell recording from hippocampal astrocytes during orthodromic stimulation. Soc Neurosci Abstr. 1996;22:128.16. [Google Scholar]
- 7.Dietzel I, Heinemann U, Lux HD. Relations between slow extracellular potential changes, glial potassium buffering, and electrolyte and cellular volume changes during neuronal hyperactivity in cat brain. Glia. 1989;2:25–44. doi: 10.1002/glia.440020104. [DOI] [PubMed] [Google Scholar]
- 8.Gardner-Medwin AR. A study of the mechanism by which potassium moves through brain tissue in the rat. J Physiol (Lond) 1983;335:353–374. doi: 10.1113/jphysiol.1983.sp014539. [DOI] [PMC free article] [PubMed] [Google Scholar]
- 9.Gardner-Medwin AR, Nicholson C. Changes in extracellular potassium activity induced by electric current through brain tissue in the rat. J Physiol (Lond) 1983;335:375–392. doi: 10.1113/jphysiol.1983.sp014540. [DOI] [PMC free article] [PubMed] [Google Scholar]
- 10.Guatteo E, Stanness KA, Janigro D. Hyperpolarization-activated currents in cultured rat cortical and spinal cord astrocytes. Glia. 1996;16:196–209. doi: 10.1002/(SICI)1098-1136(199603)16:3<196::AID-GLIA2>3.0.CO;2-0. [DOI] [PubMed] [Google Scholar]
- 11.Haglund MM, Stahl WL, Kunkel DD, Schwartzkroin PA. Developmental and regional differences in the localization of Na, K-ATPase activity in the rabbit hippocampus. Brain Res. 1985;343:198–203. doi: 10.1016/0006-8993(85)91180-1. [DOI] [PubMed] [Google Scholar]
- 12.Janigro D, Schwartzkroin PA. Effects of GABA and baclofen on pyramidal cells in the developing rabbit hippocampus: an “in vitro” study. Brain Res. 1988a;469:171–184. doi: 10.1016/0165-3806(88)90180-0. [DOI] [PubMed] [Google Scholar]
- 13.Janigro D, Schwartzkroin PA. Effects of GABA on CA3 pyramidal cell dendrites in rabbit hippocampal slices. Brain Res. 1988b;453:265–274. doi: 10.1016/0006-8993(88)90166-7. [DOI] [PubMed] [Google Scholar]
- 14.Janigro D, Gasparini S, D’Ambrosio R, McKhann GM, DiFrancesco D. Reduction of K+ uptake in glia prevents LTD maintenance and causes epileptiform activity. J Neurosci. 1997;17:2813–2824. doi: 10.1523/JNEUROSCI.17-08-02813.1997. [DOI] [PMC free article] [PubMed] [Google Scholar]
- 15.Kirino T, Tamura A, Sano K. Selective vulnerability of the hippocampus to ischemia: reversible and irreversible types of ischemic cell damage. Prog Brain Res. 1985;63:39–58. doi: 10.1016/S0079-6123(08)61974-3. [DOI] [PubMed] [Google Scholar]
- 16.Maccaferri G, Janigro D, Lazzari A, DiFrancesco D. Cesium prevents maintenance of long-term depression in rat hippocampal CA1 neurons. NeuroReport. 1994;5:1813–1816. doi: 10.1097/00001756-199409080-00032. [DOI] [PubMed] [Google Scholar]
- 17.McBain CJ, Traynelis SF, Dingledine R. Regional variations of extracellular space in the hippocampus. Science. 1990;249:674–677. doi: 10.1126/science.2382142. [DOI] [PubMed] [Google Scholar]
- 18.McKhann GM, D’Ambrosio R, Janigro D. Heterogeneity of astrocyte resting membrane potentials revealed by whole-cell and gramicidin-perforated patch recordings from cultured neocortical and hippocampal slice astrocytes. J Neurosci. 1997a;17:6850–6863. doi: 10.1523/JNEUROSCI.17-18-06850.1997. [DOI] [PMC free article] [PubMed] [Google Scholar]
- 19.McKhann GM, D’Ambrosio R, Janigro D. Potential pitfalls in the pharmacological investigation of astrocyte ion channels and gap-junctions. Soc Neurosci Abstr. 1997b;23:1747. [Google Scholar]
- 20.Newman EA. Voltage-dependent calcium and potassium channels in retinal glial cells. Nature. 1985;317:809–811. doi: 10.1038/317809a0. [DOI] [PMC free article] [PubMed] [Google Scholar]
- 21.Newman EA. High potassium conductance in astrocyte endfeet. Science. 1986;233:453–454. doi: 10.1126/science.3726539. [DOI] [PMC free article] [PubMed] [Google Scholar]
- 22.Newman EA. Glial cell regulation of extracellular potassium. In: Kettenmann H, Ransom BR, editors. Neuroglia. Oxford UP; New York: 1995. pp. 717–731. [Google Scholar]
- 23.Newman EA, Frambach DA. Control of extracellular potassium levels by retinal glial cell K+ siphoning. Science. 1984;225:1174–1175. doi: 10.1126/science.6474173. [DOI] [PMC free article] [PubMed] [Google Scholar]
- 24.Orkand RK, Nicholls JG, Kuffler SW. Effect of nerve impulses on the membrane potential of glial cells in the CNS of amphybia. J Neurophysiol. 1966;29:788–806. doi: 10.1152/jn.1966.29.4.788. [DOI] [PubMed] [Google Scholar]
- 25.Paulson OB, Newman EA. Does the release of potassium from the endfeet regulate cerebral blood flow? Science. 1987;237:896–898. doi: 10.1126/science.3616619. [DOI] [PMC free article] [PubMed] [Google Scholar]
- 26.Pekny M, Stanness KA, Eliasson C, Betsholtz C, Janigro D. Impaired induction of blood-brain barrier properties in aortic endothelial cells by astrocytes from GFAP-deficient mice. Glia. 1997;22:1–11. [PubMed] [Google Scholar]
- 27.Ransom CB, Sontheimer H. Biophysical and pharmacological characterization of inwardly rectifying potassium currents in rat spinal cord astrocytes. J Neurophysiol. 1995;73:333–346. doi: 10.1152/jn.1995.73.1.333. [DOI] [PubMed] [Google Scholar]
- 28.Robert A, Magistretti PJ. AMPA/kainate receptor activation blocks K+ currents via internal Na+ increase in mouse cultured stellate astrocytes. Glia. 1997;20:38–50. [PubMed] [Google Scholar]
- 29.Somjen GG. Electrophysiology of mammalian glial cells in situ. In: Kettenmann H, Ransom BR, editors. Neuroglia. Oxford UP; New York: 1995. pp. 319–331. [Google Scholar]
- 30.Sontheimer H, Waxman SG. Expression of voltage-activated ion channels by astrocytes and oligodendrocytes in the hippocampal slice. J Neurophysiol. 1993;70:1863–1873. doi: 10.1152/jn.1993.70.5.1863. [DOI] [PubMed] [Google Scholar]
- 31.Traynelis SF, Dingledine R. Potassium-induced spontaneous electrographic seizures in rat hippocampal slices. J Neurophysiol. 1988;59:259–276. doi: 10.1152/jn.1988.59.1.259. [DOI] [PubMed] [Google Scholar]
- 32. Vera B, Sanchez-Abarca LI, Bolanos JP, Medina JM. Inhibition of astrocyte gap-junctional communication by ATP depletion is reversed by calcium sequestration. FEBS Lett 392 1997. 3:225–228. [DOI] [PubMed] [Google Scholar]