

ABSTRACT
Epithelial barrier dysfunction during human immunodeficiency virus (HIV) infection has largely been attributed to the rapid and severe depletion of CD4+ T cells in the gastrointestinal (GI) tract. Although it is known that changes in mucosal gene expression contribute to intestinal enteropathy, the role of small noncoding RNAs, specifically microRNA (miRNA), has not been investigated. Using the simian immunodeficiency virus (SIV)-infected nonhuman primate model of HIV pathogenesis, we investigated the effect of viral infection on miRNA expression in intestinal mucosa. SIV infection led to a striking decrease in the expression of mucosal miRNA compared to that in uninfected controls. This decrease coincided with an increase in 5′-3′-exoribonuclease 2 protein and alterations in DICER1 and Argonaute 2 expression. Targets of depleted miRNA belonged to molecular pathways involved in epithelial proliferation, differentiation, and immune response. Decreased expression of several miRNA involved in maintaining epithelial homeostasis in the gut was localized to the proliferative crypt region of the intestinal epithelium. Our findings suggest that SIV-induced decreased expression of miRNA involved in epithelial homeostasis, disrupted expression of miRNA biogenesis machinery, and increased expression of XRN2 are involved in the development of epithelial barrier dysfunction and gastroenteropathy.
IMPORTANCE MicroRNA (miRNA) regulate the development and function of intestinal epithelial cells, and many viruses disrupt normal host miRNA expression. In this study, we demonstrate that SIV and HIV disrupt expression of miRNA in the small intestine during infection. The depletion of several key miRNA is localized to the proliferative crypt region of the gut epithelium. These miRNA are known to control expression of genes involved in inflammation, cell death, and epithelial maturation. Our data indicate that this disruption might be caused by altered expression of miRNA biogenesis machinery during infection. These findings suggest that the disruption of miRNA in the small intestine likely plays a role in intestinal enteropathy during HIV infection.
INTRODUCTION
Human immunodeficiency virus (HIV) infection leads to progressive loss of CD4+ T-helper cells in the peripheral blood. However, the onset of CD4+ T cell loss is more rapid and severe in the gastrointestinal tract during the early stages of HIV infection, which contributes to the persistence of immune activation and viral reservoirs (1, 2). In the simian immunodeficiency virus (SIV)-infected nonhuman primate model of AIDS, early loss of CD4+ T cells and disruption of the gut epithelial barrier have been well characterized and have enabled investigations of the mechanisms of HIV-associated enteropathy (3). Rapid changes in the gut T cell homeostasis and disruption of the intestinal epithelial barriers early during HIV and SIV infections involve multiple complex signaling pathways and gene networks (4, 5) which manifest as nutrient malabsorption, diarrhea, and increased susceptibility to opportunistic enteric infections (6–8). Although changes in the gene expression associated with metabolism, cell cycle control, and cell growth in the gut mucosa during HIV and SIV infections have been described, the molecular mechanisms responsible for rapid alteration of gene expression and the onset of gastrointestinal dysfunction have not been fully elucidated (4, 5).
MicroRNA (miRNA) are small noncoding RNA that regulate gene expression by inducing degradation or preventing translation of their mRNA targets (9). Many miRNA regulate essential cellular processes such as cell proliferation, differentiation, and cell death (10). Alterations in miRNA expression are a well-characterized arm of the host immune response to pathogens, and several studies have suggested that miRNA play a role in HIV pathogenesis (11–14). Nevertheless, most of these studies have utilized transformed cell lines or peripheral blood mononuclear cells (PBMCs) in vitro, while alterations in miRNA expression at mucosal sites during viral infections are underinvestigated. MicroRNA regulate homeostasis and innate immune response in the gastrointestinal (GI) tract, and defects in the GI epithelial barrier integrity and nutrient malabsorption have been linked to disrupted miRNA expression (15, 16). However, the impact of HIV infection on mucosal miRNA expression and the downstream effects on gut epithelial barrier integrity, GI physiology, and function are unknown.
In the present study, we investigated the effects of HIV infection on miRNA expression in the GI tract using the SIV model of HIV pathogenesis and analyzed changes in miRNA expression patterns in the context of viral pathogenesis. We found that mucosal miRNA expression was nearly globally decreased in SIV-infected rhesus macaques. Decreased miRNA expression was associated with increased protein expression of 5′-3′-exoribonuclease 2 (XRN2) and disrupted expression of enzymes, such as DICER1 and Argonaute 2 (AGO2), involved in miRNA biogenesis. Interestingly, the decreased expression of miRNA was localized to the basal crypt region of the intestinal epithelium and was associated with pathways involved in epithelial differentiation, defense, and proliferation. Our findings indicate that the loss of miRNA might be involved in the onset of the virus-associated enteropathy.
MATERIALS AND METHODS
Animals, infections, and sample collection.
Adult male rhesus macaques (n = 26) were bred and housed at the California National Primate Research Center (CNRPC). Animals (n = 15) were intravenously inoculated with 1,000 50% tissue culture infective doses (TCID50) of SIVmac251. None of the SIV-infected animals used for these studies received antiretroviral therapy. Eleven animals were used as SIV-negative controls (Table 1). Animals were necropsied during the primary (2 weeks postinfection) or chronic (10 to 26 weeks postinfection) stage of SIV infection, and peripheral blood and intestinal tissue samples were collected. Part of the intestinal tissue was used for isolating lamina propria lymphocytes (LPL) for flow cytometric analysis, and the remaining tissue samples were flash frozen and stored at −80°C (17). Peripheral blood samples were processed immediately, and plasma viral load was determined (see below). The distribution of the T cell subsets in isolated PBMCs and LPL was determined by flow cytometry as previously described (17). Animal studies were performed under Institutional Animal Care and Use Committee (IACUC)-approved protocols (12227 and 13049).
TABLE 1.
Animal infections and immunological dataa
| Group | ID | Length of infection (wks) | Gut viral load (copies/μg RNA) | Plasma viral load (copies/ml plasma) | % of CD4+ T cells (gut) | Blood CD4+ T cell count (cells/μl) |
|---|---|---|---|---|---|---|
| SIV negative | 33675 | NA | NA | NA | 46.8 | 886 |
| 33832 | NA | NA | NA | 53.4 | 2,736 | |
| 34186 | NA | NA | NA | 42.6 | 816 | |
| 34249 | NA | NA | NA | 51.1 | 695 | |
| 35049 | NA | NA | NA | ND | ND | |
| 36782 | NA | NA | NA | 54.3 | 716 | |
| 37361 | NA | NA | NA | 40.7 | ND | |
| 37467 | NA | NA | NA | 59.0 | 407 | |
| 37753 | NA | NA | NA | 21.1 | ND | |
| 38498 | NA | NA | NA | 28.0 | 1,031 | |
| 39114 | NA | NA | NA | 67.1 | 1,099 | |
| Chronic | 34967 | 10 | 1,373 | 3,103 | 11.6 | 361 |
| 35375 | 10 | 274,789 | 2,812 | 2.6 | 776 | |
| 35470 | 10 | 347,559 | 1,076 | 6.1 | 960 | |
| 35804 | 10 | 553 | 2,779 | 2.3 | 584 | |
| 34030 | 23 | 165,234 | 4,080 | 8.0 | 2,706 | |
| 30085 | 26 | 1,477,824 | 270 | 0.7 | 353 | |
| 34084 | 27 | 603 | 18,553 | 2.8 | 238 | |
| 34686 | 27 | 125 | 1,844 | 1.6 | 209 | |
| 34785 | 27 | 2,261 | 10,272 | 1.0 | 87 | |
| 34829 | 27 | 20,649 | 170,703 | 19.4 | 509 | |
| 35075 | 27 | 250 | 37,682 | 1.9 | 694 | |
| 35088 | 27 | 249 | 5,687 | 4.9 | 160 | |
| 31353 | 28 | 164,544 | 849,000 | 14.0 | 714 | |
| Primary | 23930 | 2 | 134,149 | ND | 51.1 | ND |
| 25605 | 2 | 97,670 | ND | 7.5 | ND |
NA, not applicable; ND, no data.
Human subjects, sample collection, and clinical parameters.
Peripheral blood samples and small intestinal biopsy specimens were obtained from HIV-infected antiretroviral therapy-naive individuals (n = 5) and from HIV-negative healthy individuals (n = 4). Participants were Caucasian males 28 to 57 years of age. HIV-infected individuals were enrolled in the study using the following criteria: depletion of CD4+ T cells in the gastrointestinal mucosa (percentage of CD4+ T cells of <10%), viral load of >10,000 HIV-1 RNA copies/ml of plasma, antiretroviral therapy naive, and length of infection of >1 year with no current opportunistic or other infections. Small intestinal biopsy samples were collected by upper endoscopy and immediately cryopreserved for transcriptional analysis. A portion of gut biopsy specimen was collected in RPMI 1640 medium (Invitrogen) for cell isolation and flow cytometric analysis. Peripheral blood samples were also collected at the time of the endoscopy. Cell isolations, immunostaining, and flow cytometric analysis were performed as previously described (18). Participants were enrolled using written informed consent as approved by the University of California, Davis, Institutional Review Board.
Viral load measurements.
SIV RNA levels in the intestinal tissue and plasma samples were determined using real-time PCR (RT-PCR). Briefly, RNA was isolated from tissues (Qiagen RNeasy kit) and plasma samples (Qiagen viral RNA kit) and reverse transcribed using the superscript III kit (Invitrogen) according to the manufacturer's protocol for tissue samples. Primers and probes specific for SIV (19) or HIV (5) were used to determine viral RNA levels in both the tissue and plasma using RT-PCR. Fluorescent signal was detected using an Applied Biosystems Prism 7900 sequence detector system, and the data were analyzed with the Sequence Detector Software (SDS). The copy numbers of viral RNA were determined by plotting sample threshold cycle (CT) values against a regression curve of known viral RNA values in the plasma. In the tissue, copies/μg of RNA was determined by first normalizing the CT values to an internal control, glyceraldehyde 3-phosphate dehydrogenase (GAPDH), and then comparing the CT values against a regression curve of known values.
Gene expression analysis using DNA microarrays.
RNA was isolated using the RNeasy RNA isolation kit (Qiagen, Valencia, CA) from frozen jejunum tissue samples. Amplification of mRNA, labeling, hybridization of samples to rhesus macaque whole-genome GeneChips (Affymetrix, Santa Clara, CA), staining, and scanning were performed (according to the Affymetrix GeneChip Expression Analysis Technical Manual) at the Host-Microbe System Biology Core at the University of California, School of Medicine, as described previously (20). Statistical analysis of microarray data was performed using the Partek Genomic Suite software, version 6.6. A cutoff of ±1.5-fold change in gene expression was used to identify genes for analysis of hierarchical clustering patterns and for downstream biofunctional assessment using Ingenuity Pathway Analysis (IPA) software. From our previous experience and based on the published literature, we used a 1.5-fold change cutoff for the analysis of the gene expression data because it gives sufficient information and generates a large data set to be used for downstream pathway analysis. Moreover, changes in gene expression at this level have been demonstrated to be biologically significant (21, 22).
Small RNA sequencing and bioinformatic analysis.
RNA was isolated from intestinal tissue samples using the mirVana (Ambion) miRNA isolation kit according to the manufacturer's protocol for isolation of enriched small RNA (<200 nucleotides [nt]). The quantity of RNA in the small RNA fraction was quantified using the Bioanalyzer 2100 (Agilent). Small RNA, approximately ∼15 to 30 nt, were isolated by PAGE, and Solexa adaptors were ligated to the 3′ and 5′ ends of the molecules. The small RNA molecules were amplified using the adaptor primers for 17 cycles, and fragments of approximately 90 bp (small RNA plus adaptors) were isolated by agarose gel electrophoresis. The purified DNA was then used for cluster generation and sequence analysis using the Illumina Genome Analyzer (Illumina, San Diego, CA, USA) according to the manufacturer's instructions.
Reads present in the sequenced libraries were filtered for quality and trimmed to remove adaptor and linker sequences (23). Trimmed reads were aligned to mature macaque miRNA records present in miRBase (24–27) using BLAST (28). The percentage of reads that mapped elsewhere in the macaque genome was determined by aligning the reads that did not map to the miRNA signatures in miRBase to the macaque genome.
Real-time PCR.
Total RNA was isolated from intestinal tissue using the mirVana (Ambion) total RNA isolation kit. Ten nanograms of total RNA was used to generate cDNA with the TaqMan microRNA reverse transcription kit (Applied Biosystems). TaqMan miRNA primer probes (Applied Biosystems) specific for mature miRNA were used for RT-PCR on a Viia7 PCR and detection instrument. Samples were normalized using the endogenous U6 control gene. Unpaired two-tailed Student's t tests were performed to determine statistically significant differences in miRNA expression between groups.
Human miRNA TLDA.
Total RNA was extracted from human jejunum biopsy specimens as described above using the mirVana total RNA extraction protocol. Eight hundred nanograms of total RNA was reverse transcribed using the TaqMan microRNA reverse transcription kit and human Megaplex pool A miRNA primers according to the manufacturer's protocol (Applied Biosystems). Reverse transcribed samples were combined with TaqMan universal master mix (Applied Biosystems), loaded onto the human microRNA A v2.0 TaqMan low-density array (TLDA) cards, and run on the Applied Biosystems Prism 7900 sequence detection system according to the manufacturer's protocol. Data were analyzed using the SDS suite and heatmaps, and clustering was performed using R (29).
miRNA target pathway analysis and network generation.
Selected miRNA were imported in the Cytoscape 2.8 (30), and the CyTargetLinker 2.0 plugin was used to display predicted miRNA targets for these miRNA using two regulatory interaction networks (RINs), TargetScan (31) and MicroCosm. Predicted miRNA target lists generated in this manner were then imported into DAVID pathway analysis software (32, 33) for pathway and GO enrichment analysis. The CyTargetLinker 2.0 plugin was used to import validated miRNA targets of selected miRNA using two RINs, Tarbase (34) and mirRecords (35), and pathway analysis was performed as described above.
Laser capture microdissection.
Sections of optimal cutting temperature (OCT) compound-embedded unfixed 5-μM-thick rhesus macaque intestinal tissue sections were placed on polyethylene naphthalate (PEN) membrane slides and hematoxylin and eosin (H&E) stained as previously described (36). Stained slides were subjected to microdissection using the ArctutusXT laser microdissection system. Epithelial cells were captured from the differentiated villus epithelium compartment and proliferative crypt epithelial compartment. Villus epithelial cells were collected by dissection of cells from the villus tip to approximately halfway down the length of the villus. Epithelial cells were also collected at the base of the crypts. Total RNA was isolated from captured cells using the RNAqueous microkit according to the manufacturer's protocol. Real-time PCR was performed as described above to measure microRNA levels for each experimental group using U6 as the endogenous control and fold change calculated using the ΔCT method. Statistically significant differences between groups were determined using unpaired two-tailed Student's t tests.
Protein expression analysis.
Whole jejunum tissue was homogenized in RIPA buffer (Sigma catalog no. R0278) containing proteinase inhibitor (Calbiochem catalog no. 539134; 1:100) using the MagNalyser instrument (Roche). Protein concentration was assessed using the Coomassie Plus protein assay (Thermo), and 90 μg of protein was loaded onto 10% TGX protein gels (Bio-Rad). Gels were run with constant voltage at 100 V for 1.5 h and then transferred overnight to polyvinylidene difluoride (PVDF) membranes (Bio-Rad). The membranes were blocked with 5% dry nonfat milk and probed with anti-DICER1 (Abcam; ab5818), AGO2 (Abcam; ab32381), XRN2 (Abcam; ab72181), or GAPDH (Cell Signaling Technology; 2118). Blots were washed and then probed with goat anti-rabbit IgG conjugate horseradish peroxidase (HRP) (Abcam; ab97051), developed with Western Lightning Plus enhanced chemiluminescence reagent (PerkinElmer), and visualized using a BioSpectrum AC imaging system (UVP) and Labworks software (UVP; v4.6.0). Densitometric analysis was performed for each protein using Image J and is expressed as a ratio of protein to GAPDH (protein/GAPDH) (37).
Microarray data accession number.
The microarray data set has been deposited in the Gene Expression Omnibus (GEO) under accession no. GSE55359.
RESULTS
Decrease in miRNA expression and repertoire diversity in the gut mucosa during SIV infection.
To determine the impact of SIV infection on the expression of intestinal miRNA, we sequenced small RNA libraries from jejunum tissues of rhesus macaques in the chronic stages of SIV infection. The miRNA reads were filtered for quality and aligned against known macaque miRNA sequences present in miRBase using BLAST (24). An average of 9.7 million reads per library mapped to the miRNA signatures present in miRBase (range, 7.6 to 12.0 million reads). We found a total of 523 miRNA sequences represented by one or more reads in at least one library. Consistent with previous studies, several miRNA and miRNA families such as the miRNA 143, 200, and let-7 families were highly expressed in the small intestine (15, 38). Despite the large number of miRNA expressed in the jejunum tissue of rhesus macaques, five miRNA, miR-143, -194, -21, -145, and let-7f, accounted for over 60% of the reads that aligned to the reference database in the negative-control animal. In contrast, the miRNA composition in the gut mucosa of SIV-infected animals was less diverse, with only one miRNA, miR-143, comprising >75% of aligned reads (Fig. 1B).
FIG 1.

Decline in microRNA expression and diversity in the gut mucosa during chronic SIV infection. (A) MicroRNAs were isolated from intestinal tissue of chronically SIV-infected rhesus macaques (n = 3; red bars) and a SIV-negative healthy control (n = 1; green bars), sequenced, quantitated, and aligned to macaque miRNA records in miRBase using BLAST. (B) Bar graphs depict the number of miRNA sequences mapping to the macaque genome in each sample. (C) The total number of successfully mapped miRNA that were altered by at least 1.5-fold during chronic SIV infection is shown.
To determine how SIV influenced miRNA expression in the GI tract during infection, we identified all miRNA expressed above a cutoff of 100 reads per million reads aligned to the reference (RPM). The cutoff of 100 RPM was used, as a recent study reported that miRNA expressed below this threshold are unlikely to be functionally relevant (39). In total, 131 miRNA were expressed above the selected cutoff in the SIV-negative control, while only an average of 88 (range, 79 to 97) miRNA passed the criteria in samples from animals with chronic SIV infection. The decrease in the number of miRNA meeting the expression cutoff provides further evidence that SIV infection results in a decrease in the miRNA repertoire in the gut. Of the 20 most highly expressed miRNA, miRNA expression was decreased for all but two during chronic infection. This trend of decreased expression was mirrored for nearly all of the miRNA expressed above cutoffs during the chronic stages of SIV infection (Fig. 1A and C). Similar trends were observed in the primary stage of infection, but miRNA decreases at this time point were more variable (see Fig. S1 in the supplemental material).
To validate the sequencing findings and further investigate SIV-induced miRNA depletion during infection, we measured the levels of several miRNA using real-time PCR (RT-PCR). We selected miRNA for validation based on their medium to high baseline expression and potential role in maintenance of epithelial homeostasis. Real-time PCR demonstrated reduced expression of miRNA 26a, 29a, 199a, 429, 16, 194, and 200c during SIV infection, which was consistent with the miRNA sequencing data (Fig. 2A to G).
FIG 2.

Validation of decreased expression for selected miRNA during chronic SIV infection by quantitative PCR. Reductions in the levels of seven miRNA that showed high to medium expression by sequencing were analyzed and validated in a larger group of chronically SIV-infected macaques (n = 5) and healthy uninfected controls (n = 5) using quantitative real-time PCR. P values of ≤0.05 are denoted by * and ≤0.01 by **. Error bars indicate the standard errors of the means.
To determine if miRNA depletion was a feature shared between SIV and HIV infection in the GI tract, we examined miRNA expression in the jejunal biopsy specimens from HIV-infected patients and HIV-negative controls. Gut biopsy specimens were collected by upper endoscopy. Total RNA was extracted from jejunal biopsy specimens from HIV-infected (n = 2) and HIV-negative (n = 2) individuals, and miRNA profiling was performed using TaqMan low-density array (TLDA) cards (Table 2). TaqMan low-density arrays multiplex hundreds of TaqMan assays on a single plate, allowing the user to interrogate the expression of a large number of miRNA simultaneously. The data generated from this assay were analyzed using the SDS suite and R. After the removal of low-expressing miRNA, the data were clustered using R. Although there was increased variability in the HIV-infected human patients compared with that of SIV-infected macaques, there was still a clear trend of decreased mature miRNA expression in the jejunum during HIV infection (Fig. 3A). As in macaques, the TLDA cards showed a clear decrease in miR-16, -194, and -200c during infection. The analysis was extended to an expanded patient cohort, including the original four samples, to validate the decrease in miRNA expression in the HIV-positive patients (Table 2). Using real-time PCR, we confirmed decreased expression of miRNA 16, 194, and 200c in jejunal biopsy specimens from HIV-infected patients, although only miRNA 194 and 200c reached statistical significance (Fig. 3B to D). Collectively, our findings show SIV/HIV infection results in widespread decreases in miRNA expression and repertoire diversity in gut mucosa, and these changes might begin within the first several weeks of infection.
TABLE 2.
Patient data and clinical parametersa
| ID | HIV status | Blood CD4+ T cell count (cells/μl) | Viral load (copies/ml plasma) | % of CD4 T cells (gut) | Gender | Age (yrs) | Ethnicity | Length of infection (yrs postdiagnosis) |
|---|---|---|---|---|---|---|---|---|
| 1b | HIV− | ND | NA | ND | M | 39 | White | NA |
| 65b | HIV− | 634 | NA | 58.0 | M | 38 | White | NA |
| 177 | HIV− | 789 | NA | 39.9 | M | 39 | White | NA |
| 215 | HIV− | 380 | NA | 39.4 | M | 57 | White | NA |
| 20b | HIV+ | 294 | 246,000 | 5.0 | M | 45 | White | 1 |
| 29b | HIV+ | 34 | 5,000 | 1.0 | M | 33 | White | 3 |
| 154 | HIV+ | 581 | 187,000 | 6.9 | M | 33 | White | 1 |
| 173 | HIV+ | 57 | >750,000 | 2.1 | M | 29 | White | 4 |
| 193 | HIV+ | 274 | 370,453 | 1.6 | M | 28 | White | 3 |
ND, no data; NA, not applicable; M, male.
Used for both TLDA cards and RT-PCR.
FIG 3.

Intestinal miRNA expression is reduced in chronically HIV-infected patients. (A) Hierarchical clustering of miRNA expression as detected by quantitative PCR in HIV-infected (n = 2) and HIV-negative (n = 2) patients. (B to D) As observed in SIV infection, the expression of miR-16, -194, and -200c is significantly reduced in the gut mucosa of HIV-infected patients (n = 5) compared to that of HIV-negative controls (n = 4). Statistical significance was determined using Student's t test. P values of ≤0.05 are denoted by *, and error bars indicate standard errors of the means.
SIV infection disrupts the expression of miRNA biogenesis and degradation machinery.
Consistent with our observations, previous studies have shown that depletion of miRNA processing enzymes or increased expression of miRNA exonucleases results in widespread decreases in miRNA expression (40–43). To determine whether SIV infection altered expression of miRNA processing or degrading enzymes, we investigated the expression of three key proteins, AGO2, DICER1, and XRN2, using Western blot analysis. DICER1 is an essential miRNA processing enzyme which cleaves pre-miRNA structures into mature miRNA and helps load them into the RNA-induced silencing complex; hence, DICER1 depletion results in decreased mature miRNA expression (15). Surprisingly, the expression of full-length Dicer protein (flDicer) increased during chronic infection (Fig. 4A). However, in addition to the ∼250-kDa DICER1 band, we also observed a smaller ∼95-kDa immunoreactive band (sDicer) which was significantly increased during SIV infection. Previous studies have linked a band of this size to a truncated form of DICER1 which inhibits normal processing of miRNA (44). Although the exact identity of this band is unknown, it is tempting to speculate that, as in previous studies, this band represents a truncated form of DICER1 that inhibits miRNA processing, leading to decreased accumulation of mature miRNA.
FIG 4.

Disruption of miRNA biogenesis during chronic SIV infection. Western blot analysis of DICER1 (A; left), AGO2 (B; left), and XRN2 (C; left) expression in the intestinal mucosa of SIV-infected macaques (n = 4) and SIV-negative controls (n = 4). Each lane on the blot represents a single animal, and the animal numbers are indicated above each lane of the blot. GAPDH was used as a loading control, and densitometry measurements for each protein are given as a ratio of the protein density to that of GAPDH (A to C; right). Error bars indicate the standard errors of the means.
We investigated the expression of AGO2, which binds mature miRNA and facilitates silencing of gene expression. Depletion of Argonaute proteins results in decreased accumulation of mature miRNA and disruption of RNA silencing (40). We observed a slight decrease in AGO2 protein expression, in the jejunum during chronic infection (Fig. 4B). However, it is unclear what effect a slight decrease in AGO2 would have on miRNA expression.
In addition to alterations in miRNA biogenesis machinery, the observed decreases in miRNA expression could be due to increased mature miRNA turnover. MicroRNA turnover is facilitated by a class of exoribonucleases, one of which, XRN2, is associated with the dislodging of miRNA from AGO2 and degradation of mature miRNA (41). The expression of XRN2 was strongly increased in the jejunum during chronic SIV infection (Fig. 4C). An increase in XRN2 would be predicted to increase miRNA turnover and decrease mature miRNA expression. Taken together, these data suggest that SIV infection results in disruption of miRNA expression machinery and that the widespread miRNA depletion during infection is likely to be multifactorial.
SIV infection causes changes in gut mucosal gene expression.
To characterize the impact of SIV on the regulatory gene networks responsible for the intestinal mucosal epithelium integrity and immune response, DNA microarray analysis was performed on gut tissue samples from SIV-infected rhesus macaques and SIV-negative healthy controls. Pathway analysis of the data set identified several molecular pathways that were enriched for genes altered during viral infection, many of which were associated with mucosal immune response and inflammation (Fig. 5A and B). In addition, several pathways associated with epithelial cell homeostasis, differentiation, and innate immune response were also enriched for differentially regulated genes in SIV-infected animals (Fig. 5B). These data demonstrate that SIV infection alters the expression of genes that are critical to the maintenance of the gut epithelial compartment as well as for generating inflammatory immune responses.
FIG 5.

Chronic SIV infection alters the expression of genes regulating gut epithelial barrier integrity and function. (A) Changes in gut mucosal gene transcription of ≥1.5-fold compared to uninfected controls were determined by microarray in SIV-infected macaques and subjected to hierarchical clustering to identify similar patterns of up- and downregulation. Relative transcription levels are displayed from highest (red color) to lowest (green color). Broad relationships between groups of genes are further indicated by the dendrogram on the left of the heatmap. (B) Pathway analysis of the clustered genes showing that SIV infection impacts molecular pathways that regulate epithelial maintenance, differentiation, and defense. Horizontal bars reflect the number of genes upregulated (red color) or downregulated (green color) per each functional category/molecular network listed, and the P value is indicated for each bar by a gray circle on the line graph.
Loss of miRNA expression in SIV infection is localized to the proliferative crypts of the intestinal epithelium.
Previous reports have uncovered an essential role for miRNA in the regulation of epithelial cell function, proliferation, and differentiation in the gut (15, 45). Thus, we reasoned that decreased expression of miRNA might play a role in the impaired gut epithelial cell growth and development during SIV infection. To identify the epithelial compartment most affected by the miRNA suppression during SIV infection, we utilized laser capture microdissection to capture intestinal epithelial cells from the differentiated epithelium in the ascending villus region (Fig. 6A) and the proliferative epithelium in the crypt region (Fig. 6C). We selected three miRNA, miR-16, -200c, and -194, for miRNA expression analysis. These three miRNA were selected because they were all highly expressed in the miRNA libraries and all had previously been associated with regulation of epithelial cell processes (46–48). Expression of miRNA 16, 194, and 200c was measured in isolated epithelial cells from the villus and crypt regions using real-time PCR. Interestingly, expression of all three miRNA was significantly decreased in the crypt region, while the expression level was highly variable in the villus epithelial cells during SIV infection (Fig. 6B and D). Therefore, our data showed that SIV infection caused decreased miRNA expression in the crypt epithelium, which might contribute to the dysfunction in the epithelial barrier integrity and function. Our findings highlight potentially an important role of the crypt epithelium in the gut mucosal response to the viral infections.
FIG 6.

Decrease in miRNA expression during chronic SIV infection is localized to the proliferative crypt epithelial region. Before and after images of villus (A) and crypt (C) epithelial cells isolated from the surrounding tissue by laser capture microdissection. (B, D) Fold changes in the expression of miR-16, -194, and -200c in the villus and crypt regions during SIV infection were determined by RT-PCR. SIV infected, n = 4; SIV negative, n = 4. Dotted lines indicate a 1.5-fold change. Statistical significance determined using Student's t test. P values of ≤0.05 are denoted by *, and error bars indicate the standard errors of the means.
Targets of gut mucosal miRNA regulate intestinal homeostasis, proliferation, and development.
To investigate the potential effects of depletion of miRNA in crypt epithelial cells, we determined potential targets of highly expressed intestinal miRNA. As we observed the decrease in miRNA 16, 194, and 200c in crypt epithelial cells, and many miRNA have thousands of potential predicted targets, we focused our search to only these three miRNA. Selected miRNA and validated targets of these miRNA were imported into Cytoscape using the CyTargetLinker plugin (30). The CyTargetLinker plugin allows for the import of several miRNA targets and generates interaction networks based on these predicted and validated miRNA targets. The targets of these miRNA were then exported to DAVID for pathway analysis. Pathway analysis revealed that the validated targets of these miRNA belonged to pathways involved in cell cycle control and cancer (Fig. 7B). Several validated targets were also found in important innate defense pathways, such as epithelial cell signaling in Helicobacter pylori infection, NOD-like receptor signaling pathway, and mitogen-activated protein kinase (MAPK) signaling pathway (Fig. 7A and B and Table 3). Moreover, many of the mRNA targets of these miRNA, such as JUN, WNT3A, and NFKB1, are known to be critically important in these pathways, and disruption of the expression of these genes would have far-reaching impacts in the gut mucosa.
FIG 7.

Molecular targets of downregulated intestinal miRNA are involved in cell cycle regulation, epithelial differentiation, and cell death. (A) The Cytoscape analytical program was used to identify a network of validated gene targets for the epithelium-associated miRNA 16, 194, and 200c downregulated during chronic SIV infection. Pathways enriched in validated (B) and predicted (C) targets were subsequently analyzed by DAVID pathway analysis software (http://david.abcc.ncifcrf.gov).
TABLE 3.
Functional categories of genes containing validated targets of miRNA 16, 194, and 200c are altered in the gut mucosa during SIV infection
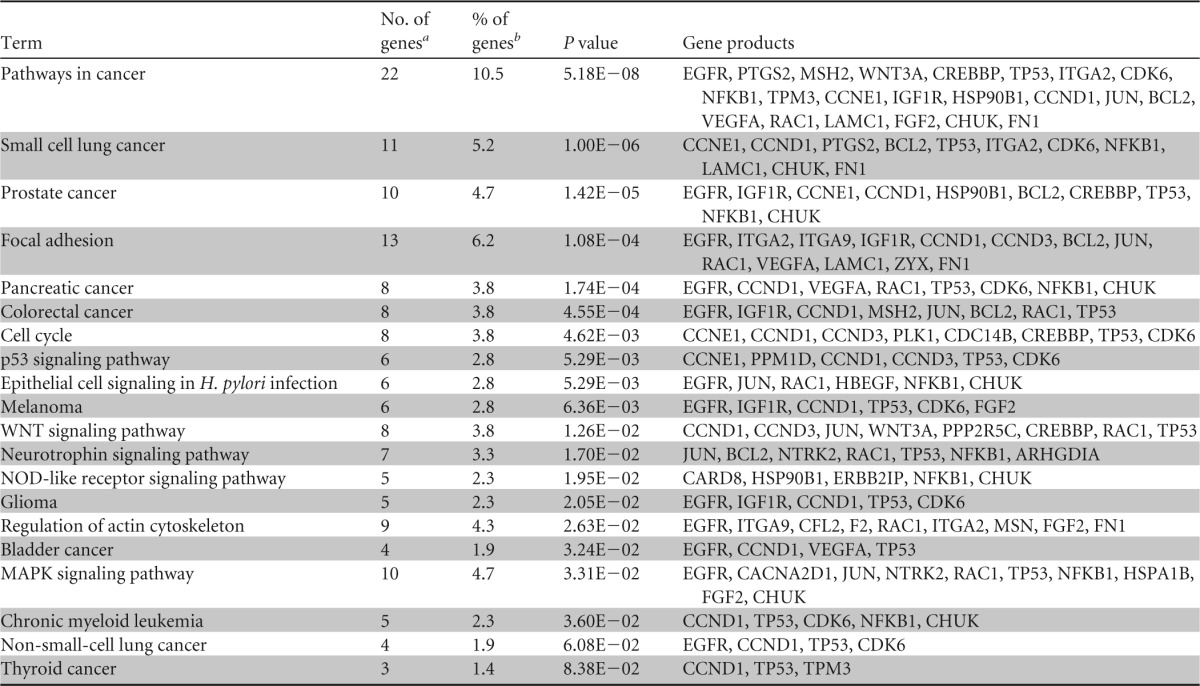
The total number of genes targeted by the selected miRNA.
The percentage of genes from a term that are validated targets.
Next, the predicted targets were exported and analyzed as described above. Since most miRNA target programs predict hundreds or thousands of individual targets for each miRNA, we considered only miRNA targets that were present in the RNA interaction databases of both the TargetScan and microCosm algorithms. This analysis yielded results similar to the pathway analysis for validated targets identifying enrichment of predicted miRNA targets in cell cycle, immune response, epithelial development, and differentiation pathways (Fig. 7C and Table 4). Three pathways, enriched in predicted miRNA targets, transforming growth factor beta (TGF-β), WNT, and NOTCH signaling, are essential for normal epithelial growth and development in the gut (49–51). Interestingly, the TGF-β and WNT signaling pathways were also modulated during chronic SIV infection (Fig. 6B and C). Collectively, our data demonstrate that both predicted and validated targets of miRNA, such as miR-16, -194, and -200c, belong to pathways involved in epithelial growth and development. Thus, SIV infection may alter epithelial programming and growth through the modulation of miRNA expression.
TABLE 4.
Functional categories of genes containing predicted targets of miRNA 16, 194, and 200c are altered in the gut mucosa during SIV infection
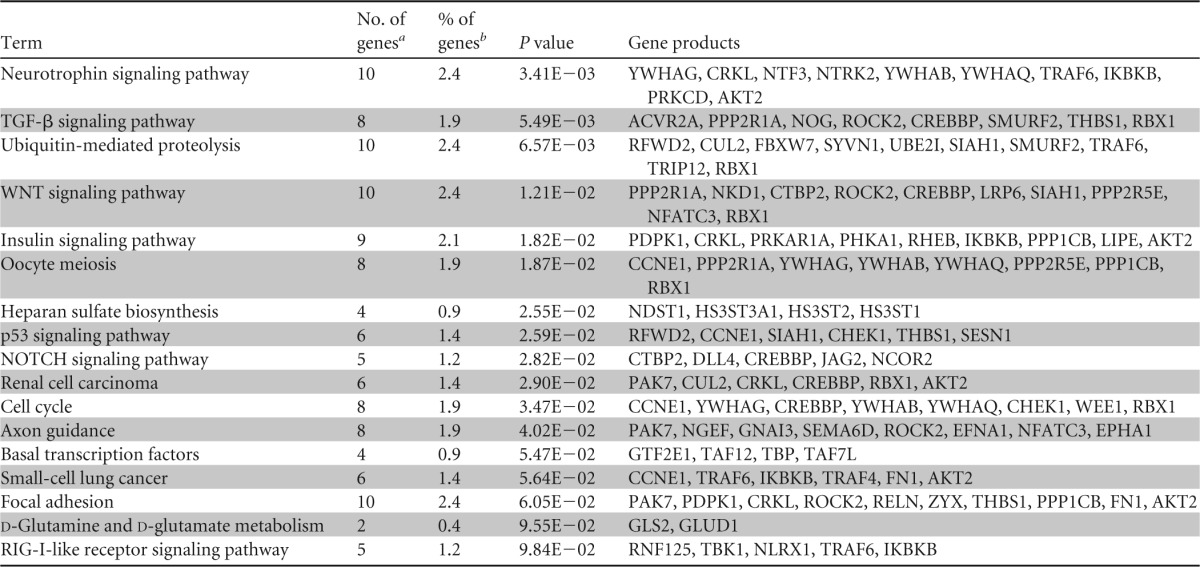
The total number of genes targeted by the selected miRNA.
The percentage of genes from a term that are validated targets.
DISCUSSION
Previous studies have shown that HIV infection leads to distinct changes in miRNA expression profiles in cell lines and PBMCs from HIV-infected patients (14, 52–55). MicroRNA have also been reported to disrupt viral replication and are thought to be involved in establishing viral latency (11, 14, 56). Others have found that miRNA are associated with HIV-induced central nervous system disease (54, 57). In this study, we investigated the impact of SIV and HIV infection on expression of miRNA in the small intestine. We found that SIV infection results in the depletion of most mucosal miRNA through dysregulation of miRNA biogenesis machinery and that this depletion starts within the first 2 weeks of infection. In addition, this decrease in miRNA expression was not restricted to SIV-infected rhesus macaques but was also observed in HIV-infected jejunum tissue.
Widespread depletion of miRNA has been reported in PBMCs of HIV-infected patients and infected cell lines (53, 55). These studies found that miRNA depletion was likely due to the inflammatory environment and not direct infection of T cells (55). Chronic inflammation and increased immune activation in the GI tract during HIV/SIV infection has previously been reported, and it is possible that this is a contributing factor in decreased miRNA expression (18, 58). In the present study, we sought to correlate viral loads, CD4+ T cell depletion, and immune activation with loss of specific miRNA expression. Although our sample size was not optimal for detecting these relationships, we found that miR-429 expression was negatively correlated with gut viral loads, while miR-26a expression was negatively correlated with peripheral blood CD4+ T cell numbers (data not shown). Further investigations are needed to determine relationships that exist between CD4+ T cell numbers, viral loads, immune activation, and miRNA expression.
Global miRNA depletion has been previously reported in the context of tissue injury, tissue regeneration, and disease (42, 43, 59, 60). The global decrease in miRNA expression has been linked to a decrease in miRNA processing enzymes, such as DICER1, DROSHA, or AGO2. Our data demonstrated that chronic viral infections cause similar changes in the expression of miRNA processing enzymes. We observed a slight decrease in the expression of full-length AGO2, possibly due to increased ubiquitination during SIV infection. Argonaute-2 depletion by proteasomal degradation has been implicated as the proximal cause of miRNA depletion that occurs during T cell activation (40). It is unlikely that T cell activation or T cell depletion alone could explain the global decline in miRNA expression in the gut mucosa. We found that decreased miRNA expression was localized to crypt epithelial cells. Moreover, many highly expressed miRNA found in our survey are present nearly exclusively in intestinal epithelium and not in the cells of the underlying tissue (61).
Interestingly, we found that the expression of exoribonuclease 2 was also increased during chronic SIV infection. Exoribonuclease 2 is known to interact with AGO2, dislodging and degrading miRNA (41). An increase in XRN2 would potentially result in increased miRNA turnover and decreased accumulation of mature miRNA, similar to what we have observed in this study. XRN2 is also involved in premature termination of HIV-1 transcripts (62). The involvement of XRN2 in termination of SIV replication and depletion of miRNA during SIV and HIV infections is unclear, but it is tempting to speculate that the increased expression of XRN2 might be playing an important role in miRNA depletion during the viral infection.
Unexpectedly, we found an increased expression of DICER1 in the gut mucosa during SIV infection. However, the increase in full-length DICER1 was accompanied by an increase in a truncated form of DICER1 that migrates at ∼95 kDa. This truncated form of DICER1 has previously been reported in Caenorhabditis elegans to be inhibitory in the miRNA biogenesis pathway (44). However, in this context, the identity and function of this protein are unclear. Collectively, reduced levels of AGO2, increased levels of XRN2, and an increase in a potentially inhibitory form of DICER1 likely play an important role in the observed global decreases in miRNA expression.
The global decrease in miRNA expression in the intestine during HIV and SIV infections likely affects the expression of many mucosal genes. MicroRNAs are known to regulate genes associated with intestinal epithelial membrane permeability, proliferation, and response to pathogens (15, 16, 43, 63). Pathway analysis of three highly expressed miRNA, miR-16, -194, and -200c, in the gut mucosa revealed that many of the predicted and validated targets of these miRNA are involved in cell proliferation, differentiation, and defense. Notably, the WNT signaling pathway was enriched for both predicted and validated targets of miR-16, -194, and -200c. WNT signaling is crucial for epithelial cell development in the intestinal tract, and alterations in this pathway could impact epithelial cell fate and proliferation during infection (50). The NOTCH signaling pathway was also enriched in predicted miRNA targets. Notch signaling also plays an important role in the differentiation and proliferation of epithelial stem cells, and disruption of this pathway can lead to cell death and alterations in cell proliferation (49). Indeed, global miRNA knockdown using a conditional DICER1 knockout in mouse intestinal epithelial cells results in alterations in epithelial cell populations and epithelial cell dysfunction (15). MicroRNA targets were also enriched in several cell cycle and immune response pathways. Others have also reported that global downregulation of miRNA is linked to regenerative proliferation in the liver (43) and innate immune responses to pathogens (63). Although the precise effect of miRNA depletion in the GI tract during infection is unclear, these data suggest it might influence the derepression of the innate immune response during infection and cellular regeneration during viral insult.
The global decrease in miRNA expression during HIV and SIV infections raises several important questions about the role of miRNA in viral pathogenesis. Although the cause and consequences of this downregulation remain unclear, our data suggest that this effect might impact epithelial differentiation, development, and immune responses. We also provide evidence for a potential mechanism for miRNA downregulation during SIV and HIV infections. Importantly, our findings reflect the changes in vivo during SIV as well as HIV infections. Several studies using epithelial tumor cell lines in vitro have highlighted disruption of normal miRNA expression or expression of miRNA machinery in cancer cells (59, 64, 65). Indeed, we have observed high expression of XRN2 in Caco-2 cells (data not shown). One limitation of this study is that the majority of analysis was performed on gut tissue samples and isolated epithelial cells. Future investigations of miRNA expression in other cell populations in the gut will help interrogate the causes, consequences, and kinetics of the loss of miRNA expression. These studies will provide better insights into pathways that are modulated in gut immune and epithelial cells during SIV and HIV infections that might be under the control of miRNA.
Supplementary Material
ACKNOWLEDGMENTS
This work was supported by grants from the NIAID (AI43274) and NIDDK (DK43183).
We thank members of the California National Primate Research Center for their assistance with animal infections. We acknowledge Jay Li, Anne Fenton, and William Hu for their technical assistance and three anonymous reviewers for their helpful critiques.
We declare no conflicts of interests.
Footnotes
Published ahead of print 26 March 2014
Supplemental material for this article may be found at http://dx.doi.org/10.1128/JVI.00097-14.
REFERENCES
- 1.Heise C, Miller CJ, Lackner A, Dandekar S. 1994. Primary acute simian immunodeficiency virus infection of intestinal lymphoid tissue is associated with gastrointestinal dysfunction. J. Infect. Dis. 169:1116–1120. 10.1093/infdis/169.5.1116 [DOI] [PubMed] [Google Scholar]
- 2.Heise C, Vogel P, Miller CJ, Lackner A, Dandekar S. 1993. Distribution of SIV infection in the gastrointestinal tract of rhesus macaques at early and terminal stages of AIDS. J. Med. Primatol. 22:187–193 [PubMed] [Google Scholar]
- 3.Brenchley JM, Schacker TW, Ruff LE, Price DA, Taylor JH, Beilman GJ, Nguyen PL, Khoruts A, Larson M, Haase AT, Douek DC. 2004. CD4+ T cell depletion during all stages of HIV disease occurs predominantly in the gastrointestinal tract. J. Exp. Med. 200:749–759. 10.1084/jem.20040874 [DOI] [PMC free article] [PubMed] [Google Scholar]
- 4.George MD, Sankaran S, Reay E, Gelli AC, Dandekar S. 2003. High-throughput gene expression profiling indicates dysregulation of intestinal cell cycle mediators and growth factors during primary simian immunodeficiency virus infection. Virology 312:84–94. 10.1016/S0042-6822(03)00207-1 [DOI] [PubMed] [Google Scholar]
- 5.Sankaran S, Guadalupe M, Reay E, George MD, Flamm J, Prindiville T, Dandekar S. 2005. Gut mucosal T cell responses and gene expression correlate with protection against disease in long-term HIV-1-infected nonprogressors. Proc. Natl. Acad. Sci. U. S. A. 102:9860–9865. 10.1073/pnas.0503463102 [DOI] [PMC free article] [PubMed] [Google Scholar]
- 6.Heise C, Vogel P, Miller CJ, Halsted CH, Dandekar S. 1993. Simian immunodeficiency virus infection of the gastrointestinal tract of rhesus macaques. Functional, pathological, and morphological changes. Am. J. Pathol. 142:1759–1771 [PMC free article] [PubMed] [Google Scholar]
- 7.Kotler DP, Reka S, Clayton F. 1993. Intestinal mucosal inflammation associated with human immunodeficiency virus infection. Dig. Dis. Sci. 38:1119–1127. 10.1007/BF01295730 [DOI] [PubMed] [Google Scholar]
- 8.Li Q, Estes JD, Duan L, Jessurun J, Pambuccian S, Forster C, Wietgrefe S, Zupancic M, Schacker T, Reilly C, Carlis JV, Haase AT. 2008. Simian immunodeficiency virus-induced intestinal cell apoptosis is the underlying mechanism of the regenerative enteropathy of early infection. J. Infect. Dis. 197:420–429. 10.1086/525046 [DOI] [PubMed] [Google Scholar]
- 9.Bartel DP. 2004. MicroRNAs: genomics, biogenesis, mechanism, and function. Cell 116:281–297. 10.1016/S0092-8674(04)00045-5 [DOI] [PubMed] [Google Scholar]
- 10.Bonci D, Coppola V, Musumeci M, Addario A, Giuffrida R, Memeo L, D'Urso L, Pagliuca A, Biffoni M, Labbaye C, Bartucci M, Muto G, Peschle C, De Maria R. 2008. The miR-15a-miR-16-1 cluster controls prostate cancer by targeting multiple oncogenic activities. Nat. Med. 14:1271–1277. 10.1038/nm.1880 [DOI] [PubMed] [Google Scholar]
- 11.Wang X, Ye L, Hou W, Zhou Y, Wang YJ, Metzger DS, Ho WZ. 2009. Cellular microRNA expression correlates with susceptibility of monocytes/macrophages to HIV-1 infection. Blood 113:671–674. 10.1182/blood-2008-09-175000 [DOI] [PMC free article] [PubMed] [Google Scholar]
- 12.O'Connell RM, Taganov KD, Boldin MP, Cheng G, Baltimore D. 2007. MicroRNA-155 is induced during the macrophage inflammatory response. Proc. Natl. Acad. Sci. U. S. A. 104:1604–1609. 10.1073/pnas.0610731104 [DOI] [PMC free article] [PubMed] [Google Scholar]
- 13.Schulte LN, Eulalio A, Mollenkopf HJ, Reinhardt R, Vogel J. 2011. Analysis of the host microRNA response to Salmonella uncovers the control of major cytokines by the let-7 family. EMBO J. 30:1977–1989. 10.1038/emboj.2011.94 [DOI] [PMC free article] [PubMed] [Google Scholar]
- 14.Nathans R, Chu CY, Serquina AK, Lu CC, Cao H, Rana TM. 2009. Cellular microRNA and P bodies modulate host-HIV-1 interactions. Mol. Cell 34:696–709. 10.1016/j.molcel.2009.06.003 [DOI] [PMC free article] [PubMed] [Google Scholar]
- 15.McKenna LB, Schug J, Vourekas A, McKenna JB, Bramswig NC, Friedman JR, Kaestner KH. 2010. MicroRNAs control intestinal epithelial differentiation, architecture, and barrier function. Gastroenterology 139:1654–1664. 10.1053/j.gastro.2010.07.040 [DOI] [PMC free article] [PubMed] [Google Scholar]
- 16.Zhou Q, Souba WW, Croce CM, Verne GN. 2010. MicroRNA-29a regulates intestinal membrane permeability in patients with irritable bowel syndrome. Gut 59:775–784. 10.1136/gut.2009.181834 [DOI] [PMC free article] [PubMed] [Google Scholar]
- 17.Raffatellu M, Santos RL, Verhoeven DE, George MD, Wilson RP, Winter SE, Godinez I, Sankaran S, Paixao TA, Gordon MA, Kolls JK, Dandekar S, Baumler AJ. 2008. Simian immunodeficiency virus-induced mucosal interleukin-17 deficiency promotes Salmonella dissemination from the gut. Nat. Med. 14:421–428. 10.1038/nm1743 [DOI] [PMC free article] [PubMed] [Google Scholar]
- 18.Macal M, Sankaran S, Chun TW, Reay E, Flamm J, Prindiville TJ, Dandekar S. 2008. Effective CD4+ T-cell restoration in gut-associated lymphoid tissue of HIV-infected patients is associated with enhanced Th17 cells and polyfunctional HIV-specific T-cell responses. Mucosal Immunol. 1:475–488. 10.1038/mi.2008.35 [DOI] [PubMed] [Google Scholar]
- 19.Verhoeven D, Sankaran S, Silvey M, Dandekar S. 2008. Antiviral therapy during primary simian immunodeficiency virus infection fails to prevent acute loss of CD4+ T cells in gut mucosa but enhances their rapid restoration through central memory T cells. J. Virol. 82:4016–4027. 10.1128/JVI.02164-07 [DOI] [PMC free article] [PubMed] [Google Scholar]
- 20.George MD, Reay E, Sankaran S, Dandekar S. 2005. Early antiretroviral therapy for simian immunodeficiency virus infection leads to mucosal CD4+ T-cell restoration and enhanced gene expression regulating mucosal repair and regeneration. J. Virol. 79:2709–2719. 10.1128/JVI.79.5.2709-2719.2005 [DOI] [PMC free article] [PubMed] [Google Scholar]
- 21.Peart MJ, Smyth GK, van Laar RK, Bowtell DD, Richon VM, Marks PA, Holloway AJ, Johnstone RW. 2005. Identification and functional significance of genes regulated by structurally different histone deacetylase inhibitors. Proc. Natl. Acad. Sci. U. S. A. 102:3697–3702. 10.1073/pnas.0500369102 [DOI] [PMC free article] [PubMed] [Google Scholar]
- 22.Hughes TR, Marton MJ, Jones AR, Roberts CJ, Stoughton R, Armour CD, Bennett HA, Coffey E, Dai H, He YD, Kidd MJ, King AM, Meyer MR, Slade D, Lum PY, Stepaniants SB, Shoemaker DD, Gachotte D, Chakraburtty K, Simon J, Bard M, Friend SH. 2000. Functional discovery via a compendium of expression profiles. Cell 102:109–126. 10.1016/S0092-8674(00)00015-5 [DOI] [PubMed] [Google Scholar]
- 23.Aronesty E. 2011. ea-utils: command-line tools for processing biological sequencing data. Expression Analysis, Durham, NC [Google Scholar]
- 24.Griffiths-Jones S. 2004. The microRNA registry. Nucleic Acids Res. 32:D109–D111. 10.1093/nar/gkh023 [DOI] [PMC free article] [PubMed] [Google Scholar]
- 25.Kozomara A, Griffiths-Jones S. 2011. miRBase: integrating microRNA annotation and deep-sequencing data. Nucleic Acids Res. 39:D152–D157. 10.1093/nar/gkq1027 [DOI] [PMC free article] [PubMed] [Google Scholar]
- 26.Griffiths-Jones S, Grocock RJ, Dongen Sv Enright AJ. 2006. miRBase: microRNA sequences, targets and gene nomenclature. Nucleic Acid Res. 34:D140–D144. 10.1093/nar/gkj112 [DOI] [PMC free article] [PubMed] [Google Scholar]
- 27.Griffiths-Jones S, Saini HK, von Dongen S, Enright AJ. 2008. miRBase: tools for microRNA genomics. Nucleic Acid Res. 36:D154–D158. 10.1093/nar/gkm952 [DOI] [PMC free article] [PubMed] [Google Scholar]
- 28.Altschul SF, Gish W, Miller W, Myers EW, Lipman DJ. 1990. Basic local alignment search tool. J. Mol. Biol. 215:403–410. 10.1016/S0022-2836(05)80360-2 [DOI] [PubMed] [Google Scholar]
- 29.R Development Core Team. 2012. A language and environment for statistical computing, 2.15.2 ed. R Foundation for Statistical Computing, Vienna, Austria [Google Scholar]
- 30.Smoot ME, Ono K, Ruscheinski J, Wang PL, Ideker T. 2011. Cytoscape 2.8: new features for data integration and network visualization. Bioinformatics 27:431–432. 10.1093/bioinformatics/btq675 [DOI] [PMC free article] [PubMed] [Google Scholar]
- 31.Garcia DM, Baek D, Shin C, Bell GW, Grimson A, Bartel DP. 2011. Weak seed-pairing stability and high target-site abundance decrease the proficiency of lsy-6 and other microRNAs. Nat. Struct. Mol. Biol. 18:1139–1146. 10.1038/nsmb.2115 [DOI] [PMC free article] [PubMed] [Google Scholar]
- 32.Huang DW, Sherman BT, Lempicki RA. 2009. Bioinformatics enrichment tools: paths toward the comprehensive functional analysis of large gene lists. Nucleic Acids Res. 37:1–13. 10.1093/nar/gkn923 [DOI] [PMC free article] [PubMed] [Google Scholar]
- 33.Huang DW, Sherman BT, Lempicki RA. 2009. Systematic and integrative analysis of large gene lists using DAVID bioinformatics resources. Nat. Protoc. 4:44–57. 10.1038/nprot.2008.211 [DOI] [PubMed] [Google Scholar]
- 34.Vergoulis T, Vlachos IS, Alexiou P, Georgakilas G, Maragkakis M, Reczko M, Gerangelos S, Koziris N, Dalamagas T, Hatzigeorgiou AG. 2012. TarBase 6.0: capturing the exponential growth of miRNA targets with experimental support. Nucleic Acids Res. 40:D222–D229. 10.1093/nar/gkr1161 [DOI] [PMC free article] [PubMed] [Google Scholar]
- 35.Xiao F, Zuo Z, Cai G, Kang S, Gao X, Li T. 2009. miRecords: an integrated resource for microRNA-target interactions. Nucleic Acids Res. 37:D105–D110. 10.1093/nar/gkn851 [DOI] [PMC free article] [PubMed] [Google Scholar]
- 36.Espina V, Wulfkuhle JD, Calvert VS, VanMeter A, Zhou W, Coukos G, Geho DH, Petricoin EF, III, Liotta LA. 2006. Laser-capture microdissection. Nat. Protoc. 1:586–603. 10.1038/nprot.2006.85 [DOI] [PubMed] [Google Scholar]
- 37.Schneider CA, Rasband WS, Eliceiri KW. 2012. NIH Image to ImageJ: 25 years of image analysis. Nat. Methods 9:671–675. 10.1038/nmeth.2089 [DOI] [PMC free article] [PubMed] [Google Scholar]
- 38.Sharbati S, Friedlander MR, Sharbati J, Hoeke L, Chen W, Keller A, Stahler PF, Rajewsky N, Einspanier R. 2010. Deciphering the porcine intestinal microRNA transcriptome. BMC Genomics 11:275. 10.1186/1471-2164-11-275 [DOI] [PMC free article] [PubMed] [Google Scholar]
- 39.Mullokandov G, Baccarini A, Ruzo A, Jayaprakash AD, Tung N, Israelow B, Evans MJ, Sachidanandam R, Brown BD. 2012. High-throughput assessment of microRNA activity and function using microRNA sensor and decoy libraries. Nat. Methods 9:840–846. 10.1038/nmeth.2078 [DOI] [PMC free article] [PubMed] [Google Scholar]
- 40.Bronevetsky Y, Villarino AV, Eisley CJ, Barbeau R, Barczak AJ, Heinz GA, Kremmer E, Heissmeyer V, McManus MT, Erle DJ, Rao A, Ansel KM. 2013. T cell activation induces proteasomal degradation of Argonaute and rapid remodeling of the microRNA repertoire. J. Exp. Med. 210:417–432. 10.1084/jem.20111717 [DOI] [PMC free article] [PubMed] [Google Scholar]
- 41.Chatterjee S, Grosshans H. 2009. Active turnover modulates mature microRNA activity in Caenorhabditis elegans. Nature 461:546–549. 10.1038/nature08349 [DOI] [PubMed] [Google Scholar]
- 42.Izzotti A, Calin GA, Arrigo P, Steele VE, Croce CM, De Flora S. 2009. Downregulation of microRNA expression in the lungs of rats exposed to cigarette smoke. FASEB J. 23:806–812. 10.1096/fj.08-121384 [DOI] [PMC free article] [PubMed] [Google Scholar]
- 43.Shu J, Kren BT, Xia Z, Wong PY, Li L, Hanse EA, Min MX, Li B, Albrecht JH, Zeng Y, Subramanian S, Steer CJ. 2011. Genomewide microRNA down-regulation as a negative feedback mechanism in the early phases of liver regeneration. Hepatology 54:609–619. 10.1002/hep.24421 [DOI] [PMC free article] [PubMed] [Google Scholar]
- 44.Sawh AN, Duchaine TF. 2013. A truncated form of dicer tilts the balance of RNA interference pathways. Cell Rep. 4:454–463. 10.1016/j.celrep.2013.07.013 [DOI] [PubMed] [Google Scholar]
- 45.Biton M, Levin A, Slyper M, Alkalay I, Horwitz E, Mor H, Kredo-Russo S, Avnit-Sagi T, Cojocaru G, Zreik F, Bentwich Z, Poy MN, Artis D, Walker MD, Hornstein E, Pikarsky E, Ben-Neriah Y. 2011. Epithelial microRNAs regulate gut mucosal immunity via epithelium-T cell crosstalk. Nat. Immunol. 12:239–246. 10.1038/ni.1994 [DOI] [PubMed] [Google Scholar]
- 46.Brabletz S, Bajdak K, Meidhof S, Burk U, Niedermann G, Firat E, Wellner U, Dimmler A, Faller G, Schubert J, Brabletz T. 2011. The ZEB1/miR-200 feedback loop controls Notch signalling in cancer cells. EMBO J. 30:770–782. 10.1038/emboj.2010.349 [DOI] [PMC free article] [PubMed] [Google Scholar]
- 47.Balakrishnan A, Stearns AT, Park PJ, Dreyfuss JM, Ashley SW, Rhoads DB, Tavakkolizadeh A. 2010. MicroRNA mir-16 is anti-proliferative in enterocytes and exhibits diurnal rhythmicity in intestinal crypts. Exp. Cell Res. 316:3512–3521. 10.1016/j.yexcr.2010.07.007 [DOI] [PMC free article] [PubMed] [Google Scholar]
- 48.Hino K, Fukao T, Watanabe M. 2007. Regulatory interaction of HNF1-alpha to microRNA-194 gene during intestinal epithelial cell differentiation. Nucleic Acids Symp. Ser. (Oxf.)(51):415–416. 10.1093/nass/nrm208 [DOI] [PubMed] [Google Scholar]
- 49.VanDussen KL, Carulli AJ, Keeley TM, Patel SR, Puthoff BJ, Magness ST, Tran IT, Maillard I, Siebel C, Kolterud A, Grosse AS, Gumucio DL, Ernst SA, Tsai YH, Dempsey PJ, Samuelson LC. 2012. Notch signaling modulates proliferation and differentiation of intestinal crypt base columnar stem cells. Development 139:488–497. 10.1242/dev.070763 [DOI] [PMC free article] [PubMed] [Google Scholar]
- 50.Clevers H, Nusse R. 2012. Wnt/beta-catenin signaling and disease. Cell 149:1192–1205. 10.1016/j.cell.2012.05.012 [DOI] [PubMed] [Google Scholar]
- 51.Liao Y, Zhang M, Lonnerdal B. 2013. Growth factor TGF-beta induces intestinal epithelial cell (IEC-6) differentiation: miR-146b as a regulatory component in the negative feedback loop. Genes Nutr. 8:69–78. 10.1007/s12263-012-0297-3 [DOI] [PMC free article] [PubMed] [Google Scholar]
- 52.Triboulet R, Mari B, Lin YL, Chable-Bessia C, Bennasser Y, Lebrigand K, Cardinaud B, Maurin T, Barbry P, Baillat V, Reynes J, Corbeau P, Jeang KT, Benkirane M. 2007. Suppression of microRNA-silencing pathway by HIV-1 during virus replication. Science 315:1579–1582. 10.1126/science.1136319 [DOI] [PubMed] [Google Scholar]
- 53.Yeung ML, Bennasser Y, Myers TG, Jiang G, Benkirane M, Jeang KT. 2005. Changes in microRNA expression profiles in HIV-1-transfected human cells. Retrovirology 2:81. 10.1186/1742-4690-2-81 [DOI] [PMC free article] [PubMed] [Google Scholar]
- 54.Witwer KW, Sarbanes SL, Liu J, Clements JE. 2011. A plasma microRNA signature of acute lentiviral infection: biomarkers of central nervous system disease. AIDS 25:2057–2067. 10.1097/QAD.0b013e32834b95bf [DOI] [PMC free article] [PubMed] [Google Scholar]
- 55.Houzet L, Yeung ML, de Lame V, Desai D, Smith SM, Jeang KT. 2008. MicroRNA profile changes in human immunodeficiency virus type 1 (HIV-1) seropositive individuals. Retrovirology 5:118. 10.1186/1742-4690-5-118 [DOI] [PMC free article] [PubMed] [Google Scholar]
- 56.Huang J, Wang F, Elias Argyris Chen K, Liang Z, Tian H, Huang W, Squires K, Verlinghieri G, Zhang H. 2007. Cellular microRNAs contribute to HIV-1 latency in resting primary CD4+ T lymphocytes. Nat. Med. 13:1241–1247. 10.1038/nm1639 [DOI] [PubMed] [Google Scholar]
- 57.Noorbakhsh F, Ramachandran R, Barsby N, Ellestad KK, LeBlanc A, Dickie P, Baker G, Hollenberg MD, Cohen EA, Power C. 2010. MicroRNA profiling reveals new aspects of HIV neurodegeneration: caspase-6 regulates astrocyte survival. FASEB J. 24:1799–1812. 10.1096/fj.09-147819 [DOI] [PubMed] [Google Scholar]
- 58.Maingat F, Halloran B, Acharjee S, van Marle G, Church D, Gill MJ, Uwiera RR, Cohen EA, Meddings J, Madsen K, Power C. 2011. Inflammation and epithelial cell injury in AIDS enteropathy: involvement of endoplasmic reticulum stress. FASEB J. 25:2211–2220. 10.1096/fj.10-175992 [DOI] [PMC free article] [PubMed] [Google Scholar]
- 59.Ozen M, Creighton CJ, Ozdemir M, Ittmann M. 2008. Widespread deregulation of microRNA expression in human prostate cancer. Oncogene 27:1788–1793. 10.1038/sj.onc.1210809 [DOI] [PubMed] [Google Scholar]
- 60.Smalheiser NR, Lugli G, Rizavi HS, Torvik VI, Turecki G, Dwivedi Y. 2012. MicroRNA expression is down-regulated and reorganized in prefrontal cortex of depressed suicide subjects. PLoS One 7:e33201. 10.1371/journal.pone.0033201 [DOI] [PMC free article] [PubMed] [Google Scholar]
- 61.Wang S, Wang L, Zhu T, Gao X, Li J, Wu Y, Zhu H. 2010. Improvement of tissue preparation for laser capture microdissection: application for cell type-specific miRNA expression profiling in colorectal tumors. BMC Genomics 11:163. 10.1186/1471-2164-11-163 [DOI] [PMC free article] [PubMed] [Google Scholar]
- 62.Wagschal A, Rousset E, Basavarajaiah P, Contreras X, Harwig A, Laurent-Chabalier S, Nakamura M, Chen X, Zhang K, Meziane O, Boyer F, Parrinello H, Berkhout B, Terzian C, Benkirane M, Kiernan R. 2012. Microprocessor, Setx, Xrn2, and Rrp6 cooperate to induce premature termination of transcription by RNAPII. Cell 150:1147–1157. 10.1016/j.cell.2012.08.004 [DOI] [PMC free article] [PubMed] [Google Scholar]
- 63.Kudlow BA, Zhang L, Han M. 2012. Systematic analysis of tissue-restricted miRISCs reveals a broad role for microRNAs in suppressing basal activity of the C. elegans pathogen response. Mol. Cell 46:530–541. 10.1016/j.molcel.2012.03.011 [DOI] [PMC free article] [PubMed] [Google Scholar]
- 64.Lu J, Getz G, Miska EA, Alvarez-Saavedra E, Lamb J, Peck D, Sweet-Cordero A, Ebert BL, Mak RH, Ferrando AA, Downing JR, Jacks T, Horvitz HR, Golub TR. 2005. MicroRNA expression profiles classify human cancers. Nature 435:834–838. 10.1038/nature03702 [DOI] [PubMed] [Google Scholar]
- 65.Faber C, Horst D, Hlubek F, Kirchner T. 2011. Overexpression of Dicer predicts poor survival in colorectal cancer. Eur. J. Cancer 47:1414–1419. 10.1016/j.ejca.2011.01.006 [DOI] [PubMed] [Google Scholar]
Associated Data
This section collects any data citations, data availability statements, or supplementary materials included in this article.