

Abstract
Aims
To evaluate the pharmacokinetics and pharmacodynamics after a single dose of liposomal mifamurtide (liposomal muramyl tripeptide phospatidyl ethanolamine; MEPACT®) in adult subjects with mild (Child-Pugh Class A) or moderate (Child-Pugh Class B) hepatic impairment in comparison with age-, weight- and sex-matched healthy subjects with normal hepatic function.
Methods
Subjects received a 4 mg dose of liposomal mifamurtide via 1 h intravenous infusion. Blood samples were collected over 72 h for pharmacokinetic and pharmacodynamic assessments (changes in serum interleukin-6, tumour necrosis factor-α and C-reactive protein).
Results
Thirty-seven subjects were enrolled: nine with mild hepatic impairment, eight with moderate hepatic impairment and 20 matched healthy subjects. Geometric least-square mean ratios of total mifamurtide AUCinf for the mild hepatic impairment and moderate hepatic impairment groups vs. matched healthy subjects were 105% (90% confidence interval, 83.6–132%) and 119% (90% confidence interval, 94.1–151%), respectively, which are below the protocol-specified threshold (150%) to require development of dose-modification recommendations. Pharmacodynamic parameters for changes in serum interleukin-6 and tumour necrosis factor-α concentrations were generally similar across hepatic function groups. Mifamurtide-induced increases in serum C-reactive protein were attenuated in the moderate hepatic impairment group, consistent with the liver being the major organ of C-reactive protein synthesis. No grade ≥3 adverse events were seen in subjects administered mifamurtide (4 mg).
Conclusions
These results support the conclusion that mild or moderate hepatic impairment does not produce clinically meaningful effects on the clinical pharmacokinetics or pharmacodynamics of mifamurtide; no dose modifications are needed in these special patient populations based on clinical pharmacological considerations.
Keywords: hepatic impairment, liposomes, MEPACT®, mifamurtide, pharmacodynamics, pharmacokinetics
WHAT IS ALREADY KNOWN ABOUT THIS SUBJECT
Liposomal mifamurtide is an immunotherapeutic agent that is indicated for treating high-grade, resectable, nonmetastatic osteosarcoma in combination with postoperative, multi-agent chemotherapy in children, adolescents and young adults.
The pathways of disposition of mifamurtide and the role of the liver as a clearance organ for liposomal mifamurtide in humans had not been characterized.
This phase 1 study was therefore performed to characterize the pharmacokinetics and pharmacodynamics of liposomal mifamurtide in adult volunteers with mild or moderate hepatic impairment, to enable development of scientifically guided dosing recommendations for these special patient populations.
WHAT THIS STUDY ADDS
No dose modifications of liposomal mifamurtide are needed in patients with mild or moderate (Child-Pugh Class A or B) hepatic impairment based on the lack of clinically meaningful effects on its clinical pharmacokinetics or pharmacodynamics, as demonstrated in this study.
The findings from this study have resulted in an update to the EU Summary of Product Characteristics for MEPACT® (liposomal mifamurtide).
Introduction
Mifamurtide (muramyl tripeptide phospatidyl ethanolamine; MTP-PE) is a synthetic molecule derived from muramyl dipeptide, a peptidoglycan component of bacterial cell walls that is a stimulator of innate immunity 1–4. Mifamurtide is a specific ligand of nucleotide-binding oligomerization domain 2, a receptor found primarily on monocytes, dendritic cells and macrophages 5,6. Mifamurtide-activated monocytes recognize and kill tumour cells but do not affect normal cells 2,3. The liposome-encapsulated formulation of mifamurtide (MEPACT®; L-MTP-PE) is approved in the European Union 7, Switzerland and various other countries for the treatment of high-grade, resectable, nonmetastatic osteosarcoma in combination with postoperative multi-agent chemotherapy in children, adolescents and young adults who have undergone macroscopically complete surgical resection.
Liposomal mifamurtide appears to be well tolerated and has demonstrated biological activity in clinical trials in patients and healthy adult subjects. Phase 1 studies in cancer patients 3,8,9 and studies in healthy volunteers 10 have indicated that liposomal mifamurtide has a favourable pharmacokinetic, pharmacodynamic and safety profile. The maximal tolerated dose in cancer patients was determined to be 4–6 mg m−2, and the biologically active dose was in the range of 0.5–2 mg m−2 3,11. This margin between the active dose and the maximal tolerated dose indicates a wide therapeutic range for mifamurtide compared with many conventional chemotherapeutic agents that are dosed at, or close to, the maximal tolerated dose. The recommended clinical dose of mifamurtide is 2 mg m−2 7.
Based on results from phase 2 studies, a large, randomized, phase 3 study (INT-0133) was conducted in patients with newly diagnosed, nonmetastatic, high-grade osteosarcoma 12,13. Following surgery, patients were randomized to receive three- or four-drug chemotherapy regimens and were also randomized to chemotherapy with or without mifamurtide. Results from that study showed a statistically significant and clinically meaningful decrease in the risk of death without compromising safety 12. An updated analysis in 2007, which led to approval in the European Union, showed a relative reduction in the risk of death of 28% [P = 0.0313, hazard ratio = 0.72; 95% confidence interval (CI), 0.53, 0.97] with the addition of mifamurtide in comparison to chemotherapy alone 7. Liposomal mifamurtide appeared generally well tolerated and was associated with low-grade (grade 1 or 2) adverse events (AEs) including fever, chills, fatigue, headache, myalgia, nausea, vomiting and tachycardia, which are related to mifamurtide's mode of action. Recently, a patient access study (MTP-OS-403) was conducted to evaluate mifamurtide at 2 mg m−2 in patients with high-risk, metastatic and recurrent osteosarcoma 14. The median overall survival (OS) was 570 days (95% CI, 480, 663), and the 1 year OS rate was 70% for the total population; for patients who enrolled >9 months since diagnosis and received mifamurtide with concurrent chemotherapy, the 1 year OS rate was 75% 14. Mifamurtide was well tolerated, and the safety profile was consistent with previous studies, with common infusion-related AEs including chills, headache, fatigue, nausea and pyrexia 14.
The pharmacokinetics and pharmacodynamics of liposomal mifamurtide have been characterized in healthy adults 10 and in patients with high-risk, metastatic and recurrent osteosarcoma 14. A recent study has characterized the pharmacokinetic and pharmacodynamic profile of total mifamurtide following a single 4 mg dose in healthy adult volunteers, to examine the clinical pharmacology of mifamurtide independently of the effects of underlying conditions or concomitant chemotherapy 10. The results of that study indicated that single 4 mg doses of mifamurtide can be safely administered to healthy adult volunteers for the purposes of pharmacokinetic and pharmacodynamic characterization, and that variability in mifamurtide pharmacokinetics is low [the coefficient of variation (%CV) in both the area under the curve (AUC) and the maximal concentration (Cmax) was less than 30%]. Furthermore, there was no readily apparent association between age and body surface area (BSA)-normalized clearance (CL) of mifamurtide over the age range of 6–22 years 15.
The mechanisms of clearance of mifamurtide in humans have not been elucidated, and the effects of hepatic impairment on the pharmacokinetics of liposomal mifamurtide are currently unknown. Osteosarcoma primarily affects children, adolescents and young adults, and these patients are expected to be otherwise healthy and without hepatic impairment. However, liposomal mifamurtide is typically administered in combination with multi-agent chemotherapy, including agents such as doxorubicin and high-dose methotrexate, which have potential for hepatic toxicity 12,13. Hepatic toxicities were seen in patients who received chemotherapy in combination with mifamurtide, typically low-grade elevation of aminotransferases 12,13. Given the likelihood that osteosarcoma chemotherapy may cause liver toxicity, it was considered important to investigate the pharmacokinetics of liposomal mifamurtide in the setting of mild or moderate hepatic impairment.
This phase 1, open-label, single-dose study was conducted to evaluate the pharmacokinetics, pharmacodynamics and safety of liposomal mifamurtide in subjects with mild or moderate chronic hepatic impairment (Child-Pugh Class A or B, respectively) compared with healthy subjects, in order to enable development of scientifically guided dosing recommendations for use of liposomal mifamurtide in these patient populations.
Methods
Subjects
Subjects aged 18–75 years and with a body mass index of 18–35 kg m−2 (≥50% of subjects were required to have a body mass index of 18–30 kg m−2) were eligible. Subjects with mild or moderate hepatic impairment (defined as Child-Pugh Class A, score of 5–6, or Child-Pugh Class B, score of 7–9, respectively; Table 1 16,17) were required to have chronic hepatic impairment for at least 3 months before screening, no significant changes in hepatic function in the 30 days before screening or since the last visit if within 6 months before screening, treatment with stable doses of medication (if receiving treatment for hepatic impairment) for at least 4 weeks before dosing, and creatinine clearance at screening >60 ml min−1 estimated using the Cockcroft–Gault formula 18).
Table 1.
The Child-Pugh Score grading system; Child-Pugh Class A = total score of 5–6, B = 7–9 and C > 9
| Parameter | Score 1 | Score 2 | Score 3 |
|---|---|---|---|
| Serum bilirubin (mg dl−1) | <2 | 2–3 | >3 |
| Serum albumin (g dl−1) | >3.5 | 2.8–3.5 | <2.8 |
| INR | <1.7 | 1.7–2.3 | >2.3 |
| Hepatic encephalopathy grade* | None | 1–2 | 3–4 |
| Ascites (grade) | Absent | Slight | Moderate |
Abbreviation is as follows: INR, international normalized ratio.
Grade 0, normal consciousness, personality, neurological examination and electroencephalogram; Grade 1, restless, sleep-disturbed, irritable/agitated, tremor, impaired handwriting and 5 cycles per second waves; Grade 2, lethargic, time-disoriented, inappropriate, asterixis, ataxia and slow triphasic waves; Grade 3, somnolent, stuporous, place-disoriented, hyperactive reflexes, rigidity and slower waves; and Grade 4, unarousable coma, no personality/behaviour, decerebrate and slow 2–3 cycles per second delta activity. Grade 1–2 includes subjects not exhibiting clinical signs of encephalopathy because they had been treated with and were receiving stable doses of lactulose for the treatment of hepatic encephalopathy.
Healthy subjects were determined as healthy by medical history, physical examination and clinical laboratory evaluations and were required to have a urine cotinine level of ≤300 ng ml−1. Healthy subjects were matched to subjects in the mild or moderate hepatic impairment groups by age (±10 years), weight (±10 kg) and sex (±2 per sex).
Subjects with hepatic impairment were excluded if they met one or more of the following criteria: a history of organ transplantation or immunosuppressant therapy; a current or previous history of hepatic carcinoma, hepatorenal syndrome, portacaval shunt surgery, significant hepatic encephalopathy, severe ascites or pleural effusion; or malignancy within the last 5 years, including leukaemia and lymphoma but excluding adequately treated nonmelanoma or basal cell carcinoma. Subjects currently undergoing dialysis, those with active autoimmune or inflammatory disease, acute infections or cardiovascular events within the preceding 6 months, and subjects with significant laboratory abnormalities (in general more than 1.5 times the upper limit of the reference range or ≤60% of the lower limit of the reference range, unless related to hepatic disease) were also excluded. The use of any over-the-counter medication (including vitamins) within 7 days before dosing or during the study was not permitted, unless approved by the investigator, and treatment within 30 days before dosing or during the study with any known drugs that alter hepatic transaminases was also not allowed. For healthy subjects, daily low-dose aspirin (81 mg daily) was allowed, but the use of any prescription medication within 14 days before dosing was not permitted unless approved by the investigator.
All subjects provided voluntary written informed consent. The study protocol and informed consent documentation was approved by the Institutional Review Boards at each of the investigative sites. The study was conducted in compliance with the ethical principles originating in or derived from the Declaration of Helsinki.
Study design
This phase 1, open-label, single-dose, parallel-group study was conducted at two investigative sites in the USA (Orlando Clinical Research Centre, Orlando, FL, USA; and DaVita Clinical Research, Minneapolis, MN, USA). The primary objective was to evaluate the pharmacokinetics and safety of total mifamurtide following a single dose of liposomal mifamurtide in subjects with mild or moderate chronic hepatic impairment, compared with matched healthy subjects. Additional objectives were as follows: to evaluate the pharmacokinetics of free (nonliposome-associated) mifamurtide; to evaluate the urinary excretion of mifamurtide; and to evaluate the pharmacodynamic effects of a single dose of liposomal mifamurtide, as assessed by measurements of changes in serum interluekin-6 (IL-6), tumour necrosis factor-α (TNF-α) and C-reactive protein (CRP).
The study was conducted over a period of 4 days, with follow-up at 7 days postmifamurtide infusion. Subjects were administered a single 4 mg dose of liposomal mifamurtide via intravenous infusion over 1 h. The 4 mg dose was selected to equate approximately to the 2 mg m−2 BSA approved clinical dose of mifamurtide and has been previously evaluated safely in a single-dose clinical pharmacology study in healthy adult volunteers 10.
Assessments
Blood samples (10 ml) for plasma pharmacokinetics were collected at the following time points: predose; at 15, 30 and 45 min following the start of infusion; at the end of infusion (i.e. 1 h after start of infusion, immediately before switching off the infusion pump); at 5, 15 and 30 min and 1, 2, 3, 4, 6, 8 and 11 h following the end of infusion; and at 24, 36, 48 and 72 h following the start of infusion. Plasma concentrations of total and free mifamurtide were measured using a validated liquid chromatography–tandem mass spectrometry method.
Plasma samples (prepared with K2EDTA and stored at −70°C) were either used directly for analyte extraction and bioanalysis of total MTP-PE concentrations or were processed first by ultrafiltration within 45 min of collection, followed by analyte extraction and bioanalysis for measurement of free (nonliposome-associated) concentrations of MTP-PE in the ultrafiltrate. Ultrafiltration of 1 ml plasma aliquots was performed in Millipore 0.22 μm polyvinylidene difluoride 2.0 ml filtration units by centrifugation at 2000g for 10 min at room temperature.
Internal standard (15 ng MTP-PE-13C3-d4) was added to plasma (150 μl) or ultrafiltrate (100 μl) samples, and analytes were extracted by protein precipitation with 0.5% acetic acid in methanol, followed by centrifugation, evaporation of the supernatant under nitrogen at ∼45°C and reconstitution in a 50:50 v/v mixture of 20 mm ammonium formate with 0.1% formic acid and isopropanol. Bioanalysis was performed by high-performance liquid chromatography with column switching and tandem mass (MS/MS) detection using negative ion electrospray. Chromatography consisted of a Load and Elution Column: Phenomenex Gemini C18, 5 μ. 2.0 × 30 mm Load & 50 mm Elution (Phenomenex, Torrance, CA, USA) using mobile phase A, 20 mm ammonium formate with 0.1% formic acid in water, and mobile phase B, 20 mm ammonium formate in 98% acetonitrile/methanol (50/50) with 0.1% formic acid. The load programme was as follows: 40% B for 0.5 min, at a flow rate of 500 μl min−1; 40% B to 100% B over 4 min; 100% B flow rate increased to 1000 μl min−1 over 2.4 min; and 100% B reduced to 40% B over 1.1 min with a reduction in flow rate to 500 μl min−1. The elution programme was as follows: 100% B for 3 min at a flow rate of 300 μl min−1; 100% B flow rate increased to 800 μl min−1 for 3 min; and 100% B reduced to 50% B for 2 min. The retention time for MTP-PE and the internal standard was 5.1 min. Mass spectrometric detection was performed using a Sciex API 5000, Triple Quadrupole LC/MS/MS mass spectrometer operated in an electrospray negative ion MRM mode (AB Sciex, Framingham, MA, USA). The mass transitions monitored for total MTP-PE and MTP-PE-13C3-d4 were 1235.7→1032.7 and 1242.8→1039.5, respectively. The dynamic range of the assay was 0.1–20 nm MTP-PE, and the standard curve was analysed by linear regression with 1/concentration weighting. Precision and accuracy were evaluated by analysing quality control pools prepared at 0.100, 0.210, 0.500, 1.50, 4.00, 15.0 and 40.0 nm. The observed range of interassay precision (%CV, 3.56–9.92), intra-assay precision (%CV, 2.0–10.9), interassay accuracy (absolute percentage difference from theoretical ≤14.3%) and intra-assay accuracy (absolute percentage difference from theoretical ≤14%) were within the prespecified performance criteria for method validation. At the lower limit of quantification (0.1 nm), the corresponding performance characteristics were as follows: interassay precision (%CV, 8.8–9.9), intra-assay precision (%CV, 4.4–7.9), interassay accuracy (absolute percentage difference from theoretical, 3.1–14.3) and intra-assay accuracy (percentage difference from theoretical, 0.9–14.0). The recovery of MTP-PE was 90.1%.
The performance characteristics of the ultrafiltration step for free MTP-PE bioanalysis were evaluated by preparing quality control samples of L-MTP-PE in human plasma (0.1–15 nm) and subjecting them to the ultrafiltration procedure to evaluate specificity for free MTP-PE. The MTP-PE concentrations following ultrafiltration of plasma spiked with 0.1–0.2 nm L-MTP-PE were below the limit of quantification (0.1 nm). When L-MTP-PE was spiked into plasma at concentrations of 0.5–15 nm, the measured concentration of MTP-PE in the ultrafiltrate ranged from 18 to 20% of the spiked concentration (mean ± SD, 19 ± 1.1%). Stability of L-MTP-PE in vitro was qualified by a <20% difference in measured concentration at up to 45 min postspiking into whole blood relative to immediate sample processing. These data were used to support sample processing guidelines that required the plasma preparation and ultrafiltration procedures to be conducted within 45 min of blood sample collection.
Pharmacokinetic parameters for total and free mifamurtide were calculated from plasma concentration–time data in individual subjects by noncompartmental analysis using WinNonlin® (Pharsight, St Louis, MO, USA) version 6.1. The parameters assessed were as follows: maximal plasma concentration (Cmax), area under the concentration vs. time curve from time 0 to the final sample with a concentration greater than the limit of quantification (AUClast) or extrapolated to infinity (AUCinf), terminal half-life (t1/2) and, for total mifamurtide only, CL and volume of distribution at steady state (Vss). As this study involved administration of liposomal mifamurtide, CL and Vss are not reported for free mifamurtide.
Blood samples (5 ml) were collected for measurements of IL-6, TNF-α and CRP serum concentrations at the following time points: before infusion (IL-6, TNF-α and CRP); at the end of infusion (sample drawn immediately before switching off the infusion pump for IL-6 and TNF-α); and at 1, 2, 3, 6 and 8 h following the end of infusion (IL-6 and TNF-α); and at 24 h (IL-6, TNF-α and CRP) and 72 h (CRP) following the start of infusion. Assays of cytokine concentrations were conducted using a sandwich antibody approach by Viracor IBT Laboratories, Inc. (Lee's Summit, MO, USA), using the Meso Scale Discovery (MSD) Sector Imager 2400 instrument. The calibration curves in these assays were anchored to the National Institute for Biological Standards and Control reference material. Pharmacodynamic parameters for IL-6, TNF-α and CRP were calculated by noncompartmental analysis (WinNonlin® version 6.1). The parameters assessed were as follows: observed maximal effect (Eobs,max); time of first occurrence of observed maximal effect (TEobs,max); and area under the effect–time curve from time 0 to time of last point of quantifiable effect (AUEClast; IL-6 and TNF-α only).
Safety was assessed in all subjects who received any amount of mifamurtide. Subjects underwent physical examination, clinical laboratory tests (haematology and clinical chemistry) and 12-lead electrocardiogram at screening and at the end of the study (day 4). Sitting vital signs (blood pressure, heart rate and temperature) were evaluated (±30 min) at the following time points: before the infusion; at the end of infusion; and at 4, 8, 12, 24, 48 and 72 h after start of infusion. AEs were graded by the National Cancer Institute-Common Terminology Criteria for Adverse Events (NCI-CTCAE) version 4.0.
Statistical analysis
All subjects who received the protocol-specified 4 mg dose of liposomal mifamurtide and had adequate pharmacokinetic and pharmacodynamic samples collected for noncompartmental analysis were included in the respective analyses. All subjects who received any dose of mifamurtide were included in the safety population. A sample size of 32 subjects (eight per group) was planned, based on typically used sample sizes in pharmacokinetic studies in patients with hepatic impairment, as follows: eight subjects with mild hepatic impairment, eight subjects with moderate hepatic impairment, and eight age-, weight- and sex-matched, healthy subjects for each hepatic impairment group. This sample size was supported by the relatively low variability in mifamurtide pharmacokinetics (%CV <30% for AUC and Cmax) 10 and was therefore considered adequate to estimate clinically relevant effects (e.g. 2-fold or higher) of hepatic impairment on pharmacokinetic parameters with sufficient precision. Specifically, based on previous estimates of %CV in the AUC of MTP-PE of <30% 10, it was expected that with a sample size of eight subjects per group, the effect of mild or moderate hepatic impairment on MTP-PE pharmacokinetics will be estimated with adequate precision such that 90% CIs for the ratio of geometric mean AUCs (impaired vs. normal hepatic function) would be expected to be contained within 80–125% of the estimated geometric mean ratio. Based on the 2- to 3-fold therapeutic range between the clinical dose and maximal tolerated dose of liposomal mifamurtide, the protocol prospectively specified a minimal threshold of a 50% increase in total systemic exposure to require development of dose-modification recommendations for patients with mild or moderate hepatic impairment.
Pharmacokinetic parameters of total and free (nonliposomal) mifamurtide were summarized descriptively by hepatic function group. An analysis of variance (ANOVA) was performed on log-transformed AUCinf and AUClast and log-transformed Cmax to compare the pharmacokinetic parameters of total mifamurtide between subjects in the mild or moderate hepatic impairment groups and matched healthy subject groups. Analyses were performed using SAS® version 9.1 (SAS Institute, Inc., Cary, NC, USA). Ratios of geometric mean Cmax and AUCinf and AUClast of total mifamurtide (hepatic impaired vs. matched healthy subject groups) were determined, with associated 90% CIs. The pharmacodynamic parameters AUEClast, Eobs,max and TEobs,max for IL-6 and TNF-α, and Eobs,max and TEobs,max for CRP, were summarized descriptively by hepatic function group.
Results
Subjects
Between 7 September 2010 and 1 July 2011, 37 subjects were enrolled, including nine with mild hepatic impairment, eight with moderate hepatic impairment and 20 healthy subjects, with 10 subjects in each of the mild-matched and moderate-matched healthy subject groups. Subject demographics are summarized by hepatic function group in Table 2, and baseline hepatic function characteristics are summarized in Table 3. The median Child-Pugh scores for the mild and moderate hepatic impairment groups were 5 (range 5–6) and 7 (range 7–8), respectively. One subject (11%) in the mild hepatic impairment group and four subjects (50%) in the moderate hepatic impairment group had hepatic encephalopathy of grade 1 or 2. No subjects had grade 3 or higher hepatic encephalopathy. Likewise, ascites was more common in the moderate hepatic impairment group, and median serum albumin concentration was lower.
Table 2.
Subject demographics in the safety population, by hepatic function group
| Characteristic | Mild HI (n = 9) | Healthy match, mild HI (n = 10) | Moderate HI (n = 8) | Healthy match, moderate HI (n = 10) |
|---|---|---|---|---|
| Median age [years (range)] | 52 (36–57) | 50 (26–63) | 54.5 (52–62) | 51.5 (45–61) |
| Sex, male [n (%)] | 6 (67) | 7 (70) | 5 (63) | 7 (70) |
| Race [n (%)] | ||||
| White | 7 (78) | 7 (70) | 7 (88) | 7 (70) |
| Black or African American | 2 (22) | 2 (20) | 0 | 3 (30) |
| American Indian or Alaska Native | 0 | 0 | 1 (13) | 0 |
| Other | 0 | 1 (10) | 0 | 0 |
| Median weight [kg (range)] | 83.3 (58.0–99.4) | 84.2 (63.0–104.6) | 89.7 (64.3–106.2) | 90.2 (65.2–102.7) |
| Median BSA [m2 (range)] | 2.02 (1.64–2.19) | 1.98 (1.73–2.33) | 2.02 (1.71–2.24) | 2.09 (1.72–2.21) |
Abbreviations are as follows: BSA, body surface area; and HI, hepatic impairment.
Table 3.
Baseline hepatic function characteristics in the pharmacokinetics population, by hepatic function group
| Characteristic | Mild HI (n = 9) | Healthy match, mild HI (n = 9) | Moderate HI (n = 8) | Healthy match, moderate HI (n = 10) |
|---|---|---|---|---|
| Median Child-Pugh Score (range) | 5.0 (5–6) | NA | 7.0 (7–8) | NA |
| Hepatic encephalopathy grade: none / 1–2 [n (%)] | 8 (89) / 1 (11) | 9 (100) / 0 | 4 (50) / 4 (50) | 10 (100) / 0 |
| Ascites: absent / mild / moderate [n (%)] | 8 (89) / 1(11) / 0 | 9 (100) / 0 / 0 | 2 (25) / 4 (50) / 2 (25) | 10 (100) / 0 / 0 |
| Median bilirubin [mg dl−1 (range)] | 0.80 (0.5–1.8) | 0.70 (0.4–1.8) | 1.55 (1.3–2.8) | 0.75 (0.5–1.0) |
| Median albumin [g dl−1 (range)] | 4.20 (3.6–4.7) | 4.30 (4.1–4.8) | 3.60 (2.2–4.2) | 4.40 (4.1–4.9) |
| Median prothrombin time [s (range)] | 11.70 (10.3–14.3) | 12.60 (10.3–13.8) | 14.70 (11.6–16.6) | 10.90 (10.0–13.0) |
| Median INR (range) | 1.00 (0.9–1.2) | 1.00 (1.0–1.1) | 1.30 (1.1–1.4) | 1.00 (0.9–1.0) |
Abbreviations are as follows: HI, hepatic impairment; INR, international normalized ratio; and NA, not applicable.
The pharmacokinetic and pharmacodynamic populations included 36 subjects. One subject, a 53-year-old, non-Hispanic, European, white male who was a healthy subject in the mild-matched group, was not included due to having received a mifamurtide dose of 6.96 mg.
Pharmacokinetics
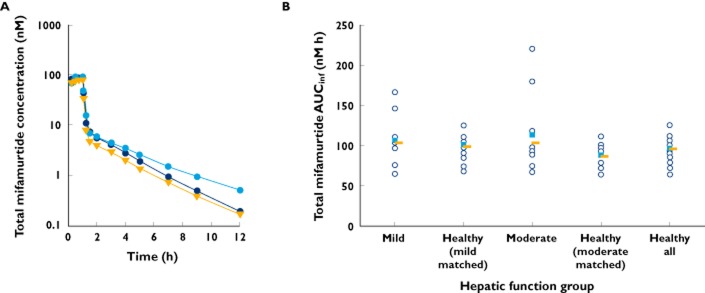
Mean plasma concentration–time profiles of total mifamurtide in the mild or moderate hepatic impairment groups and in healthy subjects are shown in Figure 1A. Plasma concentrations of total mifamurtide increased during the 1 h infusion, and then declined in a biphasic manner in all groups. A rapid initial distribution phase was characterized by a steep decline in plasma concentrations (>90% decrease from peak concentrations within 30 min of infusion cessation). This was followed by a slower decline in plasma concentrations in the terminal phase; plasma concentrations fell below quantifiable limits (0.1 nm) by 24 h postdose in most subjects. The mean plasma concentration–time profiles indicated that plasma concentrations of total mifamurtide were generally similar across the hepatic impairment groups and matched healthy subjects, with the exception of a slower rate of decline of mean plasma mifamurtide concentrations in the terminal phase in subjects with moderate hepatic impairment.
Figure 1.
Mean plasma concentration–time profiles (A;  , mild;
  , moderate; and
  , healthy all) and individual (
 ), mean (
 ) and geometric mean values (
 ) of the area under the plasma concentration–time curve from time 0 to infinity (AUCinf; B) of total mifamurtide in subjects with mild or moderate hepatic impairment and in matched healthy subjects (‘healthy all’ represents the mean across all subjects in the two matched healthy subject groups)
Descriptive statistics of pharmacokinetic parameters of total mifamurtide by hepatic function group are shown in Table 4. Geometric mean values of AUCinf, Cmax and CL of total mifamurtide were similar between subjects with mild or moderate hepatic impairment and their respective matched healthy subject groups with normal hepatic function. The mean t1/2 of total mifamurtide was short, ranging from 2.02 to 2.15 h, for the mild hepatic impairment and healthy subject groups, and was slightly longer (3.21 h) in subjects with moderate hepatic impairment, consistent with the observed mean plasma concentration–time profiles. The distribution of individual values of AUCinf (Figure 1B) and Cmax (data not shown) was generally similar, with substantial overlap across all hepatic function groups. The variability in pharmacokinetic parameters was low, with the %CV in AUCinf and Cmax being <30%, for healthy subjects and for subjects with mild hepatic impairment. Subjects with moderate hepatic impairment showed more variability (%CV in AUCinf of 50% and in Cmax of 48%).
Table 4.
Geometric mean (%CV) plasma pharmacokinetic parameters for total and free mifamurtide by hepatic function group
| Parameter, geometric mean (%CV) | Mild HI (n = 9) | Healthy match, mild HI (n = 9) | Moderate HI (n = 8) | Healthy match, moderate HI (n = 10) |
|---|---|---|---|---|
| Total mifamurtide | ||||
| AUCinf (nm h) | 104 (29) | 98.8 (15) | 103 (50) | 86.8 (17)* |
| Cmax (nm) | 94.2 (23) | 96.4 (18) | 92.4 (48) | 81.3 (24) |
| t1/2 [h; mean (SD)] | 2.02 (0.291) | 2.15 (0.308) | 3.21 (1.27) | 2.14 (0.322)* |
| CL (ml min−1) | 520 (29) | 546 (16) | 522 (38) | 621 (18)* |
| Vss (l) | 24.8 (27) | 22.3 (19) | 38.9 (55) | 28.4 (24)* |
| Free mifamurtide | ||||
| AUCinf (nm h) | 23.8 (38) | 16.2 (19) | 24.9 (71) | 17.0 (44) |
| Cmax (nm) | 8.65 (28) | 5.85 (26) | 6.21 (60) | 5.67 (32) |
| t1/2 [h; mean (SD)] | 1.99 (0.329) | 2.25 (0.504) | 3.15 (0.939) | 2.27 (0.460) |
| Tmax [h; median (range)] | 1.00 (1.0–1.3) | 1.00 (0.8–1.0) | 1.00 (1.0–1.1) | 1.00 (0.8–1.0) |
Abbreviations are as follows: AUCinf, area under the plasma concentration–time curve from time 0 to infinity; CL, clearance; Cmax, maximal concentration; CV, coefficient of variation; HI, hepatic impairment; Tmax, time to first occurrence of maximal concentration; t1/2, terminal half-life; and Vss, volume of distribution at steady state.
n = 9.
Consistent with the observed distributions of individual values of AUCinf and Cmax by hepatic function group, the statistical model-estimated ratios (expressed as a percentage) of geometric mean AUCinf and Cmax of total mifamurtide for the mild hepatic impairment group in reference to the matched healthy subject group were close to 100% (Table 5); therefore, mild hepatic impairment did not alter the pharmacokinetics of total mifamurtide following administration of liposomal mifamurtide. The geometric least-square mean ratio (expressed as a percentage) of AUCinf for the moderate hepatic impairment group in reference to the matched healthy subject group was 119% (Table 5). Thus, moderate hepatic impairment was associated with a small (∼19%) increase in geometric mean systemic exposure (AUCinf) of total mifamurtide. However, this ratio (119%) was below the protocol-specified threshold of 150% to require development of dose-modification recommendations.
Table 5.
Statistical analysis of total mifamurtide pharmacokinetic parameters by hepatic function group
| Parameter | Comparison | Geometric least-square mean ratio (%) | 90% CI (%) |
|---|---|---|---|
| AUCinf (nm h) | Mild vs. healthy (mild-matched) | 105 | (83.6, 132) |
| Moderate vs. healthy (moderate-matched) | 119 | (94.1, 151) | |
| Cmax (nm) | Mild vs. healthy (mild-matched) | 97.8 | (78.5, 122) |
| Moderate vs. healthy (moderate-matched) | 114 | (91.1, 142) |
Abbreviations are as follows: AUCinf, area under the plasma concentration–time curve from time 0 to infinity; CI, confidence interval; and Cmax, maximal concentration.
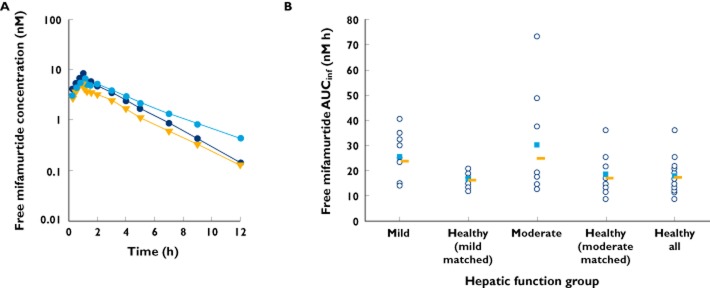
Mean plasma concentration–time profiles of free mifamurtide in the hepatic function groups are shown in Figure 2A. There was a small increase in mean plasma concentrations of free mifamurtide in the hepatic impairment groups relative to the healthy subjects, with a slower rate of decline of mean plasma concentrations of free mifamurtide in the terminal phase in subjects with moderate hepatic impairment. Descriptive statistics of pharmacokinetic parameters of free mifamurtide by hepatic function group are summarized in Table 4, with individual and geometric mean values for AUCinf of free mifamurtide shown in Figure 2B. The systemic exposure (AUCinf) of free mifamurtide ranged from 16.2 to 24.9 nm h across the hepatic function groups; corresponding estimates of AUCinf of total mifamurtide ranged from 86.8 to 104 nm h, indicating that free mifamurtide systemic exposure is approximately one-sixth to one-quarter of the corresponding total mifamurtide exposure. Across the hepatic function groups, geometric mean values of Cmax of free mifamurtide were similar when viewed in the context of variability (%CV in Cmax, 28–60%). Consistent with the observed concentration–time profiles, geometric mean values of AUCinf in the mild and moderate hepatic impairment groups were 46–47% higher than those observed in the respective matched healthy subject groups. However, the magnitude of increase in exposures was small (<50%), and there was substantial overlap in free mifamurtide exposures across the hepatic function groups (Figure 2B). The mean t1/2 of free mifamurtide was short and similar to that observed for total mifamurtide, ranging from 1.99 to 2.27 h across the mild hepatic impairment and healthy subject groups, and was slightly longer, at 3.15 h, for the moderate hepatic impairment group, consistent with the observed concentration–time profiles.
Figure 2.
Mean plasma concentration–time profiles (A;  , mild;
  , moderate; and
  , healthy all) and individual (
 ), mean (
 ) and geometric mean values (
 ) of AUCinf (B) of free (nonliposome-associated) mifamurtide in subjects with mild or moderate hepatic impairment and in matched healthy subjects (‘healthy all’ represents the mean across all subjects in the two matched healthy groups)
Pharmacodynamics
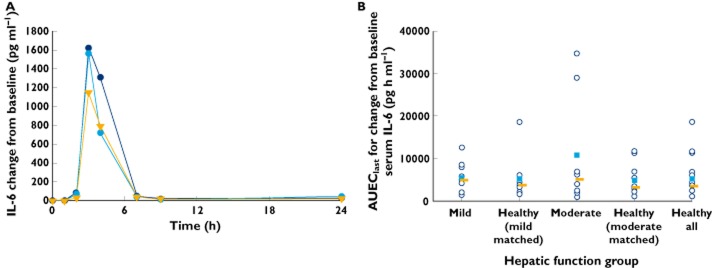
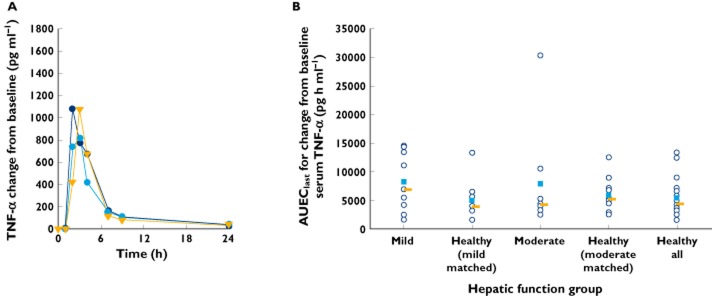
Descriptive statistics of pharmacodynamic parameters are shown in Table 6. Increases in the serum concentrations of IL-6 and TNF-α were observed after liposomal mifamurtide infusion. The time courses of the median change from baseline in serum concentrations of IL-6 and TNF-α by hepatic function group are shown in Figures 3A and 4A, respectively, with individual and median values of AUEClast graphically depicted by hepatic function group in Figures 3B and 4B, respectively.
Table 6.
Baseline-adjusted pharmacodynamic parameters for interleukin-6, tumour necrosis factor-α and C-reactive protein (pharmacodynamics population) by hepatic function group
| Parameter | Mild HI (n = 9) | Healthy match, mild HI (n = 9) | Moderate HI (n = 8) | Healthy match, moderate HI (n = 10) |
|---|---|---|---|---|
| Median AUEClast [pg h ml−1 (range)] | ||||
| Interleukin-6 | 4880 (1220–12 500) | 3650 (1510–18 500) | 4980 (851–34 700) | 3150 (961–11 600) |
| Tumour necrosis factor-α | 6900 (1670–14 600) | 3870 (1570–13 300) | 4250 (2470–30 200) | 5200 (2510–12 500) |
| Median TEobs,max [h (range)] | ||||
| Interleukin-6 | 3.03 (3.0–4.0) | 4.00 (3.0–4.0) | 3.50 (3.0–4.1) | 3.00 (3.0–4.2) |
| Tumour necrosis factor-α | 3.0 (2.0–3.3) | 3.00 (3.0–4.0) | 3.00 (2.0–3.0) | 3.00 (2.0–3.0) |
| Median Eobs,max (range) | ||||
| Interleukin-6 (pg ml−1) | 1620 (457–4100) | 1330 (482–6560) | 1780 (444–10 000) | 1150 (348–4230) |
| Tumour necrosis factor-α (pg ml−1) | 2580 (416–8220) | 1050 (493–5730) | 1120 (446–6450) | 2080 (685–5340) |
| C-Reactive protein (mg dl−1) | 2.02 (1.0–8.9) | 5.14 (3.2–7.5) | 1.54 (0.7–5.5)* | 4.97 (2.9–7.6)† |
Abbreviations are as follows: AUEClast, area under the effect–time curve from time 0 to time of the last point of quantifiable effect; Eobs,max, observed maximal effect; HI, hepatic impairment; and TEobs,max, time of first occurrence of Eobs,max.
*n = 7.
n = 9.
Figure 3.
Time course of median change from baseline serum interleukin-6 (IL-6; A;  , mild;
  , moderate; and
  , healthy all) and individual (
 ), mean (
 ) and median values (
 ) of area under the effect–time curve from time 0 to time of the last point of quantifiable effect (AUEClast) for change from baseline serum IL-6 (B) by hepatic function group
Figure 4.
Time course of median change from baseline serum tumour necrosis factor-α (TNF-α; A;  , mild;
  , moderate; and
  , healthy all) and individual (
 ), mean (
 ) and median values (
 ) of AUEClast for change from baseline serum TNF-α (B) by hepatic function group
Maximal increases in serum concentrations of IL-6 and TNF-α generally occurred 3–4 h or by 3 h, respectively, after the infusion was initiated, returning towards baseline at 7 h following initiation of infusion. Although all subjects showed increases in serum IL-6 and TNF-α following liposomal mifamurtide infusion, the variability in baseline-adjusted pharmacodynamic parameters was high, with a 10- to 41-fold range in individual values of AUEClast and a 9- to 23-fold range in individual values of Eobs,max for IL-6 across the hepatic function groups and, respectively, a 5- to 12-fold range for AUEClast and an 8- to 20-fold range for Eobs,max for TNF-α. The baseline-adjusted IL-6 and TNF-α pharmacodynamic parameters were generally similar across hepatic function groups when viewed in the context of the observed pharmacodynamic variability.
According to the protocol-specified sampling scheme, CRP was measured only before dose administration and at 24 and 72 h postdose, which did not permit calculation of AUEClast. Median changes from baseline in serum concentrations of CRP over time are shown in Figure 5A, with individual and median values of Eobs,max graphically depicted by hepatic function group in Figure 5B. Although all subjects across the hepatic function groups displayed treatment-related increases in serum CRP concentrations, the median values of change from baseline CRP over time and the baseline-adjusted Eobs,max for increases in serum CRP were generally lower in the mild and moderate hepatic impairment groups when compared with the respective matched healthy subject groups. This difference was particularly pronounced in moderate hepatic impairment, where there was a clearly discernible reduction in the effect of liposomal mifamurtide on serum CRP concentrations, with Eobs,max values in six of seven subjects in the moderate hepatic impairment group being below the lower limit of the range of Eobs,max values in the corresponding matched healthy subject group. These observations are consistent with the liver being the major organ of CRP synthesis 19.
Figure 5.
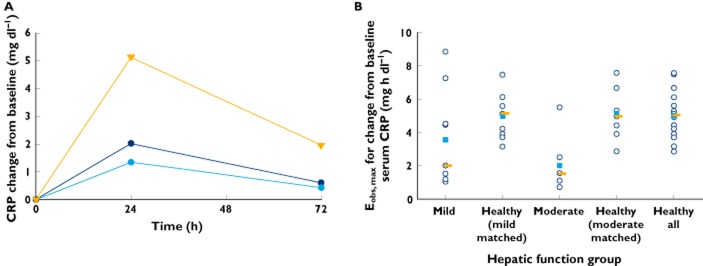
Time course of median change from baseline serum C-reactive protein (CRP; A;  , mild;
  , moderate; and
  , healthy all) and individual (
 ), mean (
 ) and median values (
 ) of observed maximal effect (Eobs,max) for change from baseline serum CRP (B) by hepatic function group
Safety
Thirty-six of the 37 subjects (96%) had at least one drug-related AE. Drug-related AEs by hepatic function group are summarized in Table 7. No grade 4 AEs, serious AEs or deaths occurred during the study. Across the hepatic function groups, all AEs were of grade 1 or 2 in all subjects who were administered the protocol-specified 4 mg dose of liposomal mifamurtide. A single grade 3 drug-related AE, of orthostatic hypotension, occurred in the subject in the mild-matched healthy subject group who accidentally received 6.96 mg of mifamurtide. The most common drug-related AEs (≥25% subjects) were headache (73%), chills (70%), nausea (41%), orthostatic hypotension (38%), pyrexia (35%), tachycardia (32%) and vomiting (27%). None of the subjects in the moderate hepatic impairment group reported pyrexia or vomiting relative to three to six subjects (pyrexia) or two to four subjects (vomiting) in each of the other groups. No other notable differences were seen between treatment groups for these common AEs.
Table 7.
Most common all-grade, treatment-emergent, drug-related adverse events (≥10% subjects in total)
| Adverse event [n (%)] | Mild HI (n = 9) | Healthy match, mild HI (n = 10) | Moderate HI (n = 8) | Healthy match, moderate HI (n = 10) | Total (n = 37) |
|---|---|---|---|---|---|
| Headache | 7 (78) | 9 (90) | 5 (63) | 6 (70) | 27 (73) |
| Chills | 8 (89) | 8 (80) | 4 (50) | 6 (60) | 26 (70) |
| Nausea | 5 (56) | 4 (40) | 2 (25) | 4 (40) | 15 (41) |
| Orthostatic hypotension | 3 (33) | 5 (50) | 4 (50) | 2 (20) | 14 (38) |
| Pyrexia | 6 (67) | 4 (40) | 0 | 3 (30) | 13 (35) |
| Tachycardia | 2 (22) | 3 (30) | 2 (25) | 5 (50) | 12 (32) |
| Vomiting | 2 (22) | 4 (40) | 0 | 4 (40) | 10 (27) |
| Influenza-like illness | 1 (11) | 2 (20) | 3 (38) | 3 (30) | 9 (24) |
| Dizziness | 2 (22) | 1 (10) | 1 (13) | 3 (30) | 7 (19) |
| Hypotension | 3 (33) | 1 (10) | 0 | 2 (20) | 6 (16) |
| Myalgia | 2 (22) | 3 (30) | 0 | 0 | 5 (14) |
| Fatigue | 1 (11) | 3 (30) | 0 | 0 | 4 (11) |
| Sinus tachycardia | 1 (11) | 2 (20) | 0 | 1 (10) | 4 (11) |
| Back pain | 2 (22) | 1 (10) | 0 | 1 (10) | 4 (11) |
Abbreviation is as follows: HI, hepatic impairment.
Discussion
This study was designed to evaluate the pharmacokinetics, pharmacodynamics and safety of liposomal mifamurtide in subjects with mild (Child-Pugh Class A) or moderate (Child-Pugh Class B) hepatic impairment in comparison to age-, weight- and sex-matched healthy subjects with normal hepatic function. As this study was performed in an adult population, a fixed dose of 4 mg of liposomal mifamurtide was administered to all subjects via intravenous infusion over 1 h, selected to approximate the recommended clinical dose of 2 mg m−2 that is administered to paediatric, adolescent and adult patients with osteosarcoma 7,14. The use of otherwise healthy subjects with mild or moderate hepatic impairment and matched healthy subject groups in this study was supported by prior clinical experience with liposomal mifamurtide in healthy adult volunteers that supported the safety of a single 4 mg dose of liposomal mifamurtide in healthy adult volunteers 10. Importantly, data from the MTP-OS-403 study in paediatric, adolescent and adult patients with osteosarcoma 14,15 and the MTP-OS-402 study in healthy adult volunteers 10 indicate similar pharmacokinetic properties, specifically BSA-normalized clearance of mifamurtide, in osteosarcoma patients and in healthy adults. These data supported the evaluation of the effect of hepatic impairment on the pharmacokinetics of liposomal mifamurtide in an adult volunteer population in this study to inform dosing of osteosarcoma patients with mild or moderate hepatic impairment. Evaluation of single-dose pharmacokinetics was supported by a short half-life of mifamurtide of approximately 2 h 10 and the previously demonstrated lack of accumulation following twice-weekly repeat-dose administration 20.
This study characterized the plasma pharmacokinetics of both total (sum of liposome-associated and nonliposome-associated) mifamurtide and free (nonliposome-associated) mifamurtide. Total mifamurtide displayed biphasic disposition kinetics. Free mifamurtide concentrations were substantially lower than total mifamurtide concentrations during the infusion and immediate postinfusion period, although the differences in concentrations of total vs. free mifamurtide were less pronounced in the terminal disposition phase, where both total and free mifamurtide concentrations declined with similar terminal half-lives of 2 h. The mean overall exposure (AUCinf) of free mifamurtide was approximately one-sixth to one-quarter of that of total mifamurtide.
Mild or moderate hepatic impairment did not produce any clinically meaningful effects on the pharmacokinetics of total mifamurtide. There was no effect of mild hepatic impairment on total mifamurtide AUCinf or Cmax. The statistical model-estimated ratios (expressed as a percentage) of geometric mean AUCinf and Cmax of total mifamurtide for mild hepatic impairment in reference to the matched normal hepatic function group were close to 100%, with 90% CIs that included 100%. Moderate hepatic impairment was associated with a small (∼19%) increase in geometric mean systemic exposure (AUCinf) and a longer mean t1/2 of 3.21 h, vs. 2.14 h in the matched healthy subjects for total mifamurtide. The geometric least-square mean ratio (expressed as a percentage) of AUCinf for moderate hepatic impairment in reference to the matched normal hepatic function group was 119% (90% CI, 94.1–151%). This ratio was below the protocol-specified threshold of 150% (i.e. a 50% increase in total systemic exposure) to require development of dose-modification recommendations for patients with mild or moderate hepatic impairment. Additionally, the upper limit of the associated 90% CI for this ratio was close to 150% and did not exceed 200%, supporting adequate precision in its estimation to support the conclusion that there is no clinically significant effect of moderate hepatic impairment on the exposure of total mifamurtide following liposomal mifamurtide administration. Liposomal mifamurtide has a wide therapeutic range. The clinical dose of 2 mg m−2 represents the optimal biological dose for activation of monocyte tumouricidal activity and is two to three times below the maximal tolerated dose of 4–6 mg m−2 3,11. Therefore, this observed 19% increase in geometric mean total mifamurtide exposure is not expected to be of any clinical relevance.
As with total mifamurtide, there were no clinically meaningful effects of mild or moderate hepatic impairment on the pharmacokinetics of free mifamurtide. Mild and moderate hepatic impairment were associated with a small increase in mean systemic exposures of free mifamurtide, although the magnitudes of these increases were less than 50%. Viewed in the context of the wide therapeutic range of liposomal mifamurtide, it can be concluded that these relatively small observed changes in free mifamurtide exposures are not expected to be of clinical relevance.
The expected pharmacodynamic effects of liposomal mifamurtide were observed in this study, characterized by postinfusion increases in serum concentrations of the pro-inflammatory cytokines IL-6 and TNF-α, as well as CRP, consistent with the pharmacological mechanism of action of liposomal mifamurtide and with findings in the previous studies of liposomal mifamurtide 14,15. Consistent with previously noted observations in healthy adult volunteers 10, the variability in these pharmacodynamic effects and associated parameters (AUEClast and Eobs,max) was greater than the variability in pharmacokinetics. When viewed in the context of observed pharmacodynamic variability, there were no consistent or meaningful effects of mild or moderate hepatic impairment on the pharmacodynamics effect parameters characterizing increases in serum IL-6 and TNF-α following liposomal mifamurtide infusion. In contrast to the effects of liposomal mifamurtide on IL-6 and TNF-α, which were similar across the hepatic function groups, the magnitude of increase in serum CRP was substantially decreased in the moderate hepatic impairment group when compared with the corresponding magnitude of this effect in the matched healthy subject group. This observation is consistent with the liver being the main organ of synthesis of CRP 19, such that moderate hepatic impairment would compromise the capacity of the liver to synthesize this acute-phase protein in response to pro-inflammatory cytokines, including IL-6, released following liposomal mifamurtide administration. For example, a study of postsurgical increases in serum CRP following varying levels of hepatic resection showed an inverse association between serum CRP response and the extent of hepatic tissue resection 21. Therefore, the dampened CRP response following treatment with liposomal mifamurtide in subjects with moderate hepatic impairment is probably explained by physiological reasons related to the underlying hepatic impairment in subjects with Child-Pugh Class B chronic liver impairment. Nevertheless, the similarity in treatment-related IL-6 and TNF-α responses across the hepatic function groups indicates the lack of an effect of mild or moderate hepatic impairment on these proximal immunostimulatory end-points of primary pharmacodynamic effects of liposomal mifamurtide.
The AE profile observed in this study was generally consistent with the pharmacological mechanism of action of mifamurtide and previous clinical experience with liposomal mifamurtide in an adult volunteer population 10. The most common drug-related AEs (≥25%) in this study were headache, chills, nausea, orthostatic hypotension, pyrexia, tachycardia and vomiting. These physiological responses are consistent with the immunostimulatory pharmacodynamic effects of mifamurtide and the observed increases in serum concentrations of pro-inflammatory cytokines IL-6 and TNF-α. None of the subjects in the moderate hepatic impairment group reported pyrexia or vomiting relative to three to six subjects (pyrexia) or two to four subjects (vomiting) in each of the other groups. No other differences were noted between treatment groups for the other common events.
The results of this study collectively support the conclusion that mild or moderate hepatic impairment does not produce clinically meaningful effects on the clinical pharmacokinetics or pharmacodynamics of mifamurtide. Based on these findings, no dose modifications based on hepatic function appear necessary for patients with mild or moderate hepatic impairment based on clinical pharmacological considerations. The findings from this study have resulted in an update to the EU Summary of Product Characteristics for MEPACT (liposomal mifamurtide) 7.
Acknowledgments
The authors would like to thank Matt Mockler for overseeing the operational conduct of the study, and Martin Paton for his leadership in developing bio-analytical methodology for plasma pharmacokinetic measurements of total and free mifamurtide. The authors acknowledge the writing assistance of Nadia Korfali and Steve Hill of FireKite, which was funded by Millennium: The Takeda Oncology Company.
Competing Interests
All authors have completed the Unified Competing Interest form at http://www.icmje.org/coi_disclosure.pdf (available on request from the corresponding author) and declare: KV, YL, DN, JM, MB and AM are employees of Takeda Pharmaceuticals International Company; CO is an employee of Takeda Global Research and Development Europe; TM and KF have no financial relationships with any organizations that might have an interest in the submitted work in the previous 3 years.
References
- 1.Frampton JE. Mifamurtide: a review of its use in the treatment of osteosarcoma. Paediatr Drugs. 2010;12:141–153. doi: 10.2165/11204910-000000000-00000. [DOI] [PubMed] [Google Scholar]
- 2.Kleinerman ES, Erickson KL, Schroit AJ, Fogler WE, Fidler IJ. Activation of tumoricidal properties in human blood monocytes by liposomes containing lipophilic muramyl tripeptide. Cancer Res. 1983;43:2010–2014. [PubMed] [Google Scholar]
- 3.Kleinerman ES, Murray JL, Snyder JS, Cunningham JE, Fidler IJ. Activation of tumoricidal properties in monocytes from cancer patients following intravenous administration of liposomes containing muramyl tripeptide phosphatidylethanolamine. Cancer Res. 1989;49:4665–4670. [PubMed] [Google Scholar]
- 4.Meyers PA. Muramyl tripeptide (mifamurtide) for the treatment of osteosarcoma. Expert Rev Anticancer Ther. 2009;9:1035–1049. doi: 10.1586/era.09.69. [DOI] [PubMed] [Google Scholar]
- 5.Gutierrez O, Pipaon C, Inohara N, Fontalba A, Ogura Y, Prosper F, Nunez G, Fernandez-Luna JL. Induction of Nod2 in myelomonocytic and intestinal epithelial cells via nuclear factor-kappa B activation. J Biol Chem. 2002;277:41701–41705. doi: 10.1074/jbc.M206473200. [DOI] [PubMed] [Google Scholar]
- 6.Ogura Y, Inohara N, Benito A, Chen FF, Yamaoka S, Nunez G. Nod2, a Nod1/Apaf-1 family member that is restricted to monocytes and activates NF-kappaB. J Biol Chem. 2001;276:4812–4818. doi: 10.1074/jbc.M008072200. [DOI] [PubMed] [Google Scholar]
- 7.Takeda Pharmaceutical Company Ltd. MEPACT summary of product characteristics. 2013. Available at http://www.ema.europa.eu/docs/en_GB/document_library/EPAR_-_Product_Information/human/000802/WC500026565.pdf (last accessed 28 February 2013)
- 8.Creaven PJ, Cowens JW, Brenner DE, Dadey BM, Han T, Huben R, Karakousis C, Frost H, LeSher D, Hanagan J. Initial clinical trial of the macrophage activator muramyl tripeptide-phosphatidylethanolamine encapsulated in liposomes in patients with advanced cancer. J Biol Response Mod. 1990;9:492–498. [PubMed] [Google Scholar]
- 9.Urba WJ, Hartmann LC, Longo DL, Steis RG, Smith JW, Kedar I, Creekmore S, Sznol M, Conlon K, Kopp WC. Phase I and immunomodulatory study of a muramyl peptide, muramyl tripeptide phosphatidylethanolamine. Cancer Res. 1990;50:2979–2986. [PubMed] [Google Scholar]
- 10.Venkatakrishnan K, Kramer WG, Synold TW, Goodman DB, Sides E, III, Oliva C. A pharmacokinetic, pharmacodynamic, and electrocardiographic study of liposomal mifamurtide (L-MTP-PE) in healthy adult volunteers. Eur J Clin Pharmacol. 2012;68:1347–1355. doi: 10.1007/s00228-012-1262-1. [DOI] [PubMed] [Google Scholar]
- 11.Murray JL, Kleinerman ES, Cunningham JE, Tatom JR, Andrejcio K, Lepe-Zuniga J, Lamki LM, Rosenblum MG, Frost H, Gutterman JU. Phase I trial of liposomal muramyl tripeptide phosphatidylethanolamine in cancer patients. J Clin Oncol. 1989;7:1915–1925. doi: 10.1200/JCO.1989.7.12.1915. [DOI] [PubMed] [Google Scholar]
- 12.Meyers PA, Schwartz CL, Krailo MD, Healey JH, Bernstein ML, Betcher D, Ferguson WS, Gebhardt MC, Goorin AM, Harris M, Kleinerman E, Link MP, Nadel H, Nieder M, Siegal GP, Weiner MA, Wells RJ, Womer RB, Grier HE. Osteosarcoma: the addition of muramyl tripeptide to chemotherapy improves overall survival–a report from the Children's Oncology Group. J Clin Oncol. 2008;26:633–638. doi: 10.1200/JCO.2008.14.0095. [DOI] [PubMed] [Google Scholar]
- 13.Chou AJ, Kleinerman ES, Krailo MD, Chen Z, Betcher DL, Healey JH, Conrad EU, III, Nieder ML, Weiner MA, Wells RJ, Womer RB, Meyers PA. Addition of muramyl tripeptide to chemotherapy for patients with newly diagnosed metastatic osteosarcoma: a report from the Children's Oncology Group. Cancer. 2009;115:5339–5348. doi: 10.1002/cncr.24566. [DOI] [PMC free article] [PubMed] [Google Scholar]
- 14.Anderson P, Meyers P, Kleinerman E, Oliva C, Liu Y. Mifamurtide (L-MTP-PE) for metastatic and recurrent osteosarcoma (OS): survival and safety profile from a patient access study. Ann Oncol. 2012;23(Suppl. 9):ix488. [Google Scholar]
- 15.Anderson PM, Meyers P, Kleinerman E, Venkatakrishnan K, Hughes DP, Herzog C, Huh W, Sutphin R, Vyas YM, Shen V, Warwick A, Yeager N, Oliva C, Wang B, Liu Y, Chou A. Mifamurtide in metastatic and recurrent osteosarcoma: A patient access study with pharmacokinetic, pharmacodynamic, and safety assessments. Pediatr Blood Cancer. 2013 doi: 10.1002/pbc.24686. Aug 31. doi: 10.1002/pbc.24686. [Epub ahead of print] [DOI] [PMC free article] [PubMed] [Google Scholar]
- 16.Child CG, Turcotte JG. Surgery and portal hypertension. Major Probl Clin Surg. 1964;1:1–85. [PubMed] [Google Scholar]
- 17.Pugh RN, Murray-Lyon IM, Dawson JL, Pietroni MC, Williams R. Transection of the oesophagus for bleeding oesophageal varices. Br J Surg. 1973;60:646–649. doi: 10.1002/bjs.1800600817. [DOI] [PubMed] [Google Scholar]
- 18.Cockcroft DW, Gault MH. Prediction of creatinine clearance from serum creatinine. Nephron. 1976;16:31–41. doi: 10.1159/000180580. [DOI] [PubMed] [Google Scholar]
- 19.Bode JG, Albrecht U, Haussinger D, Heinrich PC, Schaper F. Hepatic acute phase proteins–regulation by IL-6- and IL-1-type cytokines involving STAT3 and its crosstalk with NF-kappaB-dependent signaling. Eur J Cell Biol. 2012;91:496–505. doi: 10.1016/j.ejcb.2011.09.008. [DOI] [PubMed] [Google Scholar]
- 20.Landmann R, Obrist R, Denz H, Ludwig C, Frost H, Wesp M, Rordorf C, Towbin H, Gygax D, Tarcsay L. Pharmacokinetics and immunomodulatory effects on monocytes during prolonged therapy with liposomal muramyltripeptide. Biotherapy. 1993;7:1–12. doi: 10.1007/BF01878149. [DOI] [PubMed] [Google Scholar]
- 21.Rahman SH, Evans J, Toogood GJ, Lodge PA, Prasad KR. Prognostic utility of postoperative C-reactive protein for posthepatectomy liver failure. Arch Surg. 2008;143:247–253. doi: 10.1001/archsurg.2007.75. [DOI] [PubMed] [Google Scholar]