Background: The in vivo role of GILZ, a glucocorticoid-indicible protein, in bone acquisition is unknown.
Results: Overexpression of GILZ in osteoprogenitor cells increases bone acquisition in mice.
Conclusion: GILZ enhances bone acquisition by promoting marrow mesenchymal stem/progenitor cell osteogenic differentiation.
Significance: GILZ may represent the first GC-responsive gene mediating the positive effect of GCs in bone.
Keywords: Arthritis, Glucocorticoid, Inflammation, Osteoblast, Osteoporosis
Abstract
Glucocorticoids (GCs) have both anabolic and catabolic effects on bone. However, no GC anabolic effect mediator has been identified to date. Here we show that targeted expression of glucocorticoid-induced leucine zipper (GILZ), a GC anti-inflammatory effect mediator, enhances bone acquisition in mice. Transgenic mice, in which the expression of GILZ is under the control of a 3.6-kb rat type I collagen promoter, exhibited a high bone mass phenotype with significantly increased bone formation rate and osteoblast numbers. The increased osteoblast activity correlates with enhanced osteogenic differentiation and decreased adipogenic differentiation of bone marrow stromal cell cultures in vitro. In line with these changes, the mRNA levels of key osteogenic regulators (Runx2 and Osx) increased, and the level of adipogenic regulator peroxisome proliferator-activated receptor (PPAR) γ2 decreased significantly. We also found that GILZ physically interacts with C/EBPs and disrupts C/EBP-mediated PPARγ gene transcription. In conclusion, our results showed that GILZ is capable of increasing bone acquisition in vivo, and this action is mediated via a mechanism involving the inhibition of PPARγ gene transcription and shifting of bone marrow MSC/progenitor cell lineage commitment in favor of the osteoblast pathway.
Introduction
Pharmacological dosages of glucocorticoids (GCs)2 cause bone loss resulting in osteoporosis (1, 2). In contrast, physiological concentrations (endogenous) of GC are anabolic and required for normal osteoblast differentiation and bone acquisition. For example, patients with Addison disease, a rare endocrine disorder in which the adrenal glands do not produce sufficient steroid hormones, have decreased bone mineral density (BMD) and increased blood calcium levels (3), and treatment of these patients with low dosages of GC did not cause bone loss (4). Several animal studies also showed that blockade of endogenous GC signaling in bone by transgenic overexpression of corticosteroid 11β-hydroxysteroid dehydrogenase 2 (11β-HSD2), an enzyme that converts the active form of glucocorticoid cortisol to the inactive cortisone, impairs normal osteoblast differentiation and bone acquisition (5–7). Using a bone-specific glucocorticoid receptor (GR) KO mouse model (Runx2-Cre:GRf/f), Rauch et al. (8) showed that GCs were unable to induce bone loss or inhibit bone formation in these GR KO mice because the GR-deficient osteoblasts become refractory to GC-induced apoptosis, inhibition of proliferation, and differentiation. However, the GR KO mice have decreased baseline bone mass, confirming that the physiological concentration of GC is required for normal bone formation.
We have found previously that overexpression of glucocorticoid-induced leucine zipper (GILZ) (9, 10), known as a GC anti-inflammatory effect mediator (11–13), can enhance osteogenic differentiation of bone marrow mesenchymal stem cells (MSCs) in vitro (14). We also found that overexpression of GILZ can antagonize the inhibitory effect of TNF-α on MSC osteogenic differentiation in vitro (15). However, it is not known whether or not GILZ is capable of enhancing bone formation in vivo and therefore could serve as an endogenous GC anabolic effect mediator. To address this question, we generated transgenic mice in which the expression of GILZ is restricted specifically in bone tissues and report here the bone phenotype of these mice and a possible mechanism by which it does so.
EXPERIMENTAL PROCEDURES
Chemicals
All chemicals were purchased from Fisher Scientific or Sigma-Aldrich except where specified. GILZ polyclonal antibody was custom-made and has been described previously (16).
Generation of GILZ Transgenic Mice
DNA construct used to produce transgenic mice (Col3.6-GILZ-HA) was generated by replacing 11β-HSD2 coding sequence in the Col3.6-HSD2 construct (17) with a PCR-amplified GILZ-HA sequence after releasing 11β-HSD2 with XhoI digestion (see Fig. 1A). A SalI restriction site was included in both forward and reverse primers when the GILZ-HA fragment was amplified from a pcDNA-GILZ-HA expression vector. The PCR product was digested with SalI and ligated to the vector at XhoI site, which is compatible with SalI. An ∼4.5-kb fragment containing the 3.6-kb Col promoter, GILZ-HA, and bGH PA was then excised from the Col3.6-GILZ-HA construct by ClaI digestion, and the purified DNA fragment was sent to the Transgenic Mouse Facility at the University of California Irvine for GILZ transgenic mouse production. Transgenic founder mice were developed on a C57BL/6 background and bred to wild-type C57BL/6 mice. Mice were kept in the Laboratory Animal Service facility at the Georgia Regents University under a 12-h dark/light cycle, constant temperature (22 ± 2 °C), and food and water ad libitum.
FIGURE 1.
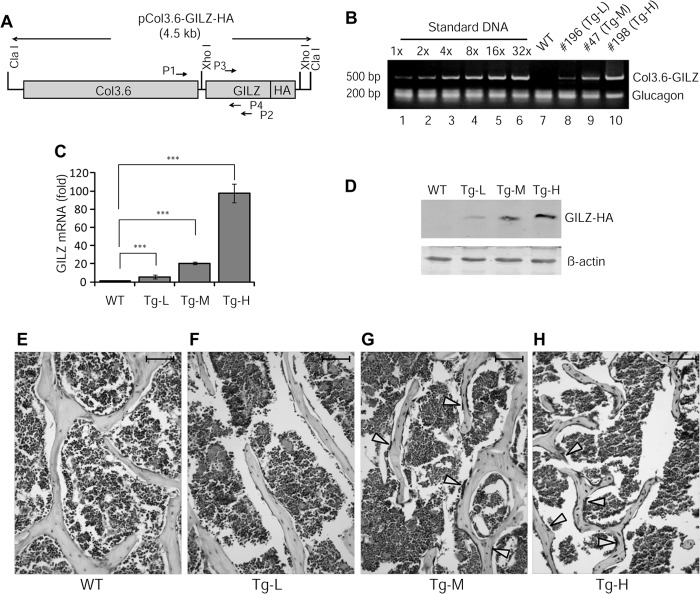
Characterization of GILZ transgenic mice. A, schematic diagram showing the DNA construct used for generation of GILZ transgenic mice. Approximate locations of primer pairs used for genotyping (P1 and P2) and qRT-PCR (P3 and P4) are indicated. The expected sizes of PCR products are 500 and 216 bp, respectively. B, genotyping and copy number estimation. Tail genomic DNAs from a WT and three transgenic founders (nos. 196, 47, and 198) were analyzed by PCR. A serial diluted Col3.6-GILZ-HA plasmid DNA containing indicated copies of plasmid was mixed with tail genomic DNA from a WT mouse and used as copy number reference. Glucagon was used as an internal control for equal loading of genomic DNA from the transgenic mice. C and D, real time qRT-PCR and Western blot analysis of GILZ mRNA (C) and protein (D) expression in bone tissues. E–H, immunohistochemical staining of paraffin-embedded bone sections showing the expression of GILZ in bone tissues. The arrows indicate strong GILZ-positive osteoblast-like cells lining on the surface of bone. The scale bars represent 100 μm. Original magnification, ×200 (E–H).
Genotyping and Transgene Copy Number Determination
Genotyping were performed by PCR using tail genomic DNA and primers located at the 3′-end of the introduced Col promoter sequence (forward, 5′-CAGACGGGAGTTTCACCT C-3′) and a region in the middle of the GILZ coding sequence (reverse, 5′-GCTCACGAATCTGCTCCTTT-3′). The expected size of the PCR product is ∼500 bp. Three independent lines were obtained. Relative copies of GILZ transgene in each line were estimated by PCR using genomic DNA. A serially diluted plasmid DNA containing different copies of Col3.6-GILZ-HA plasmid (equivalent to 1, 2, 4, 8, 16, and 32 copies) was mixed with genomic DNA from a WT mouse and used as reference for transgene copy numbers. Glucogen was used as an internal reference for equal amounts of transgenic genomic DNA template. Primers for glucogen are: 5′-AACATTGCCAAACGTCATGATG-3′ (forward) and 5′-GCCTTCCTCGGCCTTTCA-3′ (reverse).
DXA and μ-CT Analyses
Mice were sacrificed by CO2 overdose following institutional animal care and use committee-approved procedures. The left femur of each mouse was dissected free of soft tissues and fixed in 4% paraformaldehyde-PBS buffer (pH 7.4) at 4 °C overnight. DXA densitometry (Lunar PIXImus II mouse densitometer; GE Medical Systems) was used as an initial assessment for BMD and bone mineral content (BMC), and μ-CT scan (μ-CT-40; Scanco Medical AG) was used to evaluate the bone structural parameters as previously described (18).
Histology and Histomorphometry Analyses
Left femurs of male mice were decalcified in EDTA, embedded in paraffin, and sectioned at 4–6 μm for histomorphometry. Sections were stained with hematoxylin and eosin for calculation of osteoblast number as a fraction of bone perimeter (N.Ob/B.pm) and osteoblast surface per bone surface (Ob.S/BS). Tartrate-resistant acid phosphatase (TRAP) staining (Sigma-Aldrich, catalog no. 378A-1KT) was performed using decalcified tibiae samples to calculate osteoclast number as a fraction of bone perimeter (N.Oc/B.Pm) and osteoclast surface per bone surface (Oc.S/BS).
Calcein Double-labeling
Calcein (10 mg/kg) was injected intraperitoneally into 3-month-old mice (males) at 14 and 4 days prior to sacrifice. Right femurs were fixed in 70% ethanol, dehydrated, and embedded in methyl methacrylate. Plastic blocks were sectioned at 50 μm using a Leitz Polycut S microtome. The sections were imaged with a Zeiss HBO 100 fluorescent microscope. Mineral apposition rate (microns/day) was determined by measuring the linear distance between the two labels and then dividing the mean width of the double labels by the time interval between the two labels (10 days). The bone formation rate was determined by total labeled surface (in mm2) × mineral apposition rate.
In Vitro Monocyte/Macrophage Precursor Cell (BMM) and Osteoclast (OC) Culture
Mouse BMMs and OCs were generated as described (19). In brief, 5 × 10⁴ BMMs isolated from long bones of 3-month-old WT and GILZ Tg mice were incubated with OC differentiation medium containing 10 ng/ml recombinant M-CSF and 100 ng/ml recombinant RANKL. Mature OCs were subjected to TRAP staining at day 4 or 5 after RANKL treatment to confirm their OC identity.
Real Time qRT-PCR Analysis
Total cellular RNA isolation and real time qRT-PCR analysis were performed as previously described (14). PCRs were performed in triplicate, and the levels of mRNA expression were calculated using a relative expression software tool (20). β-Actin was used as an reference gene, and the results were presented as relative expression of target genes in Tg over WT controls. The primer sequences used in qRT-PCRs are: GILZ, 5′-GCTGCACAATTTCTCCACCT-3′ (forward) and 5′-CTCACGAATCTGCTCC TTT-3′ (reverse); and PPARγ, 5′-TTTTCCGAAGAACCATCCGAT-3′ (forward) and 5′-ACAAATGGTGATTTGTCCGTT-3′ (reverse). The primer sequences for Runx2, Osx, and β-actin were previously described (15).
Bone Protein Extraction and Western Blotting
Bone protein was extracted using TRIzol reagent with a procedure described by Rutter et al. (21). For Western blot, equal amounts of bone protein were separated on 12% SDS-PAGE. Expression of GILZ was detected using rabbit anti-mouse GILZ polyclonal antibody as described previously (16).
Immunohistochemistry
Paraffin sections of decalcified bone tissue were deparaffinized in xylene and rehydrated with ethanol. Antigen retrieval was performed by incubating slides in 97 °C citrate buffer for 30 min followed by three washes with PBS. The slides were then incubated in 10% goat serum to block nonspecific proteins and 3% H2O2 to quench endogenous peroxidase before incubating with GILZ antibody. The slides were incubated with a biotinylated secondary antibody and then stained with diaminobenzidine chromogen and counterstained with hematoxylin.
Colony-forming Unit (CFU) Assays
CFU-fibroblast (CFU-F), CFU-osteoblast (CFU-Ob.), and CFU-adipocyte (CFU-Ad) assays were performed as previously described (22).
Co-immunoprecipitation, GST Pulldown, DNA Pulldown, and EMSA
Transfection and co-immunoprecipitation, bacterial expression and purification of GST-C/EBPs and His-GILZ protein, and EMSA were performed as previously described (16, 23, 24), except that an infrared dye (IRDyeTM 700 phosphoramidites)-labeled DNA probe, instead of a radiolabeled probe, was used in EMSAs. The DNA probe (30 bp) contains the tandem repeat C/EBP-binding site (underlined) corresponding to nucleotides −316 to −346 within the PPARγ promoter (5′-TTTACTGCAATTTTAAAAAGCAATCAATAT-3′). This fragment has been well characterized, and it binds both C/EBPs and GILZ (16, 23). Purified GST protein was used as a negative control to demonstrate that the binding of GST-C/EBPs is not caused by fusion of C/EBPs with GST protein.
Study Approval
All animal procedures were performed in accordance to protocols approved by the Institutional Animal Care and Use Committee at the Georgia Regents University.
Statistical Analyses
The results are expressed as means ± S.D. The data were analyzed using either analysis of variance with Bonferroni post hoc testing or unpaired t tests, using Instat software (GraphPad Inc.). A p value less than 0.05 was considered significant.
RESULTS
Generation and Characterization of GILZ Transgenic Mice
Three independent GILZ Tg lines, each carrying a GILZ-HA fusion construct downstream of Col3.6 promoter (Fig. 1A), were obtained on a C57BL/6 background. Genotyping results indicated that each line contains varying copies of GILZ transgene (Fig. 1B) and is herein named as Tg-L (no. 196, ∼1–2 copies), Tg-M (no. 47, ∼4–8 copies), and Tg-H (no. 198, ∼32 copies) for low, middle, and high copies, respectively. The expression of mRNA and protein from GILZ transgene was confirmed by qRT-PCR and Western blot analyses (Fig. 1, C and D), respectively, using RNA and protein samples extracted from bone tissues, and by immunohistochemical staining of bone sections (Fig. 1, E–H). Among these three lines, Tg-M expressed GILZ transgene at a level comparable to that normally seen in cultured bone marrow MSCs induced by dexamethasone (100 nm for 6 h) (14). The expression level of GILZ transgene in Tg-L was too low, and in Tg-H it was too high, which may not be physiologically relevant. In addition, for unknown reasons the Tg-H line consistently produced small litter size (three to five pups), and nearly half of them exhibited significantly reduced body size and low body weight (40–50% of that WT littermates at 5 weeks of age). The Tg-L and Tg-M mice showed no signs of abnormalities in body size, body weight, liter size, sex ratio, or gross anatomy. Initial assessment by DXA showed no significant differences between Tg-L and WT in BMD and BMC (data not shown). Therefore, we focused our efforts on Tg-M line in this study and refer to this line as GILZ Tg hereafter.
Bone Mineral Density, Content, and Bone Volume Increased in GILZ Tg Mice
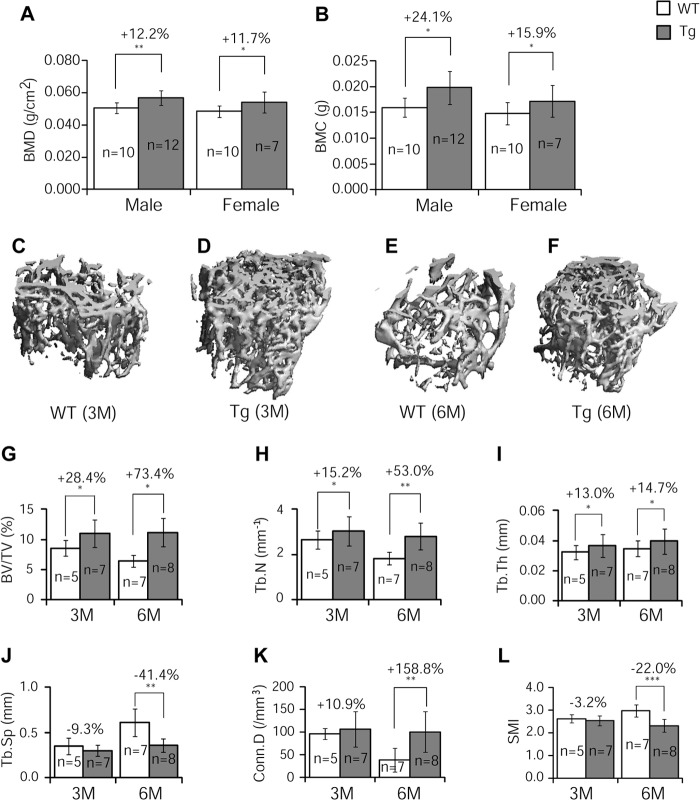
As an initial assessment of GILZ function in bone, we performed densitometry analysis (GE Lunar PIXImus system) of femurs from 3-month-old mice. The results show that BMD (Fig. 2A) and BMC (Fig. 2B) were increased significantly in both male (BMD, 12%; BMC, 24%; p < 0.05) and female (BMD, 12%; BMC, 16%; p < 0.05) Tg mice compared with their littermate controls. μ-CT analysis of femoral samples of male mice showed that the integrity of trabecular bone is remarkably higher in Tg mice than that in the WT mice, especially at older age (Fig. 2, C–F). Quantitative results showed that at 3 months of age, the femurs of Tg mice had significantly increased bone volume (BV/TV) (Fig. 2G, +28%), trabecular numbers (Tb.N) (Fig. 2H, +15%), and trabecular thickness (Tb.Th) (Fig. 2I, +13%) as compared with WT controls. The trabecular separation (Tb.Sp), connectivity density (Conn. D), and structure model index were not significantly different in Tg versus WT bones at 3 months of age (Fig. 2, J–L). The magnitude of increase in these parameters seems to become more evident in Tg mice as the animals aged. At 6 months, the difference between Tg and control mice increased to 73% in BV/TV (Fig. 2G), 53% in Tb.N (Fig. 2H), and 15% in Tb.Th (Fig. 2I). Also at 6 months, the parameters that showed no changes at 3 months became significantly different; Conn. D was 150% higher (Fig. 2K), and Tb.Sp and structure model index were 41 and 22% lower than the WT mice, respectively (Fig. 2, J and L).
FIGURE 2.
DXA and μ-CT analyses. A and B, left femurs of 3-month-old GILZ Tg and WT littermate control mice were assessed by DXA scan for BMD (A) and BMC (B). C–F, representative three-dimensional reconstructed images of femoral samples from WT and GILZ Tg mice (males) at 3 months (C and D) and 6 months (E and F) of age. G–L, quantitative results showing BV/TV (G), Tb.N (H), Tb.Th (I), Tb.Sp (J), Conn. D (K), and structure model index (SMI, L) at 3 and 6 months of age. The data are shown as means ± S.D. n = 7–12 for DXA and n = 5–8 for μ-CT analysis, respectively. *, p < 0.05; **, p < 0.01; ***, p < 0.001. M, months.
Bone Formation Rate Increased Dramatically in GILZ Tg Mice
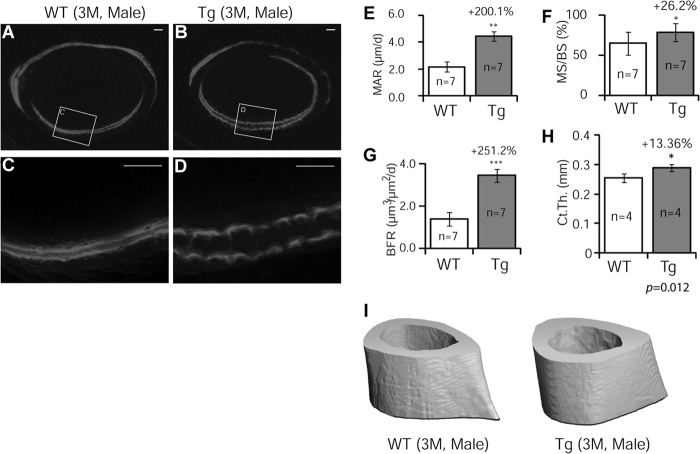
To determine whether bone mass increase in GILZ Tg mice was due to an increase in bone formation, we performed calcein double-labeling experiments using femoral samples of 3-month-old male mice. The results showed that bone formation (2 mm below the proximal end of femurs) was dramatically increased in Tg mice (Fig. 3, A–D); with a 2.0-fold increase in mineral apposition rate (Fig. 3E, MAR), 26% increase in mineralizing surface (Fig. 3F, MS/BS), and a 2.5-fold increase in bone formation rate (Fig. 3G, BFR). The cortical thickness showed a 13% increase (Fig. 3, H and I).
FIGURE 3.
Dynamic analysis of bone formation. Calcein was injected intraperitoneally into 3-month-old male mice 14 and 4 days prior to sacrifice. A–D, representative fluorescent images of plastic-embedded femoral sections of WT and GILZ Tg mice. C and D are enlarged images of boxed areas in A and B, respectively. E–G, quantified results showing mineral apposition rate (MAR, E), mineralizing surface (MS/BS, F), and bone formation rate (BFR, G) of cortical bone. The data are shown as means ± S.D. (n = 7). *, p < 0.05; **, p < 0.01; ***, p < 0.001. The scale bars represent 100 μm. Original magnification, ×40 (A and B). H and I, quantified results showing cortical thickness (H) and represent μ-CT images of midshaft (I). n = 4; p = 0.012.
Increased Bone Formation Resulted from Increased Numbers of Osteoblasts in GILZ Tg Mice
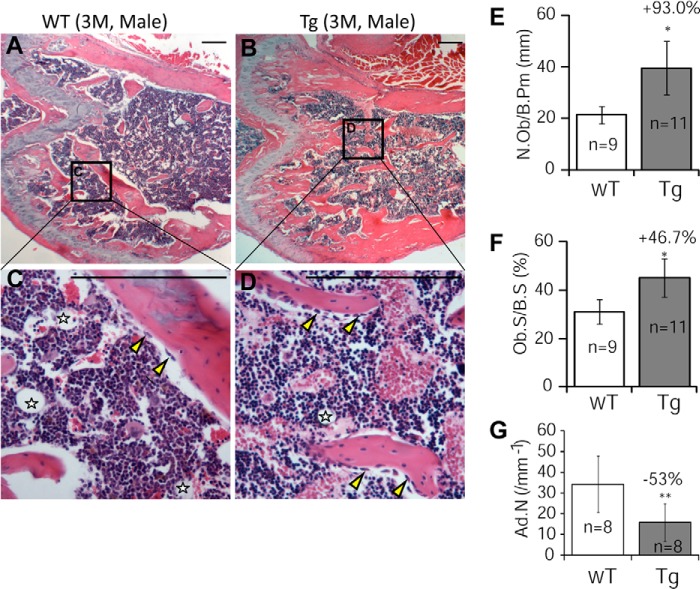
Histology and histomorphometry studies of decalcified bone sections showed that GILZ Tg mice had significantly increased trabecular bones (Fig. 4, A–D) and remarkably increased numbers of osteoblasts (N.Ob/B.Pm) (Fig. 4E, +93.0%) and osteoblast surface (Ob.S/BS) (Fig. 4F, +46.7%). A significant reduction in the numbers of marrow adipocytes in Tg mice was also evident (indicated by stars in Fig. 4 (C and D), and quantified result in Fig. 4G).
FIGURE 4.
Histological and histomorphometric analyses of femurs in 3-month-old male GILZ Tg and WT mice. A–D, representative hematoxylin- and eosin-stained femurs from WT (A and C) and GILZ Tg (B and D) mice. C and D are enlarged images of boxed areas in A and B, respectively. Marrow adipocyte is indicated by stars. E–G, bone histomorphometric analysis results showing the numbers of osteoblasts (E), osteoblast surface (F), and the numbers of marrow adipocytes (G). The data are shown as means ± S.D. (n = 9–11). *, p < 0.05; **, p < 0.01. The scale bars represent 100 μm. Original magnification, ×40 (A and B). M, months.
Osteoblastogenesis Increased and Adipogenesis Decreased in Tg Marrow Cell Cultures
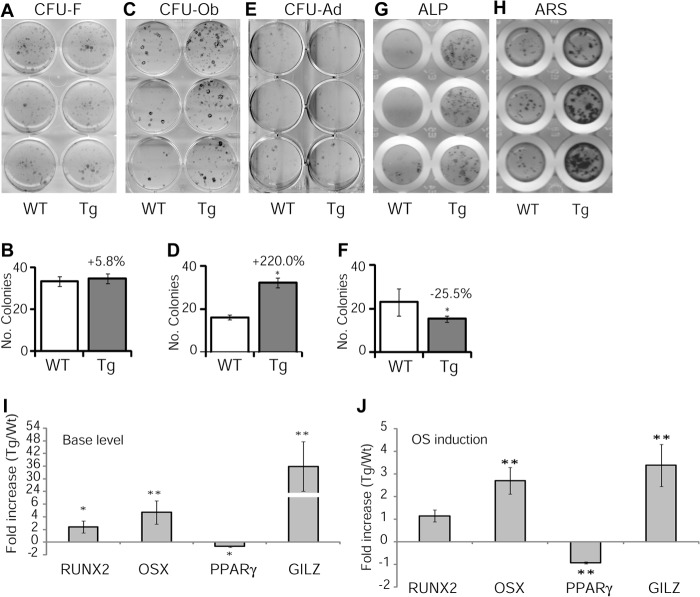
Osteoblasts and marrow adipocytes share a common progenitor cell, and these two pathways have a reciprocal relationship. To determine whether increased osteoblasts and bone acquisition in Tg mice were due to a shift of marrow MSC lineage commitment, we performed CFU assays. Aliquots of single-cell bone marrow aspirates were seeded in 6-well plates and either cultured in regular growth media (DMEM) or induced with osteogenic or adipogenic induction media. At the indicated time points, cells were fixed and stained with Giemsa (CFU-F), Oil-red O (CFU-Ad), or incubated with alkaline phosphatase substrates (CFU-Ob). No significant difference was detected in the numbers of CFU-F colonies between Tg and WT mice (Fig. 5, A and B), indicating that normal stem/progenitor cell function was not affected. However, a significant increase in the numbers of CFU-Ob (Fig. 5, C and D) and a decrease in the numbers of CFU-Ad colonies (Fig. 5, E and F) were detected in Tg marrow cell cultures. In line with the CFU-Ob data, separate osteogenic induction experiments with a higher initial cell seeding density confirmed a pro-osteogenic activity of GILZ (Fig. 5, G and H). To confirm the lineage preferential effect of GILZ at gene expression level, we performed real time qRT-PCR analysis and found that the basal levels of key osteogenic regulators Runx2 and Osx mRNA increased 2.4- and 4.7-fold (Fig. 5I), respectively, and the master adipogenic regulator PPARγ2 decreased by 67.5% in Tg cells (Fig. 5I). Following 6 days of osteogenic induction, the mRNA levels of Osx increased 1.2-fold, and PPARγ2 decreased by 92% in Tg cells. Interestingly, no significant increase of Runx2 mRNA was detected between Tg and WT cells under this condition (Fig. 5J), possibly because of the maximal expression of wild-type cells in osteogenic conditions even in the absence of GILZ overexpression. The mRNA levels of GILZ in WT and Tg cells before and after osteogenic induction were also examined, and as expected, the levels of GILZ were significantly higher in Tg cells at base (Fig. 5I) and osteogenic induction conditions (Fig. 5J). Together, these results demonstrated that transgenic expression of GILZ in bone altered bone marrow mesenchymal stem/progenitor cell lineage commitment favoring an osteogenic, rather than adipogenic, differentiation pathway.
FIGURE 5.
In vitro bone marrow cell culture and gene expression. A–F, CFU assays. Whole bone marrow cells (each well represents cells from one individual mouse) were cultured in either regular growth media DMEM or in osteogenic or adipogenic induction media. On day 14, cells were fixed and stained with Giemsa for CFU-f (A and B) or with alkaline phosphatase (ALP) substrate (NBT/BCIP) for CFU-Ob (C and D). CFU-Ad assay was performed with a higher cell seeding density (1 × 10⁶ cells/well of 6-well plate). After 2 days of induction, the cells were switched to maintenance media and stained with Oil red O (E and F) on days 10–15 when lipid-filled adipocytes appeared. To further confirm CFU-ob results, osteogenic differentiation experiments were also performed in 96-well plates with a higher initial seeding density and induced for 6 (G) and 21 days (H), respectively, to visualized alkaline phosphatase-positive cells and mineralized bone nodules (ARS stain). I and J, real time qRT-PCR analysis of key genes controlling MSC lineage commitment in cultured bone marrow cells. Whole bone marrow cells from GILZ Tg and WT mice were cultured for 6 days with or without osteogenic induction and analyzed for the expression of Runx2, Osx, and PPARγ2. Expression levels of GILZ mRNA were also examined. The data were calculated using the relative expression software tool and presented as relative expression of target gene in Tg samples over WT control samples. *, p < 0.05; **, p < 0.001.
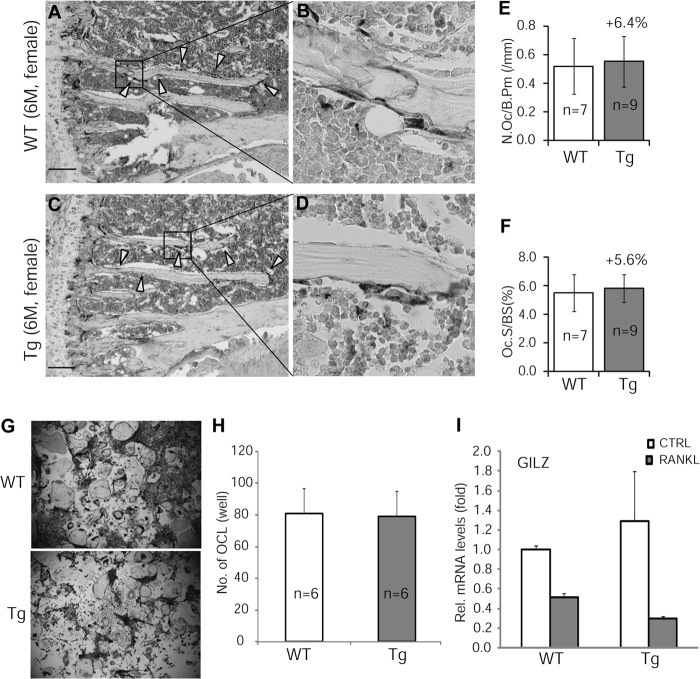
To determine whether GILZ-mediated increase in bone acquisition was accompanied by an increase in bone turnover, we examined osteoclastogenesis both in vivo, using decalcified tibia samples, and in vitro, using BMMs. TRAP stain experiment showed that neither the numbers of osteoclasts (N.Oc/B.Pm) nor the osteoclast surfaces (N.Oc/BS) were different between GILZ Tg and WT bone samples (Fig. 6, A–F). In vitro osteoclast differentiation assay confirmed that receptor activator of nuclear factor κB ligand (RANKL)-induced osteoclastogenesis was not altered in BMMs of Tg mice (Fig. 6, G and H). These results indicated that overexpression of GILZ in MSC/osteoprogenitor cells did not have an effect on osteoclastic activity. This conclusion is in line with the fact that the GILZ transgene is not expressed in BMMs of Tg mice (Fig. 6I).
FIGURE 6.
TRAP stain of osteoclasts. A–D, representative images of TRAP-stained tibiae from 3-month-old GILZ Tg and WT mice. C and D are enlarged images of boxed areas in A and B, respectively. E and F, quantitative results showing the numbers and surface of osteoclasts. G, TRAP stain showing in vitro osteoclast differentiation of BMMs isolated from 3-month-old GILZ Tg and WT mice. H, quantitative results showing the average numbers of osteoclasts in G. I, real time qRT-PCR showing relative levels of GILZ mRNA in BMMs treated with or without RANKL. The data are shown as means ± S.D. The scale bars represent 100 mm. M, months; CTRL, control.
GILZ Disrupts C/EBP-mediated PPARγ Gene Transcription
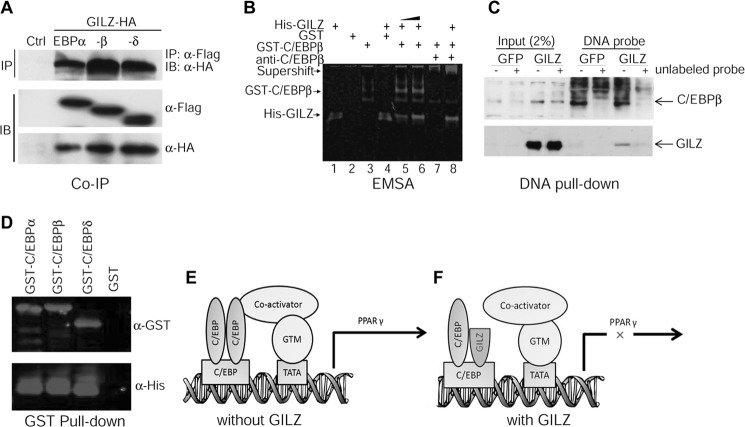
PPARγ is a key factor controlling bone marrow MSC osteogenic and adipogenic lineage commitment. We showed previously that GILZ binds specifically to a tandem repeat C/EBP-binding site in the promoter region of the PPARγ gene and represses its transcription (16). To investigate the molecular mechanism by which GILZ inhibits PPARγ gene transcription, we examined protein-protein and protein-DNA interactions between GILZ and C/EBPs in the PPARγ promoter region using co-immunoprecipitation and EMSA. HA-tagged GILZ and Flag-tagged C/EBP expression vectors were cotransfected into 293T cells. 48 h after transfection, cells were harvested, and whole cell lysates were immunoprecipitated with anti-Flag monoclonal antibody, separated by SDS gel, and then detected with anti-HA antibody in Western blot. The results showed that HA-tagged GILZ co-precipitates with Flag-tagged C/EBPα, -β, and -δ (Fig. 7A). The same results were obtained when the experiment was performed in a reverse order, i.e. immunoprecipitate with anti-HA antibody and detect with anti-Flag antibody (not shown). The expression of Flag-C/EBPs and HA-GILZ from the transfected plasmids is shown by Western blot using anti-Flag and anti-HA antibodies, respectively. Because C/EBPs transcriptionally activate (23, 25–27), and GILZ inhibits (16), PPARγ transcription via binding to the same DNA element in the PPARγ promoter, we hypothesized that GILZ represses PPARγ gene transcription by inhibiting the binding of C/EBPs to the PPARγ promoter or by disrupting C/EBP transactivation functions. To test these hypotheses, we performed EMSA using affinity-purified GST-C/EBPβ, His-GILZ, and a 30-bp DNA probe containing the tandem repeat C/EBP-binding site corresponding to nucleotides −316 to −346 within the PPARγ promoter. The results showed that GILZ did not disrupt C/EBPβ DNA binding activity; instead, by forming a GILZ-C/EBP-DNA tertiary complex, it enhanced or stabilized C/EBPβ DNA binding activity (Fig. 7B, compare lanes 5 and 6 with lane 3, GST-C/EBPβ alone), and this protein complex can be supershifted by anti-C/EBPβ antibody (Fig. 7B, lanes 7 and 8). Lane 1 contains His-GILZ only; lane 2 contains GST protein only (control); lane 3 contains GST-C/EBPβ only; and lane 4 contains His-GILZ plus GST protein. These interactions were confirmed by DNA pulldown assay using biotin-labeled DNA probe and cell lysates from GILZ (or GFP)-expressing MSCs in the presence or absence of 60× excess of unlabeled DNA probe as competitors (Fig. 7C) and by GST pulldown assay using purified GST-C/EBP and His-tagged GILZ proteins (Fig. 7D). Based on these, as well as our previous studies showing that GILZ inhibits C/EBP-mediated PPARγ gene transcription (16), we propose that binding of GILZ-C/EBP complex to the PPARγ promoter interferes the transactivation function of C/EBPs, possibly by blocking the physical interactions between C/EBPs and co-activators assembled in the PPARγ gene promoter region or altering the conformation of the general transcriptional machinery (Fig. 7, E and F).
FIGURE 7.
GILZ interacts with C/EBPs. A, co-immunoprecipitation assay. 293T cells were cotransfected with HA-GILZ and Flag-C/EBPα, -β, or -δ. Whole cell lysates were immunoprecipitated with anti-Flag and detected with anti-HA antibody to show co-precipitated GILZ protein. The expression of C/EBPs and GILZ in transfected cells is shown by Western blots using anti-Flag antibody and anti-HA antibody, respectively. B, EMSA. Affinity-purified GST-C/EBPβ and His-GILZ protein was incubated with a 30-bp IRDye-labeled DNA probe containing tandem repeat C/EBP binding site either alone (lanes 1 and 3) or together (lanes 5, 6, and 8). The DNA-protein complex was resolved in native polyacrylamide gel and imaged using an Odyssey Infrared Imaging System. Lane 1 contains 8 μg of His-GILZ, lane 2 contains 8 μg of GST, lane 3 contains 0.5 μg of GST-C/EBPβ, lane 4 contains 8 μg of GST plus 8 μg of His-GILZ, lanes 5–8 contain 0.5 μg of GST-C/EBPβ plus His-GILZ (8 and 12 μg in lanes 5 and 6, respectively). Lane 7 contains 0.5 μg of GST-C/EBPβ and 2 μl of anti-C/EBPβ antibody. Lane 8, contains the same as lane 7 plus 8 μg of His-GILZ. C, DNA pulldown assay showing interactions between GILZ, C/EBPβ, and PPARγ promoter. Cell lysates harvested from GILZ- and GFP-expressing MSCs were incubated with biotin-labeled DNA probe mentioned above, and the protein-DNA complex was purified with magnetic beads conjugated to avidin. The complex was separated on SDS-PAGE, transferred onto membrane, and then detected with antibodies against C/EBPβ or GILZ. The specificity of protein-DNA interaction was confirmed by adding 60× excess of unlabeled DNA probe as indicated. D, GST pulldown assay showing interaction between GILZ and C/EBPs. Purified GST-C/EBPs were immobilized on glutathione-Sepharose beads and then incubated with His-tagged GILZ; after several washes, the bound proteins were eluted by boiling in sample buffer, separated by SDS-PAGE, and detected with anti-GST or anti-His antibodies. E and F, working model illustrating how GILZ may inhibit C/EBP-mediated PPARγ gene transcription. In the absence of GILZ (E), dimerized C/EBPs bind to C/EBP-binding sites and associate with co-activators such as PGC-1 and initiate transcription. However, in the presence of GILZ (F), the association of C/EBPs with co-activators and general transcription machinery (GTM) is disrupted, thus C/EBP-mediated PPARγ gene transcription is inhibited. IB, immunoblot; IP, immunoprecipitation;
DISCUSSION
The catabolic bone effects of therapeutic GCs are well known, but the anabolic aspects of endogenous GCs are not clear. In this study, we provide evidence that transgenic overexpression of GILZ in bone tissue can enhance bone acquisition in mice, and this effect is mediated by GILZ through modulating bone marrow MSC lineage commitment, favoring osteogenic pathway. The osteoblast and adipocyte are two dominant pathways that bone marrow MSCs differentiate, and these two pathways have a reciprocal relationship. C/EBPs are a family of transcription activators that bind to PPARγ gene promoter and activate its transcription (23, 25–27). We showed previously that, in vitro, overexpression of GILZ can inhibit PPARγ expression (16) and enhance MSC osteogenic differentiation (14). Our new finding reveals that GILZ interacts with C/EBPs and disrupts their transcriptional functions (Fig. 7). These results thus indicate that GILZ may play a role in mediating GC bone anabolic effect and explain how GILZ enhances bone acquisition. To this point, one may ask whether GILZ is anabolic and then why this effect is not seen and the outcome of GC therapy is always a net bone loss? We hypothesize that the GILZ effect is superseded by GR with continued GC exposure because GILZ is a circadian gene (28), and its expression increases sharply upon GC exposure and then declines after reaching peak level (14, 16). However, GR is activated constantly in the presence of GC, and evidence has shown that GR is directly responsible for GC-induced bone loss in mice (8). In addition, the activated GR binds directly to the negative GC response elements in the promoter region of the osteocalcin (Ocn) gene and inhibits its transcription (29, 30). Ocn is an osteoblast-specific gene and plays an important role in bone mineralization. GR also transcriptionally activates the expression of MAP kinase phosphatase-1 (31). MAP kinase phosphatase-1 inactivates MAP kinase and thus inhibits osteogenic differentiation (32, 33). Furthermore, GR can physically interact with and inhibit the transcriptional functions of Smad3 (34), an intracellular signaling mediator of TGF-β that stimulates osteoprogenitor cell proliferation (35) and attract osteoprogenitor cells to the remodeling sites during bone remodeling (36). This evidence, together with our current in vivo and previous in vitro studies (13–15), as well as the fact that GILZ is a GC anti-inflammatory effect mediator (37, 38), led us to propose that GILZ has therapeutic potential for the development of new anti-inflammatory therapies that can potentially separate the desired anti-inflammatory and immune suppressive effects of GCs from their harmful side effects on bone. Although sounds very exciting, there are more questions that need to be addressed to further confirm that GILZ, indeed, mediates GC anabolic actions because GILZ can also interact with, in addition to C/EBPs, NF-κB (11) and AP-1 (12), the two important transcription factors that regulates a spectrum of cell functions including proliferation, differentiation, and apoptosis.
This work was supported, in whole or in part, by National Institutes of Health Grants R01DK76045, R01AG046248, and P01AG036675.
- GC
- glucocorticoid
- GILZ
- glucocorticoid-induced leucine zipper
- Tg
- transgenic
- BMD
- bone mineral density
- GR
- glucocorticoid receptor
- MSC
- mesenchymal stem cells
- DXA
- dual-energy x-ray absorptiometry
- BMC
- bone mineral content
- TRAP
- tartrate-resistant acid phosphatase
- BMM
- bone marrow monocyte/macrophage precursor cells
- OC
- osteoclast
- qRT-PCR
- quantitative RT-PCR
- CFU
- colony-forming unit
- C/EBP
- CCAAT enhancer-binding protein
- PPAR
- peroxisome proliferator-activated receptor
- μ-CT
- microcomputed tomography.
REFERENCES
- 1. Nishimura J., Ikuyama S. (2000) Glucocorticoid-induced osteoporosis: pathogenesis and management. J. Bone Miner. Metab. 18, 350–352 [DOI] [PubMed] [Google Scholar]
- 2. Clowes J. A., Peel N., Eastell R. (2001) Glucocorticoid-induced osteoporosis. Curr. Opin. Rheumatol. 13, 326–332 [DOI] [PubMed] [Google Scholar]
- 3. Soule S. (1999) Addison's disease in Africa: a teaching hospital experience. Clin. Endocrinol. (Oxf.) 50, 115–120 [DOI] [PubMed] [Google Scholar]
- 4. Valero M. A., Leon M., Ruiz Valdepeñas M. P., Larrodera L., Lopez M. B., Papapietro K., Jara A., Hawkins F. (1994) Bone density and turnover in Addison's disease: effect of glucocorticoid treatment. Bone Miner. 26, 9–17 [DOI] [PubMed] [Google Scholar]
- 5. Sher L. B., Woitge H. W., Adams D. J., Gronowicz G. A., Krozowski Z., Harrison J. R., Kream B. E. (2004) Transgenic expression of 11β-hydroxysteroid dehydrogenase type 2 in osteoblasts reveals an anabolic role for endogenous glucocorticoids in bone. Endocrinology 145, 922–929 [DOI] [PubMed] [Google Scholar]
- 6. Sher L. B., Harrison J. R., Adams D. J., Kream B. E. (2006) Impaired cortical bone acquisition and osteoblast differentiation in mice with osteoblast-targeted disruption of glucocorticoid signaling. Calcif. Tissue Int 79, 118–125 [DOI] [PubMed] [Google Scholar]
- 7. Yang M., Trettel L. B., Adams D. J., Harrison J. R., Canalis E., Kream B. E. (2010) Col3.6-HSD2 transgenic mice: a glucocorticoid loss-of-function model spanning early and late osteoblast differentiation. Bone 47, 573–582 [DOI] [PMC free article] [PubMed] [Google Scholar]
- 8. Rauch A., Seitz S., Baschant U., Schilling A. F., Illing A., Stride B., Kirilov M., Mandic V., Takacz A., Schmidt-Ullrich R., Ostermay S., Schinke T., Spanbroek R., Zaiss M. M., Angel P. E., Lerner U. H., David J. P., Reichardt H. M., Amling M., Schütz G., Tuckermann J. P. (2010) Glucocorticoids suppress bone formation by attenuating osteoblast differentiation via the monomeric glucocorticoid receptor. Cell Metab. 11, 517–531 [DOI] [PubMed] [Google Scholar]
- 9. D'Adamio F., Zollo O., Moraca R., Ayroldi E., Bruscoli S., Bartoli A., Cannarile L., Migliorati G., Riccardi C. (1997) A new dexamethasone-induced gene of the leucine zipper family protects T lymphocytes from TCR/CD3-activated cell death. Immunity. 7, 803–812 [DOI] [PubMed] [Google Scholar]
- 10. Cannarile L., Zollo O., D'Adamio F., Ayroldi E., Marchetti C., Tabilio A., Bruscoli S., Riccardi C. (2001) Cloning, chromosomal assignment and tissue distribution of human GILZ, a glucocorticoid hormone-induced gene. Cell Death Differ. 8, 201–203 [DOI] [PubMed] [Google Scholar]
- 11. Ayroldi E., Migliorati G., Bruscoli S., Marchetti C., Zollo O., Cannarile L., D'Adamio F., Riccardi C. (2001) Modulation of T-cell activation by the glucocorticoid-induced leucine zipper factor via inhibition of nuclear factor κB. Blood 98, 743–753 [DOI] [PubMed] [Google Scholar]
- 12. Mittelstadt P. R., Ashwell J. D. (2001) Inhibition of AP-1 by the glucocorticoid-inducible protein GILZ. J. Biol. Chem. 276, 29603–29610 [DOI] [PubMed] [Google Scholar]
- 13. Yang N., Zhang W., Shi X. M. (2008) Glucocorticoid-induced leucine zipper (GILZ) mediates glucocorticoid action and inhibits inflammatory cytokine-induced COX-2 expression. J. Cell Biochem. 103, 1760–1771 [DOI] [PubMed] [Google Scholar]
- 14. Zhang W., Yang N., Shi X. M. (2008) Regulation of mesenchymal stem cell osteogenic differentiation by glucocorticoid-induced leucine zipper (GILZ). J. Biol. Chem. 283, 4723–4729 [DOI] [PubMed] [Google Scholar]
- 15. He L., Yang N., Isales C. M., Shi X. M. (2012) Glucocorticoid-induced leucine zipper (GILZ) antagonizes TNF-α inhibition of mesenchymal stem cell osteogenic differentiation. PLoS One 7, e31717. [DOI] [PMC free article] [PubMed] [Google Scholar]
- 16. Shi X., Shi W., Li Q., Song B., Wan M., Bai S., Cao X. (2003) A glucocorticoid-induced leucine-zipper protein, GILZ, inhibits adipogenesis of mesenchymal cells. EMBO Rep. 4, 374–380 [DOI] [PMC free article] [PubMed] [Google Scholar]
- 17. Woitge H., Harrison J., Ivkosic A., Krozowski Z., Kream B. (2001) Cloning and in vitro characterization of α1(I)-collagen 11β-hydroxysteroid dehydrogenase type 2 transgenes as models for osteoblast-selective inactivation of natural glucocorticoids. Endocrinology 142, 1341–1348 [DOI] [PubMed] [Google Scholar]
- 18. Cao J. J., Gregoire B. R., Gao H. (2009) High-fat diet decreases cancellous bone mass but has no effect on cortical bone mass in the tibia in mice. Bone 44, 1097–1104 [DOI] [PubMed] [Google Scholar]
- 19. Xia W.-F., Jung J.-U., Shun C., Xiong S., Xiong L., Shi X.-M., Mei L., Xiong W.-C. (2013) Swedish mutant APP suppresses osteoblast differentiation and causes osteoporotic deficit, which are ameliorated by N-acetyl-l-cysteine. J. Bone Miner. Res. 28, 2122–2135 [DOI] [PMC free article] [PubMed] [Google Scholar]
- 20. Pfaffl M. W., Horgan G. W., Dempfle L. (2002) Relative expression software tool (REST) for group-wise comparison and statistical analysis of relative expression results in real-time PCR. Nucleic Acids Res. 30, e36. [DOI] [PMC free article] [PubMed] [Google Scholar]
- 21. Rutter M. M., Markoff E., Clayton L., Akeno N., Zhao G., Clemens T. L., Chernausek S. D. (2005) Osteoblast-specific expression of insulin-like growth factor-1 in bone of transgenic mice induces insulin-like growth factor binding protein-5. Bone 36, 224–231 [DOI] [PubMed] [Google Scholar]
- 22. Zhang W., Ou G., Hamrick M., Hill W., Borke J., Wenger K., Chutkan N., Yu J., Mi Q. S., Isales C. M., Shi X. M. (2008) Age-related changes in the osteogenic differentiation potential of mouse bone marrow stromal cells. J. Bone Miner. Res. 23, 1118–1128 [DOI] [PMC free article] [PubMed] [Google Scholar]
- 23. Shi X. M., Blair H. C., Yang X., McDonald J. M., Cao X. (2000) Tandem repeat of C/EBP binding sites mediates PPARγ2 gene transcription in glucocorticoid-induced adipocyte differentiation. J. Cell Biochem. 76, 518–527 [DOI] [PubMed] [Google Scholar]
- 24. Shi X., Bai S., Li L., Cao X. (2001) Hoxa-9 represses transforming growth factor-β-induced osteopontin gene transcription. J. Biol. Chem. 276, 850–855 [DOI] [PubMed] [Google Scholar]
- 25. Clarke S. L., Robinson C. E., Gimble J. M. (1997) CAAT/enhancer binding proteins directly modulate transcription from the peroxisome proliferator-activated receptor γ2 promoter. Biochem. Biophys. Res. Commun. 240, 99–103 [DOI] [PubMed] [Google Scholar]
- 26. Elberg G., Gimble J. M., Tsai S. Y. (2000) Modulation of the murine peroxisome proliferator-activated receptor γ2 promoter activity by CCAAT/enhancer-binding proteins. J. Biol. Chem. 275, 27815–27822 [DOI] [PubMed] [Google Scholar]
- 27. Hamm J. K., Park B. H., Farmer S. R. (2001) A role for C/EBPβ in regulating peroxisome proliferator-activated receptor γ activity during adipogenesis in 3T3-L1 preadipocytes. J. Biol. Chem. 276, 18464–18471 [DOI] [PubMed] [Google Scholar]
- 28. Gimble J. M., Ptitsyn A. A., Goh B. C., Hebert T., Yu G., Wu X., Zvonic S., Shi X. M., Floyd Z. E. (2009) Delta sleep-inducing peptide and glucocorticoid-induced leucine zipper: potential links between circadian mechanisms and obesity? Obes. Rev. 10, 46–51 [DOI] [PubMed] [Google Scholar]
- 29. Yao W., Cheng Z., Busse C., Pham A., Nakamura M. C., Lane N. E. (2008) Glucocorticoid excess in mice results in early activation of osteoclastogenesis and adipogenesis and prolonged suppression of osteogenesis: a longitudinal study of gene expression in bone tissue from glucocorticoid-treated mice. Arthritis Rheum. 58, 1674–1686 [DOI] [PMC free article] [PubMed] [Google Scholar]
- 30. Morrison N., Eisman J. (1993) Role of the negative glucocorticoid regulatory element in glucocorticoid repression of the human osteocalcin promoter. J. Bone Miner. Res. 8, 969–975 [DOI] [PubMed] [Google Scholar]
- 31. Kassel O., Sancono A., Krätzschmar J., Kreft B., Stassen M., Cato A. C. (2001) Glucocorticoids inhibit MAP kinase via increased expression and decreased degradation of MKP-1. EMBO J. 20, 7108–7116 [DOI] [PMC free article] [PubMed] [Google Scholar]
- 32. Jaiswal R. K., Jaiswal N., Bruder S. P., Mbalaviele G., Marshak D. R., Pittenger M. F. (2000) Adult human mesenchymal stem cell differentiation to the osteogenic or adipogenic lineage is regulated by mitogen-activated protein kinase. J. Biol. Chem. 275, 9645–9652 [DOI] [PubMed] [Google Scholar]
- 33. Park O. J., Kim H. J., Woo K. M., Baek J. H., Ryoo H. M. (2010) FGF2-activated ERK mitogen-activated protein kinase enhances Runx2 acetylation and stabilization. J. Biol. Chem. 285, 3568–3574 [DOI] [PMC free article] [PubMed] [Google Scholar]
- 34. Song C. Z., Tian X., Gelehrter T. D. (1999) Glucocorticoid receptor inhibits transforming growth factor-β signaling by directly targeting the transcriptional activation function of Smad3. Proc. Natl. Acad. Sci. U.S.A. 96, 11776–11781 [DOI] [PMC free article] [PubMed] [Google Scholar]
- 35. Kassem M., Kveiborg M., Eriksen E. F. (2000) Production and action of transforming growth factor-β in human osteoblast cultures: dependence on cell differentiation and modulation by calcitriol. Eur. J. Clin. Invest. 30, 429–437 [DOI] [PubMed] [Google Scholar]
- 36. Tang Y., Wu X., Lei W., Pang L., Wan C., Shi Z., Zhao L., Nagy T. R., Peng X., Hu J., Feng X., Van Hul W., Wan M., Cao X. (2009) TGF-β1-induced migration of bone mesenchymal stem cells couples bone resorption with formation. Nat. Med. 15, 757–765 [DOI] [PMC free article] [PubMed] [Google Scholar]
- 37. Ayroldi E., Riccardi C. (2009) Glucocorticoid-induced leucine zipper (GILZ): a new important mediator of glucocorticoid action. FASEB J. 23, 3649–3658 [DOI] [PubMed] [Google Scholar]
- 38. Beaulieu E., Ngo D., Santos L., Yang Y. H., Smith M., Jorgensen C., Escriou V., Scherman D., Courties G., Apparailly F., Morand E. F. (2010) Glucocorticoid-induced leucine zipper is an endogenous antiinflammatory mediator in arthritis. Arthritis Rheum. 62, 2651–2661 [DOI] [PubMed] [Google Scholar]


