

Background: Thymosin β4 (Tβ4) promotes differentiation of oligoprogenitor cells (OPCs) to oligodendrocytes in animal models of neurological injury.
Results: Tβ4 increased expression of microRNA-146a and suppressed expression of TLR (Toll-like) proinflammatory cytokines.
Conclusion: Tβ4 suppresses the TLR proinflammatory pathway by up-regulating miR-146a to promote OPC differentiation.
Signficance: Learning how Tβ4 promotes oligodendrogenesis supports its development for clinical studies.
Keywords: Actin, MicroRNA (miRNA), Myelin, Oligodendrocyte, Toll-like Receptor (TLR)
Abstract
Thymosin β4 (Tβ4), a G-actin-sequestering peptide, improves neurological outcome in rat models of neurological injury. Tissue inflammation results from neurological injury, and regulation of the inflammatory response is vital for neurological recovery. The innate immune response system, which includes the Toll-like receptor (TLR) proinflammatory signaling pathway, regulates tissue injury. We hypothesized that Tβ4 regulates the TLR proinflammatory signaling pathway. Because oligodendrogenesis plays an important role in neurological recovery, we employed an in vitro primary rat embryonic cell model of oligodendrocyte progenitor cells (OPCs) and a mouse N20.1 OPC cell line to measure the effects of Tβ4 on the TLR pathway. Cells were grown in the presence of Tβ4, ranging from 25 to 100 ng/ml (RegeneRx Biopharmaceuticals Inc., Rockville, MD), for 4 days. Quantitative real-time PCR data demonstrated that Tβ4 treatment increased expression of microRNA-146a (miR-146a), a negative regulator the TLR signaling pathway, in these two cell models. Western blot analysis showed that Tβ4 treatment suppressed expression of IL-1 receptor-associated kinase 1 (IRAK1) and tumor necrosis factor receptor-associated factor 6 (TRAF6), two proinflammatory cytokines of the TLR signaling pathway. Transfection of miR-146a into both primary rat embryonic OPCs and mouse N20.1 OPCs treated with Tβ4 demonstrated an amplification of myelin basic protein (MBP) expression and differentiation of OPC into mature MBP-expressing oligodendrocytes. Transfection of anti-miR-146a nucleotides reversed the inhibitory effect of Tβ4 on IRAK1 and TRAF6 and decreased expression of MBP. These data suggest that Tβ4 suppresses the TLR proinflammatory pathway by up-regulating miR-146a.
Introduction
Thymosin β4 (Tβ4)2 is a 5-kDa, 43-amino acid peptide originally isolated from the thymus gland (1). Tβ4 regulates the cellular actin-cytoskeleton and cellular migration by sequestering G-actin (2, 3). Most mammalian cells express Tβ4, and its observed actions in dermal wound and cardiac ischemia models are anti-inflammatory and proangiogenic (4). In addition, Tβ4 promotes cardiomyocyte and keratinocyte migration in these models. Tβ4 improves functional outcome after experimental induction of multiple sclerosis, embolic stroke, and traumatic brain injury (5–7). In all three models, improvement in neurological outcome is associated with oligodendrogenesis (i.e. differentiation of oligoprogenitor cells (OPCs) into mature myelin-secreting oligodendrocytes (OLs)). Oligodendrogenesis contributes to remyelination after neurological injury by differentiation of OPCs into mature myelin-expressing OLs.
Neurorestorative agents act on intact parenchymal cells to promote neurogenesis, angiogenesis, oligodendrogenesis, and axonal remodeling during the recovery phase of neurological injury and thereby enhance neurological recovery (8). Therefore, Tβ4 is a candidate neurorestorative agent when administered in animal models of multiple sclerosis, stroke, and traumatic brain injury (9). However, its mechanisms of action are unclear and require investigation. Toll-like receptors (TLRs) are pattern recognition receptors that recognize conserved molecular patterns of pathogens. In addition to pathogens, TLRs also recognize damage-associated molecular patterns, which are molecular patterns of endogenous host debris released during cellular injury or death (10, 11). This debris can be extracellular matrix protein, oxidized proteins, RNA, or DNA. Once recognition occurs, the TLRs are stimulated, resulting in activation of many signaling pathways, including those pathways involving the mitogen-activated protein kinases (MAPKs) and the nuclear factor NF-κB transcription factors. The MAPKs activate OL differentiation; therefore, TLR signaling may be involved in oligodendrogenesis as well as in regulating the inflammatory response (12, 13). In addition, the TLR pathways are affected by miR-146, which down-regulates proinflammatory cytokine production and activation of inflammatory pathways (14–17). TLR4, is a well studied TLR that mediates its proinflammatory response through three proteins, IRAK1 (IL-1 receptor-associated kinase 1), IRAK4, and TRAF6 (tumor necrosis receptor associated factor 6) (18). By targeting IRAK1 and TRAF6, miR-146 inhibits NF-κB activation. We therefore hypothesized that Tβ4 regulates the TLR proinflammatory signaling pathway by specifically regulating miR-146a to promote differentiation of OPCs to mature myelin basic protein (MBP)-expressing OLs.
MATERIALS AND METHODS
All animal experiments were performed according to protocols approved by the Henry Ford Hospital Institutional Animal Care and Use Committee.
Isolation of Primary Rat Embryonic OPCs
Primary rat embryonic OPCs were isolated and prepared according to the method of Chen et al. (19). Briefly, on embryonic day 17, the rat embryos were removed from a pregnant Wistar rat in a laminar flow hood. The cortices were dissected out by using microdissecting scissors, rinsed twice in Hanks' buffered salt solution, and dissociated after digesting with 0.01% trypsin and DNase at 37 °C for 15 min. The digested cells were washed twice, filtered through a 70-mm nylon cell strainer, and plated with DMEM containing 20% fetal bovine serum (FBS) in poly-d-lysine-coated T75 cell culture flasks (∼10 million cells/flask). The cells grew to confluence for 10 days and then were placed on the shaker at 200 rpm at 37 °C for 1 h to remove microglial cells. Subsequently, the cells were left on the shaker for an additional 18–20 h to collect OPCs. The collected OPCs were plated in untreated Petri dishes for 1 h to remove contaminated microglia and astrocytes, which attach to the Petri dish more efficiently than OPCs. The unattached OPCs were transferred onto poly-dl-ornithine-coated Petri dishes at a cell density of 104/cm2 with a basal chemically defined medium containing 10 ng/ml platelet-derived growth factor-α and 10 ng/ml basic fibroblast growth factor for 7–10 days.
Cell Culture, Transfection, and Treatment with Tβ4
The mouse primary cultures of OPCs were conditionally immortalized by transformation with a temperature-sensitive large T-antigen into a mouse OPC cell line, N20.1 (20). N20.1 cells were provided by Dr. Anthony Campagnoni (UCLA). N20.1 cells were grown and maintained in Dulbecco's modified Eagle's medium (DMEM)/F-12 with 1% FBS and G418 (100 μg/ml) at 37 °C. For N20.1 cells, transient transfections were performed with the Nucleofector kit according to the manufacturer's protocol (Amaxa, Germany). The cells (106) were mixed with 1 μg of plasmid DNA or 100 pmol of siRNA/oligonucleotides and pulsed according to the manufacturer's instruction. The transfected cells were immediately plated into Petri dishes with DMEM containing 1% FBS and incubated at 37 °C for 2 days. Primary rat embryonic OPCs were transiently transfected with Lipofectamine (Invitrogen) overnight, according to the manufacturer's protocol. Amounts of DNA and siRNA/oligonucleotides were used as recommended by manufacturer. The control plasmid (pcDNA3) was used as a mock-transfected control for miR-146a expression vector transfection, and control siRNA (Ambion; a random mixture of oligonucleotides) was used as a mock-transfected control for transfections with Tβ4 siRNA, Krox-20/EGR2 siRNA (Santa Cruz Biotechnology, Inc., Dallas, TX), and anti-miR-146a inhibitor nucleotides (21).
Oligodendrocyte Differentiation Assay
To investigate the effect of Tβ4 on oligodendrocyte differentiation, primary rat embryonic OPCs and mouse N20.1 cells (104 cells/cm2) were incubated at 37 °C with media containing 0, 25, 50, or 100 ng/ml Tβ4 (RegeneRx Biopharmaceuticals Inc., Rockville, MD) without any growth or differentiation factors. Cells were fed every 2 days for 4 days. Basal defined medium without FBS for primary rat embryonic OPCs and DMEM containing 1% FBS for N20.1 cells were employed. After the treatment with Tβ4, we examined the oligodendrocyte differentiation by measuring the expression of its marker, MBP, with Western blot and quantitative real-time (qrtPCR), as described below. The samples that showed the elevation of MBP expression after Tβ4 treatment as a positive response to oligodendrocyte differentiation were utilized for all experiments involved in oligodendrocyte differentiation. For the treatment with kinase inhibitors, the cells were pretreated with p38 MAPK-specific inhibitor (SB 203580) and JNK-specific inhibitor II (SP600125) (Calbiochem) at the dose of 1 μm for 20–30 min before the addition of Tβ4 into the medium.
LPS Contamination Assay
To test for LPS contamination in Tβ4, the cells were cultured in the presence of LPS inhibitor polymyxin B (50 μg/ml), followed by treatment with Tβ4. Tβ4 (100 ng/ml) was boiled for 10 min in order to denature Tβ4 protein and used as a negative control. Transfected cells (2 × 10⁴ cells/cm2), including mock-transfected controls, were treated with and without 100 ng/ml Tβ4 (RegeneRx Biopharmaceuticals Inc.) for 4 days, and fresh medium was provided at day 2 with/without Tβ4.
qrtPCR
The extraction of total RNA and preparation of cDNA were performed as described previously (22). The qrtPCR amplification was done for 40 cycles in the following thermal cycle using SYBR Green (Invitrogen): 95 °C for 30 s, 60 °C for 30 s, and 72 °C for 45 s. The sequences for each primer were used, as reported previously (23). After qrtPCR, agarose gel electrophoresis was performed to verify the quality of the qrtPCR products. There were no secondary products in our data. Each sample was tested in triplicate, and all values were normalized to GAPDH. Values obtained from three independent experiments were analyzed relative to gene expression data using the 2−ΔΔCT method (24).
Quantification of Mature MicroRNAs by Real-time qrtPCR
The cDNA for each microRNA and TaqMan assay were performed in triplicate according to the manufacturer's protocol specified in the Applied Biosystems ViiATM 7 real-time PCR system (Applied Biosystems). Briefly, total RNA was isolated with TRIzol (Qiagen). The reverse transcription reaction mixture contained 1–10 ng of total RNA, 5 units of MultiScribe reverse transcriptase, 0.5 mm each dNTP, 1× reverse transcription buffer, 4 units of RNase inhibitor, and nuclease-free water. The microRNA cDNA was performed by individual reverse transcription in the following thermal cycle: 16 °C for 30 min, 42 °C for 30 min, 85 °C for 5 min. The TaqMan assay was performed in 20-μl TaqMan real-time PCRs containing 1× TaqMan Universal PCR Master Mix No AmpErase UNG, 1× TaqMan microRNA assay buffer, 1.33 μl of undiluted cDNA, and nuclease-free water. All values were normalized to a U6 snRNA TaqMan microRNA control assay (Applied Biosystems) as the endogenous control. Values obtained from three independent experiments were analyzed relative to gene expression data using the 2−ΔΔCT method (24).
Western Blot Analysis
Total protein extracts from the cells were prepared as described previously (22). The protein extracts were separated by SDS-PAGE for Western blot analysis. For Western blot analysis, rabbit antiserum for MBP (1:200; Dako, Carpinteria, CA); monoclonal antibodies (1:1000) for p38 MAPK, phosphorylated p38 MAPK, c-Jun, and phosphorylated c-Jun (1:1000; Upstate, Charlottesville, VA); rabbit polyclonal antibodies (1:1000) for JNK1 and phosphorylated JNK1 (Promega Corp., Madison, WI); goat polyclonal antibodies for TLR2, rabbit polyclonal antibodies for TLR4, TRAF6, IκBα (1:1000), and Krox-20/EGR2 (1:500), and mouse monoclonal antibodies for IRAK1 (1:1000) and β-actin (1:5000; Santa Cruz Biotechnology, Dallas,TX); and mouse monoclonal α-tubulin antibodies (1:5000; Sigma) were used. Donkey anti-goat, anti-rabbit, and anti-mouse horseradish peroxidase (1:5000; Jackson ImmunoResearch, West Grove, PA) were used as secondary antibodies. Each experiment was repeated at least three times. The protein bands were quantified based on histogram analysis relative to gel loading marker α-tubulin in at least three independent experiments.
Immunochemistry
Immunofluorescence staining was performed in N20.1 and primary rat embryonic OPC cells. These cells were fixed with 4% paraformaldehyde for 1 h, washed with PBS, blocked with 1% serum for 1 h, incubated with monoclonal antibodies of OPC marker, O4 (1:1000, Chemicon, Billerica, MA), and a polyclonal antibody against mature OL marker MBP (1:200; Dako, Carpinteria, CA) at room temperature for 1 h, and rinsed with PBS. Secondary antibodies were labeled with cyanine fluorophore (Cy3, red fluorescence) for 1 h. The slides were counterstained with DAPI (blue fluorescence) and examined under a fluorescent illumination microscope (Olympus IX71/IX51, Tokyo, Japan). O4- and MBP-positive cells were quantified by counting in at least three slides per experiment for at least three independent experiments. DAPI-positive cells were considered as the total number of cells.
Statistical Analysis
Data were summarized using mean and S.D. values. To compare the differences between cell cultures with Tβ4 treatment and without, a one-sample t test or a two-sample t test was used. For the comparisons of qrtPCR of mRNA/GAPDH and qrtPCR of miR-146a/U6, controls were normalized to 1, so that a one-sample t test was used for analysis. To compare the percentage of positive stained cells of the total number of cells between Tβ4 treatment and control, a two-sample t test was used. A p value of <0.05 was considered significant.
RESULTS
Tβ4 Increases Expression of miR-146a in OPCs
We investigated the effect of Tβ4 treatment on the expression of miR-146a and miR-146b in primary rat embryonic OPCs (n = 5) and in a mouse OPC cell line, N20.1 (n = 5), by qrtPCR. The purity of rat primary OPCs used in the experiments was confirmed by immunostaining for O4 and was quantified by cell counting. The cell counting data showed that >90% of these cells were O4-positive (Fig. 1). We found that Tβ4 treatment induced the expression of miR-146a in rat primary embryonic OPCs and mouse N20.1 cells in a dose-dependent manner (Fig. 2A). In contrast, Tβ4 treatment had no effect on miR-146b expression in rat primary embryonic OPCs and mouse N20.1 cells (Fig. 2B). Transfection with miR-146a plasmid enhanced miR-146a expression ∼30- to ∼50-fold but had no effect on miR-146b expression in rat primary embryonic OPCs and mouse N20.1 cells (Fig. 2).
FIGURE 1.
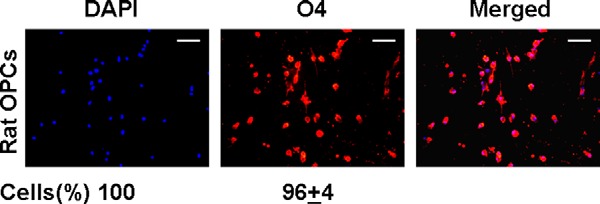
Immunostaining of primary rat embryonic OPCs. Primary rat embryonic OPCs were immunostained for O4 labeled with fluorescence Cy3 and counterstained for nuclei with DAPI. The cells were quantified by counting the percentage of O4-positive cells when DAPI-positive cells were considered as the total number of cells (shown at the bottom). Scale bar, 100 μm.
FIGURE 2.

MicroRNA analysis of miR-146a and miR-146b in OPCs after Tβ4 treatment by qrtPCR. The total RNA samples were extracted from primary rat embryonic OPCs (left) and mouse OPC cell line N20.1 (right) after treatment with Tβ4 at doses ranging from 0 to 100 ng/ml (shown at the bottom) and after transfection with miR-146a for microRNA analysis of miR-146a (A) and miR-146b (B) by qrtPCR. Note that expression of miR-146a was increased in a dose-dependent manner in both OPCs. In contrast, expression of miR-146b remained unchanged. p < 0.05 was considered as significant.
Tβ4 Down-regulates the Intracellular TLR Signaling Pathway in OPCs
miR-146a targets two proinflammatory cytokines, IRAK1 and TRAF6, in the intracellular TLR signaling pathway (25). We investigated the effect of Tβ4 treatment on the TLR signaling pathway in rat primary embryonic OPCs and mouse N20.1 cells. These cell cultures, which demonstrated induction of miR-146a expression after Tβ4 treatment (Fig. 2), were utilized to analyze the expression levels of IRAK1, TRAF6, and MBP, the mature OL marker, by Western blot. Tβ4 treatment markedly reduced the expression levels of IRAK1 and TRAF6 and increased the expression level of MBP in a dose-dependent manner in rat primary embryonic OPCs (n = 3) and mouse N20.1 OPCs (n = 3) (Fig. 3). These data indicate that the TLR signaling pathway may be involved in Tβ4-mediated OPC differentiation in primary rat embryonic OPCs and mouse N20.1 cells.
FIGURE 3.

Western blot analysis of downstream signaling mediators of TLR in OPCs after Tβ4 treatment. The protein samples were separated, transferred, and analyzed from the primary rat embryonic OPCs (left) and mouse OPC cell line N20.1 (right) after treatment with Tβ4 at doses ranging from 0 to 100 ng/ml (shown at the top) and analyzed for different protein expressions. Migrations of proteins are shown at the right. The loading of the samples was normalized with β-actin and α-tubulin. Molecular mass markers are shown at the left in kDa. P-, phosphorylated.
Downstream Signaling of the MAPKs in Tβ4-mediated Oligodendrocyte Differentiation
We investigated the effect of Tβ4 on MAPKs involved in downstream signaling of the TLR pathway. Expression of TLR2 and TLR4 was confirmed by Western blot analysis (Fig. 3). However, treatment with Tβ4 had no effect on expression of TLR2 and TLR4 (Figs. 3 and 4). Western blot was performed to measure expression and phosphorylation of p38 MAPK, ERK1, JNK1, and c-Jun after Tβ4 treatment (Figs. 3 and 4). Tβ4 treatment induced expression and phosphorylation of p38 MAPK, a known regulator of oligodendrocyte differentiation, in a dose-dependent manner. In contrast, Tβ4 dose-dependently inhibited the phosphorylation of ERK1/2, JNK1, and c-Jun in primary rat embryonic OPCs and mouse N20.1 cells (Figs. 3 and 4). During Schwann cell myelination, a similar opposing effect of MAPKs, p38 MAPK, ERK1, and JNK1, has been reported for the expression of a key transcription factor of the MBP promoter, Krox-20, which is also known as EGR2 (early growth response-2) transcription factor (23, 26, 27). To determine whether Tβ4 treatment affected Krox-20 expression in OPCs, we reprobed the Western blots with Krox-20/EGR2 antibodies in OPCs after Tβ4 treatment. These data showed that Tβ4 induced Krox-20 expression in OPCs (Figs. 3 and 4).
FIGURE 4.

Quantitative analysis of expression of TLR2, IRAK1, TRAF6, MBP, phosphorylated ERK1 (P-ERK1), ERK1, phosphorylated JNK1 (P-JNK1), JNK1, phosphorylated c-Jun (P-c-Jun), c-Jun, phosphorylated p38 MAPK (P-p38 MAPK), p38 MAPK, and Krox-20 (EGR2) at the protein level after Tβ4 treatment. Western blot data from the primary rat embryonic OPCs (O) and mouse OPC cell line N20.1 (N) after treatment with Tβ4 at doses of 0, 25, 50, and 100 ng/ml were quantified based on histogram analysis in comparison with α-tubulin. The bar graph indicates relative protein expression in comparison with α-tubulin. p < 0.05 was considered as significant.
Effect of Tβ4 on Oligodendrocyte Differentiation Marker, MBP, Is Independent of LPS Contamination in Tβ4
To avoid confounding data because of any LPS contamination in Tβ4, the cells were cultured in the presence of polymyxin B (50 μg/ml), followed by Tβ4 treatment at a dose of 50 and 100 ng/ml for 4 days. The qrtPCR data indicate that Tβ4 treatment induced the expression of MBP in a dose-dependent manner even in the presence of polymyxin B (50 μg/ml) in rat OPC and N20.1 cells in both mRNA and protein levels (Fig. 5, A–C). In contrast, the boiled denatured Tβ4 (100 ng/ml) treatment had no effect on MBP expression (Fig. 5, A–C). These data suggested that induction of MBP was solely dependent on natural Tβ4 and independent of LPS contamination.
FIGURE 5.

Application of LPS inhibitor polymyxin B for analysis of MBP expression after Tβ4 treatment to test for confounding factor LPS contamination in Tβ4. The total RNA and protein samples were prepared from primary rat (n = 3) embryonic OPCs and mouse OPC cell line N20.1, which were cultured in the presence of polymyxin B (50 μg/ml) followed by treatment with Tβ4 at a dose of 50 and 100 ng/ml in three independent experiments. The bar graph (A) indicates relative mRNA expression in comparison with control for MBP in primary rat embryonic OPCs and mouse N20.1 cells. The protein samples were analyzed by Western blot (B). Loading of samples shown at the top was normalized with α-tubulin. Molecular mass markers are shown at the left in kDa. Migrations of proteins are shown at the right. The protein bands in Western blot were quantified based on histogram analysis in comparison with α-tubulin in the bar graph (C). p < 0.05 was considered as significant.
Effect of miR-146a and Anti-miR-146a on Downstream Signaling Mediators of TLR and MAPKs
We measured protein expression of IRAK1, TRAF6, and MAPKs in miR-146a-overexpressing and miR-146a knock-out primary rat embryonic OPCs (n = 3) and mouse N20.1 cells (n = 3) (Fig. 6). Overexpression and knock-out of miR-146a were determined by quantitative analysis of miR-146a. The efficacy of transfection was an increase of miR-146a of 51 ± 5.3-fold in N20.1 cells and 33.5 ± 4.1-fold in rat OPCs for miR-146a overexpression and a decrease of 73.1 ± 8.3-fold in N20.1 cells and 46.7 ± 5.2-fold in rat OPCs for miR-146a knock-out. Western blot analysis revealed that the miR-146a transfection inhibited expression of IRAK1 and TRAF6 and increased expression and activation of p38 MAPK. In contrast, transfection with anti-miR-146a inhibitor nucleotides significantly inhibited the expression of MBP and phosphorylation of p38 MAPK (Fig. 6). Expression of IRAK1, TRAF6, phospho-ERK1, phospho-JNK, and phospho-c-Jun remained unchanged or slightly elevated. These data indicate that miR-146a may be directly involved in OL differentiation by activation of the p38 MAPK signaling pathway in rat primary embryonic OPCs and mouse N20.1 cells. To determine whether miR-146a transfection regulates Krox-20 expression in OPCs, we performed Western blot analysis in rat primary embryonic OPCs and mouse N20.1 cells. These data demonstrate that miR-146a transfection markedly up-regulated Krox-20 expression. (Fig. 6).
FIGURE 6.

Effect of miR-146a and anti-miR-146a transfection on downstream signaling mediators of TLR. The primary rat embryonic OPCs (left) and mouse OPC cell line N20.1 (right) were transfected with control pcDNA3 vector, miR-146a expression (pcDNA3) vector, and control siRNA (Ambion) containing a random mixture of oligonucleotides for nucleotide control as a control for anti-miR-146a nucleotides (shown at the top) and were lysed for protein extraction and Western blot analysis. The loading of the samples was normalized with α-tubulin. Migrations of proteins are shown at the right. Molecular mass markers are shown at the left in kDa. P-, phosphorylated.
Tβ4 Regulates miR-146a Expression
To investigate the mechanistic link between Tβ4 and miR-146a upon MBP expression, we further investigated the effect of both Tβ4 and miR-146a on the TLR signaling pathways using primary rat embryonic OPCs (n = 3) and the mouse OPC cell line N20.1 (n = 3). Fig. 7 demonstrates a 2-fold increase in mRNA MBP expression in the miR-146a transfection and Tβ4 group in rat primary embryonic OPCs and mouse N20.1 cells. However, a 10-fold increase in mRNA MBP expression is observed when miR-146a-transfected cells are grown in the presence of Tβ4, suggesting that Tβ4 amplifies miR-146a-induced MBP expression. A similar but less robust result is observed when measuring p38 MAPK. Western blot demonstrated similar results at the protein level, as shown in Fig. 8 (primary rat OPCs) and Fig. 9 (mouse N20.1 cells). Furthermore, knock-out of miR-146a or silencing Tβ4 using Tβ4 siRNA (transfection efficiency of Tβ4 siRNA was 58.3 ± 6.2-fold in rat OPCs and 75.1 ± 7.9-fold in N20.1 cells) inhibited MBP expression with no effect on the proinflammatory expression of IRAK1 and TRAF6 or the MAPKs, phospho-ERK1, phospho-JNK1, phospho-c-Jun, and Krox-20 when compared with control (Figs. 8 and 9). Interestingly, silencing Tβ4 using Tβ4 siRNA in miR-146a-overexpressing cells showed inhibition of IRAK1 and TRAF6 without an increase of MBP expression, suggesting that Tβ4 may be necessary for MBP expression. In contrast, using knock-out miR-146a cells treated with Tβ4 showed no change in the expression of MBP, IRAK1, TRAF6, p38 MAPK phospho-ERK1, phospho-JNK1, phospho-c-Jun, and Krox-20. These data indicate that miR-146a is a necessary component for Tβ4-mediated MBP expression. Relative protein expression is quantified and shown in Fig. 10. Collectively, these results suggest that Tβ4 promotes the expression of MBP and Krox-20 through up-regulation of miR-146a.
FIGURE 7.

qrtPCR analysis of MBP, p38 MAPK, and Krox-20/EGR2 in OPCs. qrtPCR analysis of MBP, p38 MAPK, and Krox-20/EGR2 was performed in total RNA samples extracted from the following transfected primary rat embryonic OPCs (Rat OPCs) and mouse OPC cell line N20.1 (shown at the bottom). These cells were transfected with control plasmid (plasmid control) and miR-146a vector (miR-146a transfection), followed by treatment without and with Tβ4 (100 ng/ml) (miR-146a + Tβ4). These OPCs were also transfected with anti-miR-146a and Tβ4 siRNA. p < 0.05 was considered as significant.
FIGURE 8.

Effect of Tβ4 treatment and transfection with miR-146a, anti-miR-146a, and Tβ4 siRNA on MBP expression and downstream signaling mediators of TLR in the primary rat embryonic OPCs. In the left panel, the primary rat embryonic OPCs were transfected with control pcDNA3 vector (Control vector), miR-146a expression vector (miR-146a vector), control pcDNA3 vector followed by Tβ4 treatment (Tβ4 (100 ng/ml)), and miR-146a expression vector followed by Tβ4 (100 ng/ml) treatment (miR-146a + Tβ4) (shown at the top). In the right panel, the primary rat embryonic OPCs were transfected with control siRNA, anti-miR-146a, Tβ4 siRNA, Tβ4 siRNA + miR-146a, and anti-miR-146a followed by Tβ4 (100 ng/ml) treatment (anti-miR-146a + Tβ4) (shown at the top). These cells were lysed for protein extraction and Western blot analysis. The loading of the samples was normalized with α-tubulin. Migrations of proteins are shown at the right. Molecular mass markers are shown at the left in kDa. Note that miR-146a transfection combined with Tβ4 treatment markedly induced MBP expression in the OPCs. Note that Tβ4 treatment fails to induce MBP expression in the absence of miR-146a and that miR-146a transfection has no effect on MBP expression in Tβ4-negative OPCs. P-, phosphorylated.
FIGURE 9.

Western blot analysis of MBP and downstream signaling mediators of TLR after Tβ4 treatment and transfection with miR-146a, anti-miR-146a, and Tβ4 siRNA in the mouse OPC cell line N20.1. The left panel indicates N20.1 cells transfected with control pcDNA3 vector (Control vector), miR-146a expression vector (miR-146a vector), control pcDNA3 vector followed by Tβ4 treatment (Tβ4 (100 ng/ml)), and miR-146a expression vector followed by Tβ4 (100 ng/ml) treatment (miR-146a + Tβ4) (shown at the top). The right panel indicates N20.1 cells transfected with control siRNA, anti-miR-146a, Tβ4 siRNA, Tβ4 siRNA + miR-146a, and anti-miR-146a followed by Tβ4 (100 ng/ml) treatment (anti-miR-146a + Tβ4) (shown at the top). The loading of the samples was normalized with α-tubulin. Migrations of proteins are shown at the right. Molecular mass markers are shown at the left in kDa. Note that marked induction of MBP was observed after miR-146a transfection combined with Tβ4 treatment in N20.1. Note that neither Tβ4 treatment nor miR-146a transfection had any effect on MBP expression in the absence of miR-146a or Tβ4 in N20.1 cells. P-, phosphorylated.
FIGURE 10.

Quantitative analysis of expression of MBP, IRAK1, TRAF6, p38 MAPK, phosphorylated p38 MAPK (P-p38), and Krox-20/EGR2 at the protein level. Western blot data from the primary rat embryonic OPCs and mouse OPC cell line N20.1 transfected with control vector and miR-146a expression vector followed by treatment with/without Tβ4 (100 ng/ml) were quantified based on histogram analysis in comparison with α-tubulin. The bar graph indicates relative protein expression in comparison with α-tubulin (at left) for MBP, IRAK1, TRAF6, p38 MAPK, phospho-p38 MAPK, and Krox-20 (EGR2) (at the bottom) in primary rat embryonic OPCs and mouse N20.1 cells.
To determine whether Tβ4 treatment and miR-146a transfection affect NF-κB activation, we investigated a specific endogenous inhibitor of NF-κB, IκBα, which sequesters NF-κB dimers and keeps NF-κB complexes as inactive forms in the cytoplasm (28). We therefore performed Western blot analysis by reprobing the blots from Tβ4-treated and miR-146a/anti-miR-146a-transfected primary rat embryonic OPCs (n = 3) and the mouse OPC cell line N20.1 (n = 3) with IκBα antibodies. These data indicate that Tβ4 treatment and miR-146a transfection induced IκBα. Silencing miR-146a reversed the effect of Tβ4 and miR-146a on IκBα induction. Knock-out of Tβ4 neutralized the effect of Tβ4 treatment, but it failed to reverse the effect of miR-146a transfection on IκB induction (Fig. 8–10). These data suggest that blockage of the TLR4 signaling pathway induced IκBα, leading to NF-κB activation, because TLR4 signaling mediators, IRAK1 and TRAF6, are targets of miR-146a. Tβ4 treatment therefore inhibited NF-κB activation by inducing IκBα through blocking the proinflammatory TLR4 signaling pathway.
Role of TLR4 Signaling Mediators, IRAK1, TRAF6, p38 MAPK, and JNK1, in Regulation of MBP Synthesis
To determine whether p38 MAPK and JNK1 regulated MBP expression after Tβ4 treatment, these OPCs were pre-exposed with specific pharmaceutical inhibitors, SB203580 for p38 MAPK and SP600125 for JNK1, followed by treatment with Tβ4 (100 ng/ml). The p38 MAPK-specific inhibitor, SB203580, reversed the Tβ4 effect on up-regulation of MBP and Krox-20 expression at the protein and mRNA levels but induced phosphorylation of c-Jun in both rat and mouse OPCs (Figs. 11 and 12). In contrast, Western blot data showed that the JNK1-specific inhibitor, SP600125, increased phosphorylation of p38 MAPK and augmented MBP and Krox-20 expression but abolished phosphorylation of c-Jun in these OPCs (Fig. 11). Transfection either with IRAK1 siRNA or TRAF6 siRNA reduced phosphorylation of JNK1 and c-Jun but increased phosphorylation of p38 MAPK and enhanced the expression of MBP and Krox-20 in both OPCs in Western blot analysis (Fig. 11). These data suggest that inhibition of JNK1 is necessary for MBP synthesis because JNK1 phophorylates and activates the transcription factor c-Jun, which negatively regulates MBP synthesis. On the other hand, activation/phosphorylation of p38 MAPK was required for the expression of Krox-20 and MBP. Thus, blocking TLR4 signaling after Tβ4 treatment induces the expression of Krox-20, the transcription factor for the MBP promoter, which may positively regulate MBP synthesis in these OPCs.
FIGURE 11.

Effect of pharmaceutical specific inhibitors of p38 MAPK and JNK1 and siRNAs of IRAK1 and TRAF6 on protein expression of IRAK1, TRAF6, MBP, p38 MAPK, phosphorylated p38 MAPK (P-p38MAPK), and Krox-20/EGR2 by Western blot analysis in primary rat embryonic OPCs and mouse N20.1 cells. The primary rat embryonic OPCs (two left panels) and mouse N20.1 cells (two right panels) are shown for the treatment with DMSO in the same concentration of inhibitors as control, pharmaceutical specific inhibitors of p38 MAPK and JNK and transfection with control siRNA, IRAK siRNA, and TRAF6 siRNA. The loading of the samples was normalized with α-tubulin. Migrations of proteins are shown at the right. Molecular mass markers are shown at the left in kDa. P-, phosphorylated.
FIGURE 12.

Tβ4-mediated MBP expression depends on the expression of transcription factor Krox-2/EGR2 in primary rat embryonic OPCs and mouse N20.1 cells. A, Western blot analysis of primary rat embryonic OPCs (top) and mouse N20.1 cells (bottom) were subjected to control siRNA transfection as control, Tβ4 (100 ng/ml) treatment, Tβ4 (100 ng/ml) treatment combined with either p38 MAPK inhibitor or JNK1 inhibitor, or Krox-20/EGR2 siRNA transfection. Migrations of proteins are shown at the right. Molecular mass markers are shown at the left in kDa. B, bar graph indicates quantitative analysis of protein expression of Krox-20 (EGR2) and MBP from Western blot data from A based on histogram analysis in comparison with α-tubulin. C, bar graph indicates quantitative analysis of mRNA expression of Krox-20 (EGR2) and MBP from total RNA samples of the same cells used for Western blot analysis in A by qrtPCR.
Underlying Signaling Mechanism on the Opposite Effect of Two MAPKs, p38 MAPK and JNK1, on MBP Synthesis
To investigate the underlying signaling mechanism on the effect of p38 MAPK and JNK1 on MBP synthesis, we analyzed the expression of a key transcription factor of the MBP promoter, Krox-20 (26, 27, 29). Reduction or deficiency of Krox-20/Egr2 in Schwann cells resulted in the failure of MBP synthesis and myelination of axons (30–32). Among these three MAPKs, p38 MAPK shows effects opposite to those of ERK and JNK on the expression of Krox-20/EGR2 and MBP synthesis in Schwann cells (26, 27, 29). ERK and JNK activate c-Jun, which inhibits the expression of Krox-20 and MBP synthesis. In contrast, p38 MAPK induces the expression of Krox-20/EGR2 and MBP synthesis in Schwann cells (26, 27, 29). Krox-20/EGR2 is expressed in the brain and also induces MBP synthesis in glial and olfactory ensheathing cells in mice (33, 34). To examine the expression of Krox-20/EGR2, we performed Western blot and qrtPCR analysis in rat OPC (n = 3) and N20.1 cells (n = 3). These OPCs were pre-exposed with/without pharmaceutical specific inhibitors of p38 MAPK and JNK1 followed by Tβ4 treatment. Data demonstrated that expression of the transcription factor Krox-20/EGR2 was required for MBP synthesis because knocking down Krox-20/EGR2 with its siRNA transfection completely reversed the effect of Tβ4 on MBP synthesis. In contrast, p38 MAPK inhibitor partially reversed the effect of Tβ4 on MBP synthesis at the protein and mRNA levels in rat OPC and N20.1 cells (Fig. 12). The inhibitors of p38 MAPK and JNK1 showed an opposing effect for the expression of Krox-20 at the protein and mRNA levels in rat OPC and N20.1 cells (Fig. 12). These data illustrate that the transcription factor Krox-20/EGR2 regulates the underlying signaling mechanism of the opposite effect of two MAPKs, p38 MAPK and JNK1, on MBP synthesis.
Tβ4 Treatment and miR-146a Transfection Induce Differentiation of OPC to Mature Oligodendrocytes
Rat primary embryonic OPCs and mouse N20.1 cells (n = 3) were transfected with control (mock) and miR-146a vector and treated with and without Tβ4 (100 ng/ml). The OPCs were stained with immunofluorescence antibodies for mature OL markers (MBP) and counterstained with DAPI. These data were quantified by counting the number of MBP-positive cells. DAPI-positive cells were considered as the total number of cells. The number of MBP-positive OPCs was significantly increased after treatment with Tβ4 or transfection with miR-146a in rat primary embryonic OPCs and mouse N20.1 cells (Figs. 13 and 14), respectively. The miR-146a transfection amplified the effect of Tβ4 treatment on MBP immunostaining of both sets of OPCs. These data suggest that Tβ4 treatment and miR-146a transfection induced OL differentiation in both rat primary embryonic OPCs and mouse N20.1 cells.
FIGURE 13.

Immunohistochemistry of MBP in primary rat embryonic OPCs mouse N20.1 cells. The primary rat embryonic OPCs (left) and N20.1 cells (right) were transfected with control vector (control), and cells were treated with Tβ4 (100 ng/ml) (Tβ4 (100 ng/ml)). Similarly, OPCs were also transfected with miR-146a, and miR-146a-transfected cells were treated with Tβ4 (100 ng/ml) (Tβ4 + 146a). The cells were immunofluorescence-stained with Cy3-labeled antibody against OL marker MBP and counterstained with DAPI. Images are merged (Merged).
FIGURE 14.

Quantitative analysis of MBP-positive cells in primary rat embryonic OPCs and mouse N20.1 cells. Primary rat embryonic OPCs and mouse N20.1 cells were transfected with control vector and miR-146a vector (miR-146a transfection) followed by treatment without and with Tβ4 (Tβ4 (100 ng/ml) and miR-146a transfection + Tβ4 (100 ng/ml)). MBP-positive cells after immunofluorescence staining were quantified by cell counting. The bar graph indicates the percentage of MBP-positive cells in primary rat embryonic OPCs and mouse N20.1 cells when DAPI-positive cells were considered as 100% (i.e. total number of cells). p < 0.05 was considered as significant.
DISCUSSION
In this study, we discovered that the pleiotropic peptide, Tβ4, regulates miR-146a. We previously demonstrated a strong association of Tβ4 treatment with OL differentiation in in vivo and in in vitro models (5–7, 23). The results of this study further support our central hypothesis of Tβ4-mediated oligodendrogenesis. Our data demonstrate that Tβ4 increases expression of miR-146a in rat primary OPCs and mouse N20.1 OPCs; attenuates expression of IRAK and TRAF6; and reduces expression of phosphorylation/activation of ERK1, JNK1, and c-Jun, a negative regulator of MBP. Therefore, these data suggest that Tβ4-mediated oligodendrogenesis results from miR-146a suppression of the TLR proinflammatory pathway and modulation of the p38 MAPK pathway.
Tβ4 is present in high concentrations (up to 0.4 mm) in various tissues, including the brain in rats (35). The expression of Tβ4 in the brain is increased with neurodegenerative disease, such as Huntington disease (36), as well as in various experimental conditions, such as brain ischemia (37, 38), kainic acid-induced seizure (39), and hippocampal denervation (40). Intracerebroventricular administration of Tβ4 (10 μl of a 10 μm solution twice a day over 5 days starting from the day of kainic acid injection) prevented kainic acid-induced hippocampal neuronal loss or neurotoxicity (41). Based on this information, our maximal dose of 100 ng/ml (20.4 nm) is not toxic and is a physiologic dose for the treatment of OPCs.
Innate immune signaling pathways are activated in the brain not only in response to infectious disease but also to injury and chronic disease (42, 43). Inflammation initiates tissue repair after injury; however, it must be highly regulated so as not to harm the healing or recovering tissue. Negative regulation of the innate immune system is achieved by several proteins and microRNAs. miR-146a is an important negative regulator of the innate immune system, and it is also found to be highly expressed in developing oligodendrocytes during differentiation (15, 17, 18). Therefore, our finding that Tβ4 up-regulates miR-146a in our in vitro models of OPCs in conjunction with previous observations that Tβ4 promotes recovery after neurological injury suggests a multipurpose role of Tβ4 in promoting oligodendrocyte differentiation as well as modulating the inflammatory response of the innate immune system by down-regulating two components of the pathway, IRAK1 and TRAF6.
The functional role of miR-146a in cellular differentiation has been studied in many different systems. After transfection, the levels of miR-146a were increased up to 50-fold. This observation is consistent with cultured human THP-1 cells demonstrating miR-146a elevation up to 1850-fold in endotoxin tolerance experiments. Overexpression of miR-146a up to at least 35-fold was required for endotoxin tolerance (44). Transfection of miR-146a was also employed previously for tumor suppression in glioma (45). Lentiviral miR-146a transfection showed a 26-fold increase of wild-type miR-146a and attenuated the proliferation, migration, and tumorigenic potential of Ink4a/Arf_/_ Pten_/_EgfrvIII murine astrocytes. Expression of miR-146a in the hematopoietic system promotes macrophage development from hematopoietic stem cells, and down-regulation of miR-146a influences megakaryocytopoiesis (46). Forced expression of miR-146a in breast tumor cells inhibits endogenous NF-κB expression and reduces metastatic activity of the tumor cells (47). Recent work performed by Zhao et al. (48) has demonstrated that miR-146a is a critical regulator of inflammation. Using knock-out miR-146a mice exposed to chronic LPS stimulation, they showed that hematopoietic stem cells are reduced in number and are converted into miR-146a-deficient dysfunctional lymphocytes and myeloid cells, which produce elevated levels of TRAF-6 and NF-κB, resulting in enhanced production of IL-6. Up-regulation of these factors resulted in hematopoietic stem cell depletion, bone marrow failure, and myeloproliferative disease, suggesting that chronic inflammation leads to accelerated aging and cancer risk. Therefore, miR-146a may be a pivotal component in regulating inflammation, and its absence may lead to the detrimental effects of aging. The observation that miR-146 is highly expressed in oligodendrocyte lineage cells suggests that maturation of oligodendrocytes occurs in an environment in which chronic inflammation is down-regulated. Our results showing that Tβ4 increases expression of miR-146a while promoting differentiation of OPCs to MBP-positive oligodendrocytes support this hypothesis. Inhibiting miR-146a in Tβ4-treated cells removed the inhibitor effect on the expression of IRAK and TRAF6 with no increase in MBP expression, suggesting that the miR-146a is a necessary component for MBP expression and down-regulation of the TLR proinflammatory pathway. Moreover, overexpression of miR-146a in Tβ4-treated cells showed an amplified MBP expression and well as suppression of IRAK and TRAF6.
TLRs activate each of the three major mitogen-activated protein kinases, ERK, JNKs, and p38 MAPKs (12). A complex series of triggering MAPK modules occurs after TLR activation, leading to eventual activation of the ERK, JNK, and p38 MAPK, which in turn phosphorylates numerous transcription factors, proteins, and cytoskeletal proteins influencing cell survival and controlling the expression of immune mediators. Our observation of Tβ4 modulation of the two key proinflammatory cytokines, IRAK and TRAF6, with corresponding down-regulation of the expression of phosphorylation/activation of ERK1, JNK1, and c-Jun suggests that Tβ4 reduces inflammation, modulates the MAPKs, and creates an environment for oligodendrocyte differentiation. Our previous study using SVZ cells showed that Tβ4 treatment induced p38 MAPK while suppressing ERK1 and JNK activity and phosphorylated c-Jun, which negatively regulates myelin gene promoter activity (23). Data from this study demonstrate similar results in rat primary OPCs, suggesting that Tβ4 regulation of the MAPKs promotes oligodendrocyte differentiation. Furthermore, our data suggest that up-regulation of miR-146a influences activation of p38 MAPK and corresponding suppression of ERK1 and JNK1 and thus promotes differentiation of OPCs to mature MBP oligodendrocytes.
A similar antagonistic effect of p38 MAPK against JNK1 for MBP synthesis was also found for Krox-20 expression. Expression of Krox-20 was required for MBP synthesis in rat and mouse OPCs. Thus, Krox-20 regulates MBP synthesis and the mechanism underlying the opposing effect of two TLR4-signaling MAPKs, p38 MAPK and JNK1. Another transcription factor, c-Jun, which inhibits MBP synthesis, is a downstream target of JNK1, a serine-threonine kinase that directly phosphorylates c-Jun and increases its activity (23, 27). In contrast, the transcription factor Krox-20, which induces MBP synthesis, is a downstream target of p38 MAPK, which up-regulates MBP expression. Thus, these two transcription factors, c-Jun and Krox-20, are antagonistic for MBP synthesis and oligodendrocyte differentiation.
In summary, Tβ4 treatment up-regulates miR-146a expression in rat primary embryonic OPCs and mouse N20.1 cells. Tβ4 treatment induced miR-146a suppression of the proinflammatory cytokines IRAK1 and TRAF6, leading to up-regulation of p38 MAPK and inhibition of phospho-c-Jun, a negative regulator of MBP promoter. Tβ4 regulates miR-146a and may be required for MBP expression. Furthermore, Tβ4 treatment and miR-146a transfection induced morphological changes suggestive of OL differentiation. These results provide further support for the hypothesis that Tβ4 mediates oligodendrogenesis and support its development as a treatment for neurological injury.
This work was supported, in whole or in part, by National Institutes of Health Grants R01 AG038648 (to D. M.), R01 NS075156 (to Z. G.), and R01 AG037506 (to M. C.). The Henry Ford Health Systems have a Material Transfer Agreement with RegeneRx Biopharmaceuticals Inc. (Rockville, MD). United States Provisional Patent 61/163,556 has been filed for use of Tβ4 in neurological injury.
- Tβ4
- thymosin β4
- OPC
- oligoprogenitor cell
- OL
- oligodendrocyte
- TLR
- Toll-like receptor
- MBP
- myelin basic protein
- qrtPCR
- quantitative real-time PCR.
REFERENCES
- 1. Goldstein A. L., Slater F. D., White A. (1966) Preparation, assay, and partial purification of a thymic lymphocytopoietic factor (thymosin). Proc. Natl. Acad. Sci. U.S.A. 56, 1010–1017 [DOI] [PMC free article] [PubMed] [Google Scholar]
- 2. Huff T., Müller C. S., Otto A. M., Netzker R., Hannappel E. (2001) β-Thymosins, small acidic peptides with multiple functions. Int. J. Biochem. Cell Biol. 33, 205–220 [DOI] [PubMed] [Google Scholar]
- 3. Sanders M. C., Goldstein A. L., Wang Y. L. (1992) Thymosin β4 (Fx peptide) is a potent regulator of actin polymerization in living cells. Proc. Natl. Acad. Sci. U.S.A. 89, 4678–4682 [DOI] [PMC free article] [PubMed] [Google Scholar]
- 4. Goldstein A. L., Hannappel E., Kleinman H. K. (2005) Thymosin β4: actin-sequestering protein moonlights to repair injured tissues. Trends Mol. Med. 11, 421–429 [DOI] [PubMed] [Google Scholar]
- 5. Morris D. C., Chopp M., Zhang L., Lu M., Zhang Z. G. (2010) Thymosin β4 improves functional neurological outcome in a rat model of embolic stroke. Neuroscience 169, 674–682 [DOI] [PMC free article] [PubMed] [Google Scholar]
- 6. Xiong Y., Mahmood A., Meng Y., Zhang Y., Zhang Z. G., Morris D. C., Chopp M. (2011) Treatment of traumatic brain injury with thymosin β(4) in rats. J. Neurosurg. 114, 102–115 [DOI] [PMC free article] [PubMed] [Google Scholar]
- 7. Zhang J., Zhang Z. G., Morris D., Li Y., Roberts C., Elias S. B., Chopp M. (2009) Neurological functional recovery after thymosin β4 treatment in mice with experimental auto encephalomyelitis. Neuroscience 164, 1887–1893 [DOI] [PMC free article] [PubMed] [Google Scholar]
- 8. Zhang Z. G., Chopp M. (2009) Neurorestorative therapies for stroke: underlying mechanisms and translation to the clinic. Lancet Neurol. 8, 491–500 [DOI] [PMC free article] [PubMed] [Google Scholar]
- 9. Morris D. C., Chopp M., Zhang L., Zhang Z. G. (2010) Thymosin β4: a candidate for treatment of stroke? Ann. N.Y. Acad. Sci. 1194, 112–117 [DOI] [PMC free article] [PubMed] [Google Scholar]
- 10. Beutler B. (2004) Innate immunity: an overview. Mol. Immunol. 40, 845–859 [DOI] [PubMed] [Google Scholar]
- 11. Hanke M. L., Kielian T. (2011) Toll-like receptors in health and disease in the brain: mechanisms and therapeutic potential. Clin. Sci. 121, 367–387 [DOI] [PMC free article] [PubMed] [Google Scholar]
- 12. Symons A., Beinke S., Ley S. C. (2006) MAP kinase kinase kinases and innate immunity. Trends Immunol. 27, 40–48 [DOI] [PubMed] [Google Scholar]
- 13. Taganov K. D., Boldin M. P., Chang K. J., Baltimore D. (2006) NF-κB-dependent induction of microRNA miR-146, an inhibitor targeted to signaling proteins of innate immune responses. Proc. Natl. Acad. Sci. U.S.A. 103, 12481–12486 [DOI] [PMC free article] [PubMed] [Google Scholar]
- 14. Butcher J., Abdou H., Morin K., Liu Y. (2009) Micromanaging oligodendrocyte differentiation by noncoding RNA: toward a better understanding of the lineage commitment process. J. Neurosci. 29, 5365–5366 [DOI] [PMC free article] [PubMed] [Google Scholar]
- 15. Lau P., Verrier J. D., Nielsen J. A., Johnson K. R., Notterpek L., Hudson L. D. (2008) Identification of dynamically regulated microRNA and mRNA networks in developing oligodendrocytes. J. Neurosci. 28, 11720–11730 [DOI] [PMC free article] [PubMed] [Google Scholar]
- 16. Mann D. L. (2011) The emerging role of innate immunity in the heart and vascular system: for whom the cell tolls. Circ. Res. 108, 1133–1145 [DOI] [PMC free article] [PubMed] [Google Scholar]
- 17. Nahid M. A., Satoh M., Chan E. K. (2011) Mechanistic role of microRNA-146a in endotoxin-induced differential cross-regulation of TLR signaling. J. Immunol. 186, 1723–1734 [DOI] [PMC free article] [PubMed] [Google Scholar]
- 18. Nahid M. A., Satoh M., Chan E. K. (2011) MicroRNA in TLR signaling and endotoxin tolerance. Cell Mol. Immunol. 8, 388–403 [DOI] [PMC free article] [PubMed] [Google Scholar]
- 19. Chen Y., Balasubramaniyan V., Peng J., Hurlock E. C., Tallquist M., Li J., Lu Q. R. (2007) Isolation and culture of rat and mouse oligodendrocyte precursor cells. Nat. Protoc. 2, 1044–1051 [DOI] [PubMed] [Google Scholar]
- 20. Paez P. M., García C. I., Davio C., Campagnoni A. T., Soto E. F., Pasquini J. M. (2004) Apotransferrin promotes the differentiation of two oligodendroglial cell lines. Glia 46, 207–217 [DOI] [PubMed] [Google Scholar]
- 21. Izadi H., Motameni A. T., Bates T. C., Olivera E. R., Villar-Suarez V., Joshi I., Garg R., Osborne B. A., Davis R. J., Rincón M., Anguita J. (2007) c-Jun N-terminal kinase 1 is required for Toll-like receptor 1 gene expression in macrophages. Infect. Immun. 75, 5027–5034 [DOI] [PMC free article] [PubMed] [Google Scholar]
- 22. Santra M., Santra S., Buller B., Santra K., Nallani A., Chopp M. (2011) Effect of doublecortin on self-renewal and differentiation in brain tumor stem cells. Cancer Sci. 102, 1350–1357 [DOI] [PMC free article] [PubMed] [Google Scholar]
- 23. Santra M., Chopp M., Zhang Z. G., Lu M., Santra S., Nalani A., Santra S., Morris D. C. (2012) Thymosin β4 mediates oligodendrocyte differentiation by upregulating p38 MAPK. Glia 60, 1826–1838 [DOI] [PMC free article] [PubMed] [Google Scholar]
- 24. Livak K. J., Schmittgen T. D. (2001) Analysis of relative gene expression data using real-time quantitative PCR and the 2−ΔΔC(T) method. Methods 25, 402–408 [DOI] [PubMed] [Google Scholar]
- 25. Hou J., Wang P., Lin L., Liu X., Ma F., An H., Wang Z., Cao X. (2009) MicroRNA-146a feedback inhibits RIG-I-dependent type I IFN production in macrophages by targeting TRAF6, IRAK1, and IRAK2. J. Immunol. 183, 2150–2158 [DOI] [PubMed] [Google Scholar]
- 26. Parkinson D. B., Bhaskaran A., Droggiti A., Dickinson S., D'Antonio M., Mirsky R., Jessen K. R. (2004) Krox-20 inhibits Jun-NH2-terminal kinase/c-Jun to control Schwann cell proliferation and death. J. Cell Biol. 164, 385–394 [DOI] [PMC free article] [PubMed] [Google Scholar]
- 27. Salzer J. L. (2008) Switching myelination on and off. J. Cell Biol. 181, 575–577 [DOI] [PMC free article] [PubMed] [Google Scholar]
- 28. Oeckinghaus A., Hayden M. S., Ghosh S. (2011) Crosstalk in NF-κB signaling pathways. Nat. Immunol. 12, 695–708 [DOI] [PubMed] [Google Scholar]
- 29. Parkinson D. B., Bhaskaran A., Arthur-Farraj P., Noon L. A., Woodhoo A., Lloyd A. C., Feltri M. L., Wrabetz L., Behrens A., Mirsky R., Jessen K. R. (2008) c-Jun is a negative regulator of myelination. J. Cell Biol. 181, 625–637 [DOI] [PMC free article] [PubMed] [Google Scholar]
- 30. Hossain S., de la Cruz-Morcillo M. A., Sanchez-Prieto R., Almazan G. (2012) Mitogen-activated protein kinase p38 regulates Krox-20 to direct Schwann cell differentiation and peripheral myelination. Glia 60, 1130–1144 [DOI] [PubMed] [Google Scholar]
- 31. Topilko P., Schneider-Maunoury S., Levi G., Baron-Van Evercooren A., Chennoufi A. B., Seitanidou T., Babinet C., Charnay P. (1994) Krox-20 controls myelination in the peripheral nervous system. Nature 371, 796–799 [DOI] [PubMed] [Google Scholar]
- 32. Zorick T. S., Syroid D. E., Brown A., Gridley T., Lemke G. (1999) Krox-20 controls SCIP expression, cell cycle exit and susceptibility to apoptosis in developing myelinating Schwann cells. Development 126, 1397–1406 [DOI] [PubMed] [Google Scholar]
- 33. Kuhlbrodt K., Herbarth B., Sock E., Hermans-Borgmeyer I., Wegner M. (1998) Sox10, a novel transcriptional modulator in glial cells. J. Neurosci. 18, 237–250 [DOI] [PMC free article] [PubMed] [Google Scholar]
- 34. Le N., Nagarajan R., Wang J. Y., Araki T., Schmidt R. E., Milbrandt J. (2005) Analysis of congenital hypomyelinating Egr2Lo/Lo nerves identifies Sox2 as an inhibitor of Schwann cell differentiation and myelination. Proc. Natl. Acad. Sci. U.S.A. 102, 2596–2601 [DOI] [PMC free article] [PubMed] [Google Scholar]
- 35. Hannappel E. (2007) β-Thymosins. Ann. N.Y. Acad. Sci. 1112, 21–37 [DOI] [PubMed] [Google Scholar]
- 36. Sapp E., Kegel K. B., Aronin N., Hashikawa T., Uchiyama Y., Tohyama K., Bhide P. G., Vonsattel J. P., DiFiglia M. (2001) Early and progressive accumulation of reactive microglia in the Huntington disease brain. J. Neuropathol. Exp. Neurol. 60, 161–172 [DOI] [PubMed] [Google Scholar]
- 37. Kim Y., Kim E. H., Hong S., Rhyu I. J., Choe J., Sun W., Kim H. (2006) Expression of thymosin β in the rat brain following transient global ischemia. Brain Res. 1085, 177–182 [DOI] [PubMed] [Google Scholar]
- 38. Vartiainen N., Pyykönen I., Hökfelt T., Koistinaho J. (1996) Induction of thymosin β4 mRNA following focal brain ischemia. Neuroreport 7, 1613–1616 [DOI] [PubMed] [Google Scholar]
- 39. Carpintero P., Anadón R., Díaz-Regueira S., Gómez-Márquez J. (1999) Expression of thymosin β4 messenger RNA in normal and kainate-treated rat forebrain. Neuroscience 90, 1433–1444 [DOI] [PubMed] [Google Scholar]
- 40. Dong J. H., Ying G. X., Liu X., Wang W. Y., Wang Y., Ni Z. M., Zhou C. F. (2005) Expression of thymosin β4 mRNA by activated microglia in the denervated hippocampus. Neuroreport 16, 1629–1633 [DOI] [PubMed] [Google Scholar]
- 41. Popoli P., Pepponi R., Martire A., Armida M., Pèzzola A., Galluzzo M., Domenici M. R., Potenza R. L., Tebano M. T., Mollinari C., Merlo D., Garaci E. (2007) Neuroprotective effects of thymosin β4 in experimental models of excitotoxicity. Ann. N.Y. Acad. Sci. 1112, 219–224 [DOI] [PubMed] [Google Scholar]
- 42. Rivest S. (2009) Regulation of innate immune responses in the brain. Nat. Rev. Immunol. 9, 429–439 [DOI] [PubMed] [Google Scholar]
- 43. Shao W., Zhang S. Z., Tang M., Zhang X. H., Zhou Z., Yin Y. Q., Zhou Q. B., Huang Y. Y., Liu Y. J., Wawrousek E., Chen T., Li S. B., Xu M., Zhou J. N., Hu G., Zhou J. W. (2013) Suppression of neuroinflammation by astrocytic dopamine D2 receptors via αB-crystallin. Nature 494, 90–94 [DOI] [PubMed] [Google Scholar]
- 44. Nahid M. A., Pauley K. M., Satoh M., Chan E. K. (2009) miR-146a is critical for endotoxin-induced tolerance: implication in innate immunity. J. Biol. Chem. 284, 34590–34599 [DOI] [PMC free article] [PubMed] [Google Scholar]
- 45. Mei J., Bachoo R., Zhang C. L. (2011) MicroRNA-146a inhibits glioma development by targeting Notch1. Mol. Cell Biol. 31, 3584–3592 [DOI] [PMC free article] [PubMed] [Google Scholar]
- 46. Opalinska J. B., Bersenev A., Zhang Z., Schmaier A. A., Choi J., Yao Y., D'Souza J., Tong W., Weiss M. J. (2010) MicroRNA expression in maturing murine megakaryocytes. Blood 116, e128–e138 [DOI] [PMC free article] [PubMed] [Google Scholar]
- 47. Bhaumik D., Scott G. K., Schokrpur S., Patil C. K., Campisi J., Benz C. C. (2008) Expression of microRNA-146 suppresses NF-κB activity with reduction of metastatic potential in breast cancer cells. Oncogene 27, 5643–5647 [DOI] [PMC free article] [PubMed] [Google Scholar]
- 48. Zhao J. L., Rao D. S., O'Connell R. M., Garcia-Flores Y., Baltimore D. (2013) MicroRNA-146a acts as a guardian of the quality and longevity of hematopoietic stem cells in mice. Elife 2, e00537. [DOI] [PMC free article] [PubMed] [Google Scholar]