Abstract
Crosses between Korean and Landrace pigs have revealed a large quantitative trait loci (QTL) region for fat deposition in a region (89 cM) of porcine chromosome 4 (SSC4). To more finely map this QTL region and identify candidate genes for this trait, comparative mapping of pig and human chromosomes was performed in the present study. A region in the human genome that corresponds to the porcine QTL region was identified in HSA1q21. Furthermore, the LMNA gene, which is tightly associated with fat augmentation in humans, was localized to this region. Radiation hybrid (RH) mapping using a Sus scrofa RH panel localized LMNA to a region of 90.3 cM in the porcine genome, distinct from microsatellite marker S0214 (87.3 cM). Two-point analysis showed that LMNA was linked to S0214, SW1996, and S0073 on SSC4 with logarithm (base 10) of odds scores of 20.98, 17.78, and 16.73, respectively. To clone the porcine LMNA gene and to delineate the genomic structure and sequences, including the 3′untranslated region (UTR), rapid amplification of cDNA ends was performed. The coding sequence of porcine LMNA consisted of 1,719 bp, flanked by a 5’UTR and a 3’UTR. Two synonymous single nucleotide polymorphisms (SNPs) were identified in exons 3 and 7. Association tests showed that the SNP located in exon 3 (A193A) was significantly associated with weight at 30 wks (p<0.01) and crude fat content (p<0.05). This association suggests that SNPs located in LMNA could be used for marker-assisted selection in pigs.
Keywords: LMNA, SSC4, Linkage Mapping, QTL Mapping, Pig
INTRODUCTION
Chromosomal locations that harbor several genes involved in the control of quantitative traits are referred to as quantitative trait loci (QTL) (Andersson et al., 1994; Rathje et al., 1997; Boar, 1999). Most agriculturally important economic traits, including milk yield, growth, and meat quality, are quantitative traits. A recent genetic improvement program has led to increased meat production and more desirable carcass traits in the Korean pig. Therefore, the identification of novel QTL could benefit this program through the use of marker-assisted selection (MAS) in pig breeding.
QTL mapping has become common in livestock research, and QTL results for pigs have been compiled in the Animal QTL database. Collectively, these studies have identified approximately 129 putative QTL regions in swine chromosome 4 that are important for pig growth (Knott et al., 1998; De Koning et al., 2001; Malek et al., 2001; Knott et al., 2002) and fat content (Knott et al., 1998; Marklund et al., 1999; Grindflek et al., 2001; Malek et al., 2001).
QTL analysis is based on linkages between known markers and QTL (Knot and Haley, 1992), and the major purpose of QTL mapping is to identify genes or mutations that lead to variation in quantitative traits. Identification of causal mutations can help to characterize the molecular architecture of genetic variation that underlies economically important traits. Moreover, information regarding causal mutations could prove useful for MAS in pig breeding programs. However, because the confidence intervals for QTL studies are generally large, ranging from 20 to 30 cM and containing hundreds of genes, the mapping resolution within these regions is often not sufficiently precise for the detection of functional polymorphisms. Therefore, QTL analysis must be combined with other methods for more precise mapping.
Comparative mapping methods can be used to identify candidate genes biologically associated with quantitative traits, such as fat content and growth, within large QTL regions. We have identified a large QTL region (40.5 to 79 cM) on SSC4 associated with fat content and growth in the F2 generation of a crossbred population derived from Korean and Landrace pigs (Kim, 2002). Comparative mapping showed that this QTL region is homologous to a human chromosomal region located on HSA1q21 that includes the LMNA gene.
Based on examination of genes identified by comparative mapping in the QTL region on SSC4, LMNA was selected as a positional candidate gene, as this gene had previously been associated with fat distribution and growth (Owen et al., 2003). The LMNA gene is found on chromosome 1q21.2-q21.3 in humans and encodes the lamin A/C proteins (Feng and Howard, 1993). This gene belongs to a multi-gene family that contains five major subgroups that can be further subdivided (Quinlan et al., 1995). Transcripts produced from LMNA can be alternatively spliced and structurally consist of three domains. The lamin proteins bind chromatin via the rod domain and bind the inner nuclear membrane via their carboxy-terminal globular tail domain (Fawcett, 1966). Mutations in LMNA cause familial partial lipodystrophy (FPLD), a genetic disorder that leads to unbalanced body fat distribution (Owen et al., 2003).
The objective of this study was to identify single nucleotide polymorphisms (SNPs) within the LMNA gene in the offspring derived from crosses of Korean and Landrace pigs. Associations of these SNPs with quantitative traits, including pig growth and fat content, were then analyzed.
MATERIALS AND METHODS
Animals and phenotypic data
Five Korean native pig boars and ten Landrace sows were randomly selected from a herd at the National Institute of Animal Science (NIAS), Rural Development Administration (RDA), Korea. Each boar was mated with two or more different sows to produce F1 animals. F1 sires were randomly selected from each litter and mated with full-sib sows. In total, 10 sires and 31 dams produced 240 F2 animals. Blood samples were collected from all F2 animals and their parents (F1) and grandparents (F0). DNA was isolated from these samples using the Wizard Genomic DNA Purification Kit (Promega, USA).
Phenotypic data, including birth weight; body weight at 3, 5, 12, and 30 wks of age; carcass weight; back fat thickness (BFT); body fat; muscle pH; drip loss; cooking loss; water holding capacity (WHC); shear force; and intramuscular fat (crude fat) content were collected for F2 animals.
Genotyping of microsatellite markers and QTL mapping
A total of 10 microsatellite markers spanning Sus scrofa chromosome 4 (SSC4) were genotyped for 240 F2 animals derived from Korean pig/Landrace crosses. Microsatellite markers were selected based on the porcine genome map (Rohrer et al., 1996). Marker information is provided in Table 1.
Table 1.
List of microsatellite and SNP markers used for SSC4 linkage map
| Locus | USDA-MARC (cM) | Kosambi (cM) | No. of allele | Annealing temp. (°C) | Size (bp) | Reference |
|---|---|---|---|---|---|---|
| SW2404 | 0 | 0 | 4 | 62 | 132–178 | Rohrer et al., 1996 |
| SW489 | 8 | 9.4 | 3 | 55 | 156–174 | Rohrer et al., 1994 |
| S0301 | 27.1 | 26.0 | 4 | 58 | 250–262 | Archibald et al., 1995 |
| SW2409 | 40.5 | 42.4 | 4 | 58 | 87–97 | Alexander et al., 1996 |
| SW1678 | 48.4 | 51.6 | 4 | 58 | 111–119 | Alexander et al., 1996 |
| SW35 | 55.9 | 64.0 | 4 | 58 | 129–137 | Rohrer et al., 1994 |
| S0214 | 79.3 | 83.7 | 4 | 58 | 121–137 | Robic et al., 1996 |
| LMNA-Not I | – | 90.3 | 2 | 58 | 220 | |
| SW445 | 105.8 | 113.9 | 6 | 58 | 181–206 | Rohrer et al., 1994 |
| S0097 | 120 | 133.8 | 5 | 58 | 181–246 | Ellegren et al., 1994 |
| SWR153 | 125.6 | 152.8 | 4 | 58 | 219–243 | Alexander et al., 1996 |
DNA extracted from blood samples was diluted to a concentration of 50 ng/μl. Ten microsatellite markers located within 125 cM on SSC1 were selected for QTL mapping. PCR amplification of the micro satellite markers was performed using multiplex PCR. Multiplex PCR products were diluted 20-fold. For each sample, a mixture containing 2 μl of the diluted PCR reaction, 10 μl deionized formaldehyde (Sigma-Aldrich, Co., St. Louis, MO, USA), and 0.2 μl Genescan-350 ROX (Applied Biosystems, Foster City, CA, USA) internal standard was analyzed on a 3730XL sequencer (Applied Biosystems). Based on the obtained sequences, the 10 microsatellite markers were genotyped using Gene Mapper software (Applied Biosystems).
QTL interval mapping was performed for carcass traits (fat, back fat thickness, and growth) using QTL express (http://qtl.cap.ed.ac.uk/; Seaton et al., 2002). For QTL analysis, the F2 QTL Analysis Servlet of QTL Express, a web-based QTL mapping tool, was utilized. Chromosome-wide significance threshold levels were determined by permutation testing, which involved shuffling traits 1,000 times randomly, relative to the genotypic data (Churchill and Doerge, 1994). Data were fitted by regression of additive and dominance coefficients for the QTL at each putative position of the QTL (every 1 cM).
Cloning of the full-length LMNA cDNA using rapid amplification of cDNA ends (RACE)
Approximately 1,297 bp of a pig LMNA cDNA fragment was amplified and resequenced using a primer set designed based on the human LMNA gene sequence. Primer sets for RACE were designed based on the pig LMNA cDNA sequence (Table 2).
Table 2.
Primer name, primer sequence, optimal annealing temperature (Ta) for RACE experiments
| Primer name | Primer sequence | Ta (°C) |
|---|---|---|
| GeneRacer. 5′ primer | 5′ GCA CGA GGA CAC UGA CAU GGA CUG A 3′ | 78 |
| GeneRacer. 5′ nested primer | 5′ GGA CAC TGA CAT GGA CTG AAG GAG TA′ | 78 |
| GeneRacer. 3′ primer | 5′ GCT GTC AAC GAT ACG CTA CGT AAC G 3′ | 76 |
| GeneRacer. 3′ nested primer | 5′ CGC TAC GTA ACG GCA TGA CAG TG 3′ | 72 |
| 3′ RACE 1 | 5′ TTC AGG ATG AGA TGC TGC GCC GAG TGG AT 3′ | 73.4 |
| 3′ RACE 1-1 | 5′ GCA GAC CCT GAA GGA GGA GCT GGA CTT CC 3′ | 70.7 |
| 5′ RACE 2 | 5′ GCG TGA CAC CAG CCG GCG GCT GCT GGC CGA 3′ | 86.0 |
| 5′ RACE 2-1 | 5′ GAG GAC TCG CTG GCC CGT GAG CGT GAC ACC 3′ | 78.5 |
The GeneRacer™ kit (Invitrogen, USA) was used to amplify the full-length cDNA of the porcine LMNA gene. mRNA was extracted from liver and muscle tissue using the QIAGEN mRNA kit (Qiagen, USA). First-strand cDNA was synthesized from mRNA using SuperScript® reverse transcriptase (Invitrogen). Reactions for 5′ RACE PCR were composed of 50 ng/μl cDNA, 2.5 μl 2.5 mM MgCl2, 1 μl 10 mM dNTPs, 3 μl 10 μM GeneRacer™ 5′ Primer, 1 μl 10 μM 5′ RACE 1 primer, and 0.5 μl Taq polymerase (5 U/μl) in a final volume of 50 μl. PCR was conducted using a PTC-200 cycler (MJ Reseach, USA) with the following cycling conditions: one cycle of 94°C for 2 min; 5 cycles of 94°C for 30 s and 72°C for 1 min; 5 cycles of 94°C for 30 s and 70°C for 1 min; 25 cycles of 94°C for 30 s, 68°C for 30 s, and 72°C for 1 min; and a final extension cycle of 72°C for 10 min The second PCR reaction was performed using 1 μl of the amplification product obtained from the first PCR with the GeneRacer™ 5′ Nested Primer and the 5′ RACE1-1 primer (Invitrogen). The resulting PCR products were ligated into the TOPO TA cloning vector (Invitrogen) for sequencing.
Radiation hybrid (RH) mapping of the LMNA gene
A Sus scrofa radiation hybrid (SSRH) panel (cell-lined hybrid) was used to map the LMNA gene to pig chromosome 4. Primers for RH mapping were designed based on porcine and rat DNA sequences. PCR was performed in a total volume of 25 μl and contained 50 ng panel DNA, 2.5 μl 10×PCR buffer, 2 μl 2.5 mM dNTPs, 1 μl 10 pmol primers, and 0.75 μl 5 U/μl TaqDNA polymerase (TaKaRa Shuzo Co., Japan). Reactions were carried out in an MJ Research Thermal Cycler (MJ Research) under the following cycling conditions: 10 min initial denaturation at 94°C; 35 cycles of 94°C for 30 s, 62°C for 40 s, 72°C for 30 s; and a final extension at 72°C for 10 min PCR products were resolved on 2% agarose gels by electrophoresis at 100 mV for 20 min A linkage map was prepared using CRIMAP version 2.4 (Green et al., 1990). Distances between chromosomal markers were estimated by maximum likelihood estimation (MLE).
Identification of genetic polymorphisms in the LMNA gene and genotyping
To identify SNPs in the LMNA gene, genomic DNA was isolated from 24 pigs. For amplification of the full 3.3 kb LMNA cDNA, including the 5′- and 3′-UTR regions, seven primer sets were designed based on sequences from GenBank using the Primer3 program (http://frodo.wi.mit.edu/; Table 3). The amplified DNA fragments were directly sequenced using an ABI 3730XL genetic analyzer (Applied Biosystems). SNPs were detected using the Phred/Phrap/Polyphred program (Green et al., 1990).
Table 3.
Primer information for the variation detection in porcine LMNA gene
| EXON | Primer sequence 5′-3′ | Size (bp) | Tm (°C) |
|---|---|---|---|
| EXON 1 | F: 5′-GATCCTGAGGACGACA-3′ R: 5′-CGACTCGGTGGCCAAGGA-3 |
514 | 55 |
| EXON 3 | F: 5′-GAGGCAGCCCTGGGTGAG-3′ R: 5′ -TAACGCCAGGCAGTCGGC-3′ |
800 | 55 |
| EXON 5 | F: 5′-TAACGCCAGGCAGTCGGCC-3′ R: 5′-ACTCGTCCCAGACGCAGAG-3′ |
800 | 55 |
| EXON 7 | F: 5′-GACCAGTCCATGGGCAAC-3′ R: 5′-AGCCTGCGCACGGCTCTCAT-3′ |
220 | 55 |
| C TYPE | F : 5′-CTCTCATCAACTCCACTG-3′ R : 5′-AGCCGCCGCTGAGGCCGAGCCT-3′ |
560 | 55 |
| EXON 11 | F :5′-: TCACCACCACTGAGTGGC- 3′ R: 5′-CACGCACCGTGCTGTGTGGGA-3′ |
1,000 | 55 |
| EXON 12 | F : 5′-TCACCACCACTGAGTGGC- 3′ R : 5′-AGCCCCCAGAACTGCAGCATCA-3′ |
1,300 | 55 |
Genotyping of three SNPs located in exon 3 (A193A) and exon 7 (S403S, R439R) was performed for genomic DNA extracted from tissue samples isolated from 240 F2 animals. PCR-restriction fragment length polymorphism (PCR-RFLP) analysis with the DdeI, NotI, and EarI restriction enzymes was used for genotyping of A193A, S403S, and R439R, respectively (Wagenknecht et al., 2006). Three primer sets were designed to generate DNA fragments of 800 bp, 220 bp, and 220 bp that included restriction enzyme sites for PCR-RFLP analysis (Table 3). PCR reactions contained 1.5 mM MgCl2, 2.5 mM dNTPs, 10 pM each primer, 1 μl genomic DNA (50 ng), and 0.5 U Taq DNA polymerase (Promega) in a final volume of 20 μl. PCR reactions for PCR-RFLP were incubated under the following conditions: 94°C for 5 min and 35 cycles of 94°C for 1 min, 58°C for 1 min, and 72°C for 1 min. Restriction enzymes digests were performed by mixing 20 μl PCR product with three units of the appropriate restriction enzyme, followed by incubation at 37°C for 5 h.
Statistical analysis
Phenotypic data for carcass traits of the 240 F2 animals were analyzed using a generalized linear model (GLM) in SAS (Version 8.01; SAS, Inst., Inc., Cary, NC, USA). Sex (3 levels) and genotype were fitted as fixed effects. The following linear model was used to estimate the association between carcass traits and three polymorphisms found in LMNA:
Where Yijk is the observation of each trait, u is the overall mean for each trait, Si is the effect of sex, Gi is the effect of genotype, Sdayk is covariate for the age at slaughter days and eijk is the random residual effect.
RESULTS AND DISCUSSION
QTL mapping of SSC4 using microsatellite markers
Each of the carcass traits was analyzed separately by interval mapping with the QTL Express program. A significant QTL region was detected for weight at 30 wks (F-statistic = 26.69), as shown in Figure 1. The QTL analysis for weight at 30 wks exhibited rather broad peaks with a significant effect for two markers (S0214 and LMNA-NotI) spanning 6.6 cM. The QTL position for weight at 30 wks was determined to be within the LMNA gene.
Figure 1.
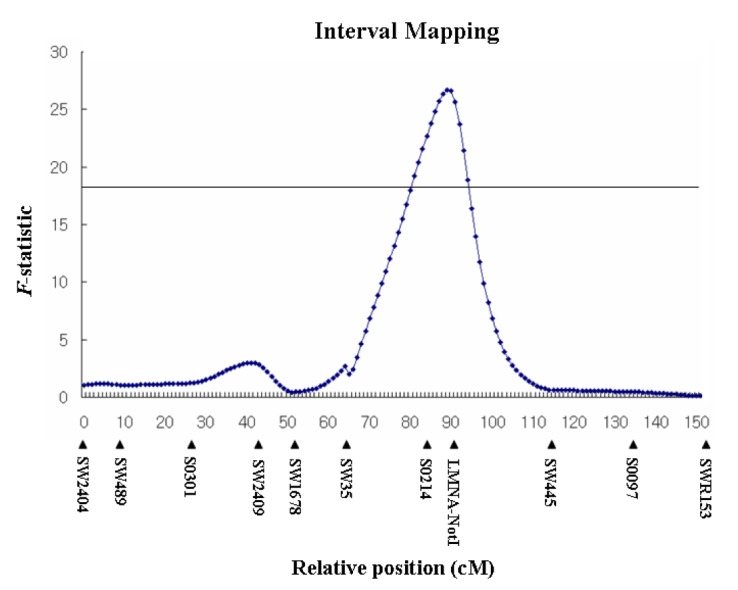
QTL maps corresponding to SSC 4 including the porcine LMNA gene. Microsatellite markers and their map distances (Kosambi mapping function; cM) with added SNP of LMNA gene in SSC4.
Linkage and RH mapping analysis
A linkage map was built based on the recombination rate determined for 10 microsatellite markers on SSC4. The resulting map showed that the LMNA locus was located at 102.5 cM for males and 80.7 cM for females; it was at 90.3 cM on the sex-averaged map (Figure 2). The average marker interval was approximately 15.2 cM for linkage mapping.
Figure 2.
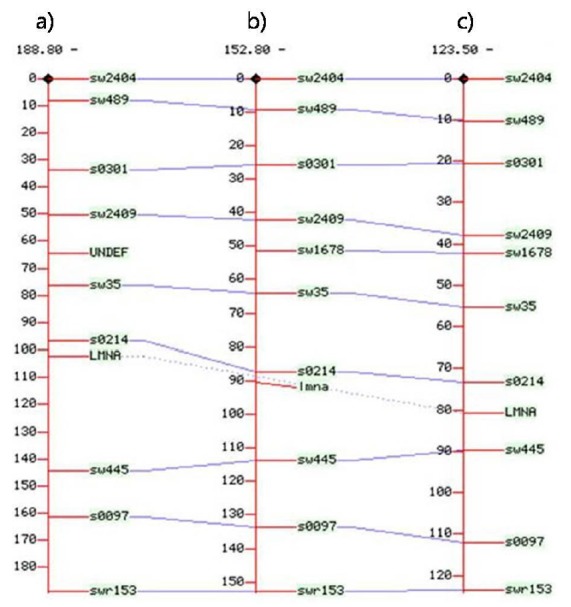
Linkage map of SSC4 incluidng the location of LMNA gene. It was located at 102.5 cM for males; a), 90.3 cM on the sexaverage map; b), and 80.7 cM for females; c).
SSRH panel (Womack et al., 1997) analysis showed that the most significantly linked markers were S0214 (LOD score 20.98) and SW1996 (LOD score 17.78) on SSC4 (Table 4). The assignment of the pig LMNA gene to SSC4 is consistent with the comparative chromosomal homology between human chromosome 1q21.2-q21.3 and SSC4. Together, the data from QTL and RH mapping analysis indicate that LMNA is a strong positional candidate gene for carcass traits, including growth, fat content and back fat thickness.
Table 4.
SSRH map results for the porcine LMNA gene
| Closest marker | Lod | Theta | Distance between markers (cM) |
|---|---|---|---|
| S0214 | 20.98 | 0.12 | 13.12 |
| SW1996 | 17.78 | 0.17 | 19.24 |
| S0073 | 16.73 | 0.19 | 21.44 |
RACE analysis of the LMNA gene
For 3′RACE, RT-PCR products amplified from porcine fillet were sequenced and the results were analyzed using a BLAST search at http://www.nabc.go.kr. Sequence analysis demonstrated that the porcine LMNA cDNA exhibited 90% homology to the human cDNA. Sequences of fragments obtained through 5′RT-PCR and 3′RACE were used to identify protein coding regions using the NCBI open reading frame (ORF) finder (http://www.ncbi.nlm.nih.gov/gor/gorf.html). This program revealed that the fragments obtained through 5′RACE (totaling 955 bp) included 198 bp from the 5′ UTR and an ORF coding for 300 amino acids. Two fragments were identified by 3′RACE that differed in 1,210 bp and in the 3′UTR
Based on characterization of the full-length cDNA from the LMNA gene and a report stating that alternative splicing of LMNA transcripts occurs in both pigs and humans (Hennekes and Nigg, 1994), we hypothesized that our cDNA sequence analysis had revealed two alternatively spliced LMNA transcripts. We found that the type A ORF of the porcine LMNA gene consisted of 2,032 bp that encoded 664 amino acids that ranged from the start codon AT G to the stop codon TAA. The type C ORF consisted of 1,995 bp that encoded 572 amino acids that ranged from the start codon ATG to the stop codon TGA. Both transcripts were similar to those derived from the human LMNA gene. For the LMNA A and C type transcripts, codon 566 of the porcine LMNA gene was found to be identical to that of human LMNA gene. However, six amino acids were present only in the LMNA C type transcript, and these codons are important for binding to the inner nuclear membrane via the C-terminal sequence in humans (Hennekes and Nigg, 1994).
The LMNA A type transcript differed substantially from the LMNA C transcript, encoding 567 to 664 amino acids that differed from those of LMNA C. The amino acids encoded by the LMNA A transcript were structurally similar to that of LMNA C, but the C-terminus was shortened from exon 7 to exon 10. This change may reflect the differences in membrane localization between these two LMNA subtypes, as the lamin A protein contains a CAAX motif and 18 amino acids are released by digestion by a proteolytic enzyme. This cleavage causes lamin A to closely associate with the membrane. The lamin C form has a relatively short C-terminus and is transcribed under less restriction of the inner nuclear membrane, so it exists in combination with lamin A, independent of membrane association (Fawcett, 1966).
Based on amino acid alignments generated using BLAST searches for lamin A, the protein from mouse (P48678), rat (P48679), and human (P02545) consist of 666, 666, and 664 amino acids, respectively. According to estimations of amino acid homology in mammalian species, the LMNA gene was most conserved (98%) between humans and pigs (Figure 3). Similar to the human LMNA A transcript, porcine LMNA A consists of 12 exons. Structurally, the human LMNA A sequence contains an intron between exon 1 and 2 of 15,342 bp, and an intron between exon 2 and 3 of 3,629 bp. The size of the introns in porcine LMNA A was difficult to determine from genomic DNA by PCR, so we were unable to determine the size of these introns in pigs. However, the sizes of the other introns in LMNA A could be estimated using primers within the two successive exons. As a result, we found that the size of the human introns was similar to that of the porcine introns (Figure 4). As shown in Figure 5, the 5′UTR and 3′UTR of human LMNA A were 198 bp and 900 bp, respectively, while the 5′UTR and 3′UTR of porcine LMNA A were 212 bp and 990 bp, respectively. Because the 3′UTR is 990 bp long across 1,017 bp exon 12, it was found that the 3′UTR of the LMNA A transcript is longer than that of other transcripts. Based on the consensus sequences for splice donor and acceptor sequences in humans, the GU-AG rule is likely also applicable to porcine transcripts.
Figure 3.
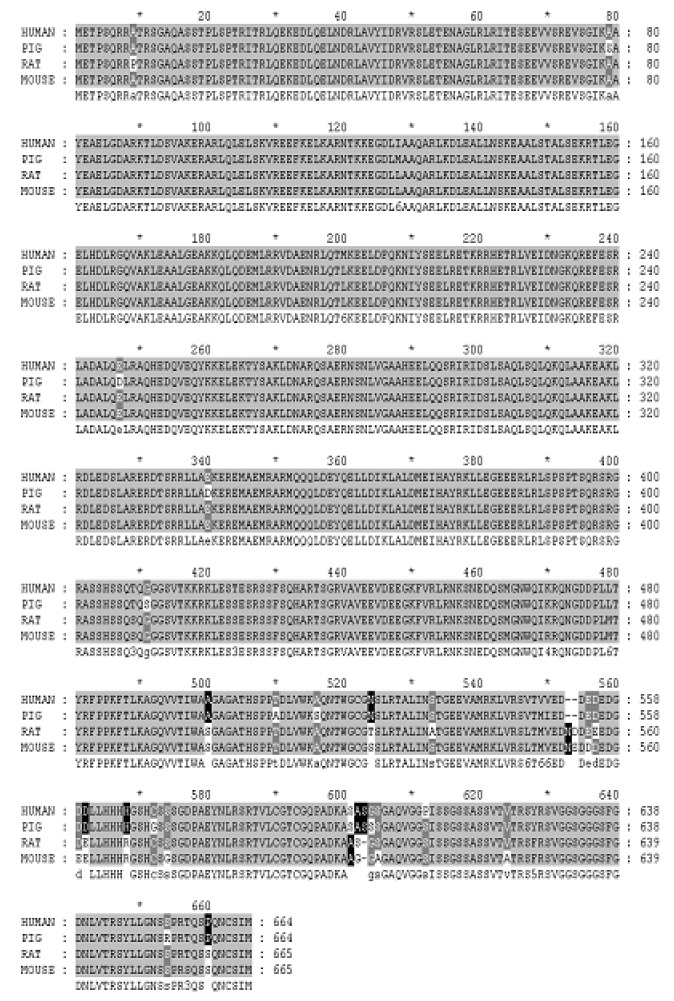
The amino acid sequence alignment of LMNA gene among pig, human, mouse and rat.
Figure 4.
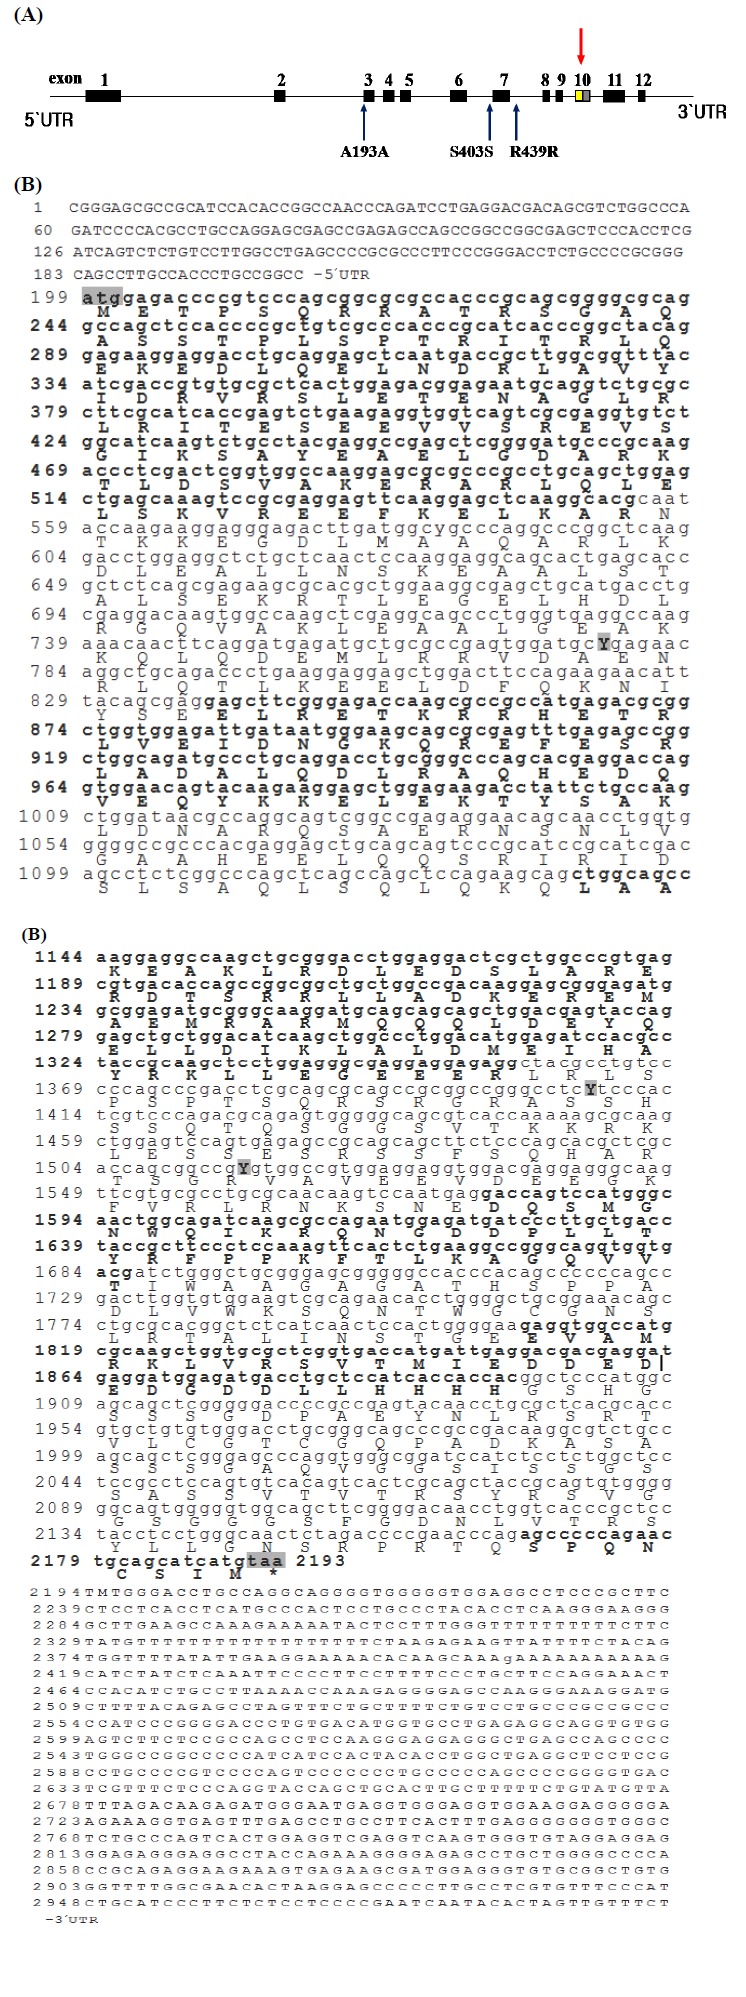
i) Gene structure and coding regions of porcine LMNA gene. Panel A: Schematic representation of porcine LMNA gene organization. Panel B: Nucleotide sequences and deduced amino acid sequences of the porcine LMNA gene. Translated exons are bolded, the atg start and tga stop codons are bold-underlined.
ii) Gene structure and coding regions of porcine LMNA gene. Panel A: Schematic representation of porcine LMNA gene organization. Panel B: Nucleotide sequences and deduced amino acid sequences of the porcine LMNA gene. Translated exons are bolded, the atg start and tga stop codons are bold-underlined (Continued).
Figure 5.
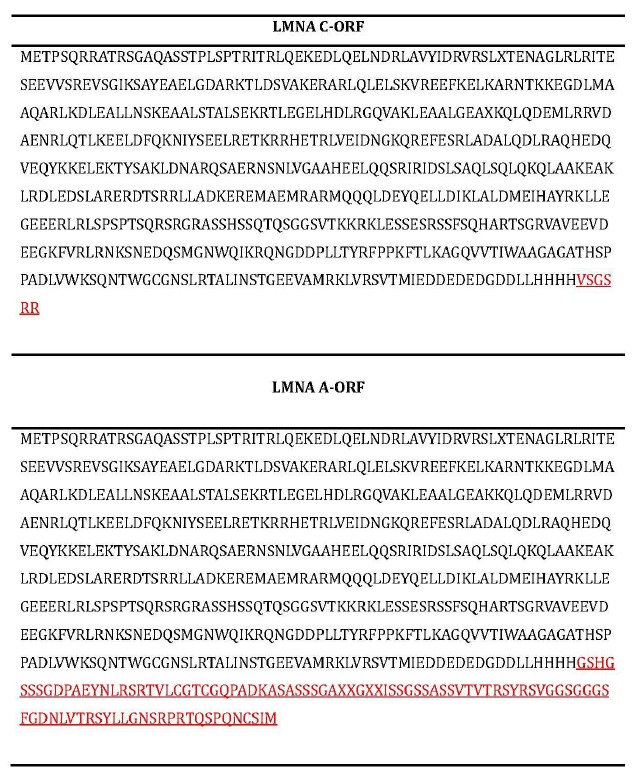
Two types of porcine LMNA gene and their amino acids sequences note that the differences of amino acids are indicated as underlines.
Association analysis
We identified SNPs and characterized the full-length cDNA base sequence of porcine LMNA by means of 5′ and 3′ RACE. Then we performed association studies for 240 F2 animals subjected to SNP genotyping by PCR-RFLP. Three SNPs were identified, located in exon 3 (A193A) and exon 7 (S403S, R439R). Association analysis between the SNP located in exon 3 and physical traits revealed that this SNP is significantly associated with weight (p<0.01) and crude fat content (p<0.05) in pigs 30 wks of age.
PCR-RFLP results for the two SNPs located in exon 7 (S403S, R439R) showed that S403S is linked to R439R, as both of these SNPs exhibited the same genotyping results, based on digestion with NotI and EarI, respectively. This finding indicates that the two loci are genetically correlated with one another (Figure 6).
Figure 6.
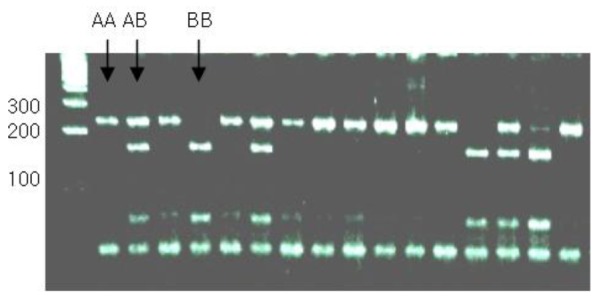
PCR-RFLP patterns using DdeI restriction enzyme for the LMNA gene fragment.
Mutations in LMNA have been linked to several human diseases. Point mutations in exon 8 (R482Q, R482W) and exon 11 (G465D) affect various human phenotypes (Cao and Hegele, 2000; Garg et al., 2001) and can cause an inherited disorder called familial partial lipodystrophy (FPLD), which is characterized by abnormal body fat distribution. In general, patients with FPLD have a normal fat cell distribution at birth but tend to lose subcutaneous fat of the limbs and trunk in early puberty. These patients appear very muscular, but may exhibit insulin-resistant glucose intolerance. As the disease progresses, the fat cells located in the trunk and gluteal regions rapidly degenerate, while body fat accumulates excessively in the hands, neck, and abdomen. FPLD patients also tend to have non-optimal blood compositions, including high concentrated triglyceride levels, low concentrated lipoprotein levels, and high dense lipoprotein levels. To date, the precise mechanisms underlying the association of LMNA mutations with FPLD are not well understood, although these mutations clearly lead to the elimination of certain types of cells, causing the abnormal phenotype. It has been clearly demonstrated that the LMNA gene is a candidate gene associated with the metabolism of lipid tissue in humans (Morel et al., 2006).
In addition to FPLD, mutations in the LMNA gene can also cause infantile Hutchinson-Gilford Progeria Syndrome (HGPS), a rare disease that is characterized by abrupt premature senility at a young age. Typically, HGPS patients age up to ten times faster than normal controls, and children with HGPS are more likely to develop classical senior disorders, including ankylosis and luxation of the hip joint. Most patients with HGPS die of myocardial infarction or cerebral apoplexy. Consistent with the etiology of this disorder, mutations in LMNA have been functionally associated with DNA synthesis, transcription, and apoptosis, in addition to body fat content and aging (Goldman et al., 2004). Moreover, dilated cardiomyopathy (DCM) can be caused by mutations in exons 1, 3, 6, 8, 10, and 11 of LMNA. These mutations are associated with cardiac muscle fiber expansion, attenuated cardiac pumping, and even heart failure. Furthermore, limb-girdle muscular dystrophy 1B (LGMD-1B) can be caused by mutations in exons 3, 6, and 10 of LMNA.
Because phenotypic traits related to fat deposition were associated with point mutations in human LMNA, we hypothesized that the phenotypes associated with the porcine gene may also include changes in lipid metabolism or growth. Therefore, we performed an association study of three SNPs to determine whether phenotypic traits in pigs are affected by point mutations in LMNA. The results are shown in Table 5. The LMNA-EarI SNP was significantly associated with weight at age 12 wks, weight at age 210 wks, and back fat thickness (p<0.01), and the LMNA-DdeI locus was significantly associated with weight at age 30 wks (p<0.01) and crude fat content (p<0.05).
Table 5.
Association analysis between LMNA gene polymorphism with fat and growth traits
| Trait |
LMNA- Ear I (N = 241)
|
Prob. | ||
|---|---|---|---|---|
| Genotype
| ||||
| AA (19) | AB (51) | BB (171) | ||
| 5 wks weight | 6.78±0.39 | 6.93±0.23 | 7.23±0.12 | 0.424 |
| 12 wks weight | 20.77±1.36b | 21.48±0.79b | 23.75±0.42a | 0.019** |
| 210 wks weight | 84.91±3.91ab | 81.02±2.27b | 89.03±1.23a | 0.0078** |
| BFT | 18.80±1.77 b | 19.19±1.23 b | 22.30±0.56 a | 0.0102** |
| Body fat (trimmed) | 9.19±1.58 | 8.73±0.62 | 10.18±0.33 | 0.1013 |
| C-fat | 1.88±0.62 | 1.92±0.36 | 2.46±1.20 | 0.3257 |
| Share | 3.34±0.30 | 3.80±0.18 | 3.81±0.10 | 0.3329 |
| Trait |
LMNA-Dde I (N = 241)
|
Prob. | ||
| Genotype
| ||||
| AA (173) | AB (54) | BB (14) | ||
| Weight of 30 wks | 5.03±0.08a | 4.57±0.26b | 4.61±0.14ab | 0.0185** |
| Crude fat | 2.09±0.19a | 1.82±0.67b | 3.05±0.34ab | 0.0405* |
Significance levels: p<0.01,
p<0.05.
In conclusion, we expect that contigs identified in this study will be useful as critical reference information for characterization of LMNA, a gene associated with quantitative traits related to growth and fat content located on chromosome 4 of the pig. Novel SNPs in the porcine LMNA gene reported in this study may also prove useful as molecular markers for porcine breeding in the future.
ACKNOWLEDGEMENT
This work was supported by the “Discovery of genes related to porcine meat quality” research project of the National Institute of Animal Science and the “Genetic improvement maximization of Korean native pigs using marker-assisted selection and construction of commercial line production system” research project of the BioGreen 21 Program of the Korea Rural Development Administration (Grant No. 20080401034053). We would also like to thank Noriyuki Hamasima, a senior researcher of the Animal Genome Program Analysis Team of the National Institute of Agrobiological Sciences, Japan for supplying the SSRH panel DNA.
REFERENCES
- Alexander L, Troyer D, Rohrer G, Smith TPL, Schook L, Beattie C. Physical assignments of 68 porcine cosmid and lambda clones containing polymorphic microsatellites. Mamm. Genome. 1996;7:368–372. doi: 10.1007/s003359900106. [DOI] [PubMed] [Google Scholar]
- Andersson L, Haley CS, Ellegren H, Knott SA, Johansson M, Andersson K, Andersson-Eklund L, Edfors-Lilja I, Fredholm M, Hansson I. Genetic mapping of quantitative trait loci for growth and fatness in pigs. Science. 1994;263:1771. doi: 10.1126/science.8134840. [DOI] [PubMed] [Google Scholar]
- Archibald A, Haley C, Brown J, Couperwhite S, McQueen H, Nicholson D, Coppieters W, Weghe A, Stratil A, Winterø A. The PiGMaP consortium linkage map of the pig (Sus scrofa). Mamm. Genome. 1995;6:157–175. doi: 10.1007/BF00293008. [DOI] [PubMed] [Google Scholar]
- Boar W. A paternally expressed QTL affecting skeletal and cardiac muscle mass in pigs maps to the IGF2 locus. Nat Genet. 1999;21:157. doi: 10.1038/5938. [DOI] [PubMed] [Google Scholar]
- Cao H, Hegele RA. Nuclear lamin A/C R482Q mutation in Canadian kindreds with Dunnigan-type familial partial lipodystrophy. Hum Mol Genet. 2000;9:109–112. doi: 10.1093/hmg/9.1.109. [DOI] [PubMed] [Google Scholar]
- Churchill GA, Doerge RW. Empirical threshold values for quantitative trait mapping. Genetics. 1994;138:963–971. doi: 10.1093/genetics/138.3.963. [DOI] [PMC free article] [PubMed] [Google Scholar]
- De Koning D, Harlizius B, Rattink A, Groenen M, Brascamp E, Van Arendonk J. Detection and characterization of quantitative trait loci for meat quality traits in pigs. J Anim Sci. 2001;79:2812–2819. doi: 10.2527/2001.79112812x. [DOI] [PubMed] [Google Scholar]
- Ellegren H, Chowdhary BP, Johansson M, Marklund L, Fredholm M, Gustavsson I, Andersson L. A primary linkage map of the porcine genome reveals a low rate of genetic recombination. Genetics. 1994;137:1089–1100. doi: 10.1093/genetics/137.4.1089. [DOI] [PMC free article] [PubMed] [Google Scholar]
- Feng L, Howard HW. Structuaral organizating of the human gene encoding nuclear lamin A and nuclear lamin C. J Biol Chem. 1993;268:16321–16326. [PubMed] [Google Scholar]
- Fawcett DW. On the occurrence of a fibrous lamina on the inner aspect of the nuclear envelope in certain cells of vertebrates. Am J Anat. 1966;119:129–145. doi: 10.1002/aja.1001190108. [DOI] [PubMed] [Google Scholar]
- Garg A, Vinaitheerthan M, Weatherall PT, Bowcock AM. Phenotypic heterogeneity in patients with familial partial lipodystrophy (Dunnigan variety) related to the site of missense mutations in lamin A/C gene. J Clin Endocrinol Metab. 2001;86:59–65. doi: 10.1210/jcem.86.1.7121. [DOI] [PubMed] [Google Scholar]
- Goldman RD, Shumaker DK, Erdos MR, Eriksson M, Goldman AE, Gordon LB, Gruenbaum Y, Khuon S, Mendez M, Varga R. Accumulation of mutant lamin A causes progressive changes in nuclear architecture in Hutchinson-Gilford progeria syndrome. Proc Natl Acad Sci USA. 2004;101:8963–8968. doi: 10.1073/pnas.0402943101. [DOI] [PMC free article] [PubMed] [Google Scholar]
- Green P, Falls K, Crooks S. Documentation for CRI-MAP, version 2.4. Washington University School of Medicine; St. Louis, MO: 1990. [Google Scholar]
- Grindflek E, Szyda J, Liu Z, Lien S. Detection of quantitative trait loci for meat quality in a commercial slaughter pig cross. Mamm. Genome. 2001;12:299–304. doi: 10.1007/s003350010278. [DOI] [PubMed] [Google Scholar]
- Hennekes H, Nigg EA. The role of isoprenylation in membrane attachment of nuclear lamins. A single point mutation prevents proteolytic cleavage of the lamin A precursor and confers membrane binding properties. J Cell Sci. 1994;107:1019–1029. doi: 10.1242/jcs.107.4.1019. [DOI] [PubMed] [Google Scholar]
- Kim TH. PhD thesis. Seoul National University; Seoul. Korea: 2002. Genetic mapping of quantitative trait loci (QTL) for major economic traits in pig. [Google Scholar]
- Knott S, Nyström P, Andersson-Eklund L, Stern S, Marklund L, Andersson L, Haley C. Approaches to interval mapping of QTL in a multigeneration pedigree: the example of porcine chromosome 4. Anim Genet. 2002;33:26–32. doi: 10.1046/j.1365-2052.2002.00803.x. [DOI] [PubMed] [Google Scholar]
- Knott SA, Haley CS. Aspects of maximum likelihood methods for the mapping of quantitative trait loci in line crosses. Genet Res. 1992;60:139–151. [Google Scholar]
- Knott SA, Marklund L, Haley CS, Andersson K, Davies W, Ellegren H, Fredholm M, Hansson I, Hoyheim B, Lundström K. Multiple marker mapping of quantitative trait loci in a cross between outbred wild boar and large white pigs. Genetics. 1998;149:1069–1080. doi: 10.1093/genetics/149.2.1069. [DOI] [PMC free article] [PubMed] [Google Scholar]
- Malek M, Dekkers JCM, Lee HK, Baas TJ, Prusa K, Huff-Lonergan E, Rothschild MF. A molecular genome scan analysis to identify chromosomal regions influencing economic traits in the pig. II. Meat and muscle composition. Mamm Genome. 2001;12:637–645. doi: 10.1007/s003350020019. [DOI] [PubMed] [Google Scholar]
- Marklund L, Nyström PE, Stern S, Andersson-Eklund L, Andersson L. Confirmed quantitative trait loci for fatness and growth on pig chromosome 4. Heredity. 1999;82:134–141. doi: 10.1038/sj.hdy.6884630. [DOI] [PubMed] [Google Scholar]
- Morel CF, Thomas MA, Cao H, O’Neil CH, Pickering JG, Foulkes WD, Hegele RA. A LMNA splicing mutation in two sisters with severe Dunnigan-type familial partial lipodystrophy type 2. J Clin Endocrinol Metab. 2006;91:2689–2695. doi: 10.1210/jc.2005-2746. [DOI] [PubMed] [Google Scholar]
- Owen KR, Donohoe M, Ellard S, Hattersley AT. Response to treatment with rosiglitazone in familial partial lipodystrophy due to a mutation in the LMNA gene. Diabet Med. 2003;20:823–827. doi: 10.1046/j.1464-5491.2003.01034.x. [DOI] [PubMed] [Google Scholar]
- Quinlan R, Hutchison C, Lane B. Intermediate filament proteins. Protein Profile. 1995;2:795. [PubMed] [Google Scholar]
- Rathje TA, Rohrer G, Johnson R. Evidence for quantitative trait loci affecting ovulation rate in pigs. J Anim Sci. 1997;75:1486–1494. doi: 10.2527/1997.7561486x. [DOI] [PubMed] [Google Scholar]
- Robic A, Riquet J, Yerle M, Milan D, Lahbib-Mansais Y, Dubut-Fontana C, Gellin J. Porcine linkage and cytogenetic maps integrated by regional mapping of 100 microsatellites on somatic cell hybrid panel. Mamm Genome. 1996;7:438–445. doi: 10.1007/s003359900129. [DOI] [PubMed] [Google Scholar]
- Rohrer GA, Alexander LJ, Hu Z, Smith T, Keele JW, Beattie CW. A comprehensive map of the porcine genome. Genome Res. 1996;6:371–391. doi: 10.1101/gr.6.5.371. [DOI] [PubMed] [Google Scholar]
- Rohrer GA, Alexander LJ, Keele JW, Smith TP, Beattie CW. A microsatellite linkage map of the porcine genome. Genetics. 1994;136:231. doi: 10.1093/genetics/136.1.231. [DOI] [PMC free article] [PubMed] [Google Scholar]
- Wagenknecht D, Stratil A, Bartenschlager H, Van Poucke M, Peelman LJ, Majzlik I, Geldermann H. SNP identification, linkage and radiation hybrid mapping of the porcine lamin A/C (LMNA) gene to chromosome 4q. J Anim Breed Genet. 2006;123:280–283. doi: 10.1111/j.1439-0388.2006.00591.x. [DOI] [PubMed] [Google Scholar]
- Womack M, Festou MC, Stern SA. The Heliocentric evolution of key species in the distantly-active comet C/1995 O1 (Hale-Bopp) Astron J. 1997;114:2789–2795. [Google Scholar]


