Abstract
Objectives
High-fat diet (HFD) feeding in mice is characterized by accumulation of αβ T cells in adipose tissue. However, the contribution of αβ T cells to obesity-induced inflammation of skeletal muscle, a major organ of glucose uptake, is unknown. This study was undertaken to evaluate the effect of αβ T cells on insulin sensitivity and inflammatory state of skeletal muscle and adipose tissue in obesity. Furthermore, we investigated whether CD4+IFNγ+ (TH1) cells are involved in skeletal muscle and adipose tissue metabolic dysfunction that accompanies obesity.
Methods
Mice lacking αβ T cells (T cell receptor beta chain–deficient [TCRb−/−] mice) were fed HFD for 12 weeks. Obesity-induced skeletal muscle and adipose tissue inflammation was assessed by flow cytometry and quantitative RT-PCR. To investigate the effect of TH1 cells on skeletal muscle and adipose tissue inflammation and metabolic functions, we injected 5×10⁵ TH1 cells or PBS weekly over 12 weeks into HFD-fed TCRb−/− mice. We also cultured C2C12 myofibers and 3T3-L1 adipocytes with TH1-conditioned medium.
Results
We showed that similar to adipose tissue, skeletal muscle of obese mice have higher αβ T cell content, including TH1 cells. TCRb−/− mice were protected against obesity-induced hyperglycemia and insulin resistance. We also demonstrated suppressed macrophage infiltration and reduced inflammatory cytokine expression in skeletal muscle and adipose tissue of TCRb−/− mice on HFD compared to wild-type obese controls. Adoptive transfer of TH1 cells into HFD-fed TCRb−/− mice resulted in increased skeletal muscle and adipose tissue inflammation and impaired glucose metabolism. TH1 cells directly impaired functions of C2C12 myotubes and 3T3-L1 adipocytes in vitro.
Conclusions
We conclude that reduced adipose tissue and skeletal muscle inflammation in obese TCRb−/− mice is partially attributable to the absence of TH1 cells. Our results suggest an important role of TH1 cells in regulating inflammation and insulin resistance in obesity.
Keywords: Obesity, inflammation, T cells, skeletal muscle
INTRODUCTION
Obesity is associated with chronic low-grade inflammation of adipose tissue, particularly in visceral fat depots (1). In addition to infiltrating macrophages, adipose tissue inflammation is characterized by T cell accumulation (2–6). Indeed, T cells infiltrate adipose tissue before macrophages (4). Adipose tissue of obese animals promotes T cell activation, which results in monocyte recruitment and differentiation into CD11c+ proinflammatory macrophages (2, 7, 8). Proinflammatory macrophages release cytokines, including tumor necrosis factor–α (TNF-α) and interleukin (IL)–6, which impair triglyceride storage and insulin sensitivity in adipocytes (1, 9, 10). In addition to contributing to macrophage infiltration and activation, T cells directly alter adipose tissue functions (6, 11). Metabolic dysfunction of fat further leads to elevated circulating nonesterified fatty acids (NEFAs) and accumulation of triglycerides in skeletal muscle and liver, contributing to obesity-associated systemic insulin resistance (12, 13).
Skeletal muscle is an important insulin-responsive organ that contributes substantially to systemic insulin sensitivity. It was recently suggested that in addition to adipose tissue, obesity affects the inflammatory state of skeletal muscle (14). Previous studies demonstrated that high-fat diet (HFD) results in macrophage infiltration into skeletal muscle (15). The role of T cells in obesity-induced inflammation in skeletal muscle has not been characterized.
Two subpopulations of T cells can be distinguished on the basis of different T cell receptors (TCRs). The majority of T cells in adult blood are αβ T cells, which express TCR α/β. Antigen recognition by TCR α/β is associated with expression of accessory molecules CD4 or CD8. Increased infiltration of CD8+ T cells in obese mice has been linked to adipose tissue inflammation and insulin resistance (7). On the other hand, different subsets of CD4+ T cells play different roles in obesity. IL-4– and IL-13–secreting CD4+ T cells (TH2) and Foxp3+ CD4+ T regulatory cells (Treg) improve insulin resistance and obesity-associated adipose tissue inflammation (16, 17). On the other hand, interferon-γ (IFN-γ), the main cytokine secreted by CD4+IFNγ+ (TH1) cells, impair glucose metabolism (11, 18). Some studies reported obesity-related increase in IFN-γ–producing CD4+ T cells (TH1) in adipose tissue, while others showed that the number remained unchanged (16, 19). Nevertheless, the presence of TH1 cells in skeletal muscle, an important insulin-responsive organ, and their contribution to skeletal muscle inflammation is unknown. In addition, the role of αβ T cells, comprised of both CD4+ and CD8+ T lymphocytes, and the effect of their deficiency on obesity-associated adipose tissue and skeletal muscle inflammation and insulin resistance have never been reported.
We previously showed that mice with HFD-induced obesity have increased αβ T cell numbers in adipose tissue (6). The current studies were undertaken to evaluate the role of αβ T cells in adipose tissue inflammation and metabolic dysfunctions in obesity. We also reported a novel observation that T cells, and particularly αβ T cells, are increased in skeletal muscle of obese mice. Furthermore, we showed that αβ T cells play an important role in skeletal muscle inflammation. We investigated the effect of αβ T cell depletion by using mice deficient in TCR beta chain (TCRb−/− mice). We hypothesized that lack of αβ T cells leads to improved metabolic phenotype and reduced inflammation in adipose tissue and skeletal muscle of HFD-fed mice. We also wanted to determine whether TH1 cells can infiltrate skeletal muscle and adipose tissue and impair their functions.
MATERIALS AND METHODS
Mice
Male TCRb−/− and C57BL/6J wild-type (WT) control (Jackson Laboratory 002118 and 000664) mice were fed normal chow diet (ND; 4.5% w/w fat; Picolab Rodent Diet 5010, Purina Mills) after weaning until 8 weeks old. To induce obesity, mice were fed western HFD (21% w/w fat; Dyet 112734, Dyets Inc.) starting at 8 weeks old for 12 weeks. All animal studies and experimental procedures were approved by the Institutional Animal Care and Use Committee of Baylor College of Medicine.
Metabolic studies
Plasma glucose, insulin, triglycerides, and NEFAs were measured after 6-hour fast. Insulin resistance was estimated by homeostasis model assessment of insulin resistance (HOMA-IR): fasting insulin (μU/ml) × fasting glucose (mmol/l)/22.5. Plasma adiponectin was analyzed by Mouse Adiponectin/Acrp30 ELISA (R&D Systems). Glucose tolerance test (GTT) and insulin tolerance test (ITT) were performed after 6-hour fast. For GTT, mice were injected intraperitoneally with 1 g/kg dextrose dissolved in water. For ITT, mice were injected with 0.75 U/kg (ND fed) or 1.5 U/kg (HFD-fed) regular human insulin (Humulin R, Lilly).
After 6-hour fasting, mice were injected intraperitoneally with 1.5 U/kg regular human insulin. Skeletal muscle (quadriceps femoris) and perigonadal adipose tissue (PGAT) were collected 10 minutes after injection.
Triglyceride content and tissue histology
Lipids were extracted with hexane/isopropanol, and triglyceride content was measured using a Triglyceride Test Kit (Waco Diagnostics). PGAT samples were fixed, embedded in paraffin, and sectioned for hematoxylin/eosin staining. Adipocytes were counted in 3–5 fields per animal. Adipocyte surface area was estimated by dividing the field area by the number of adipocytes. Paraffin-embedded quadriceps muscle tissues were stained with polyclonal antibody to CD3 (Abcam) followed by secondary antibody, Vectastain ABC Elite kit and DAB substrate (Vector Laboratories).
Flow cytometry
PGAT and skeletal muscle tissue were minced and digested with 280 U/ml collagenase type I (Worthington Biochemical Corporation) for 1 hour. Digested tissues were then filtered, and cells were recovered by centrifugation. Cells were stained with antibodies specific for CD3, CD4, CD8, CD45, CD11c (BD Pharmingen), F4/80, and TCRβ (eBioscience). For intracellular staining, cells were incubated with Leukocyte Activation Cocktail with BD GolgiPlug (BD Pharmingen) in complete Dulbecco’s Modified Eagle Medium (DMEM) containing 10% fetal bovine serum (FBS) for 10 hours at 37°C. Cell suspensions were then fixed and permeabilized with BD Cytofix/Cytoperm kit (BD Biosciences) and stained with anti–IFN-γ (BD Pharmingen). Flow cytometry analysis was performed with FlowJo software to examine cell populations.
Naïve CD4+ T cell and TH1 cell culture
Splenocytes isolated from ND-fed WT mice were used to purify CD4+ T cells using MACS CD4+ T Cell Isolation Kit II (Miltenyi Biotec). Naïve CD4+ T cells were differentiated into TH1 cells ex vivo using anti-CD3–coated plates (5 μg/ml) in the presence of 2 μg/ml anti-CD28 and 10 ng/ml IL-12 in complete DMEM. After 2 days, fresh medium containing IL-2 for a final concentration of 10 ng/ml was added to the cells.(20) At 7 days after priming, TH1 cells were recovered by centrifugation, and TH1-conditioned medium, which contained all soluble factors released by TH1 cells, was saved for further experiments. Naïve CD4+ T cells were cultured in the presence of IL-2.
Cell transfer experiments
Eight-week-old HFD-fed TCRb−/− mice were administered (by tail vein injections) either 5×10⁵ TH1 cells or phosphate-buffered saline (PBS) weekly for 12 weeks. After 12 weeks of injections, ITT was performed and fasting blood glucose was measured. In addition, PGAT, skeletal muscle, and spleen were obtained and used for flow cytometry analysis to confirm TH1 cell homing. PGAT and skeletal muscle tissue were also saved for mRNA extraction and subsequent quantitative reverse transcription polymerase chain reaction (qRT-PCR) analysis.
3T3-L1 and C2C12 cell culture
3T3-L1 murine preadipocytes were maintained and differentiated to mature adipocytes as described previously (6). C2C12 skeletal muscle cells were maintained in DMEM supplemented with 10% FBS. At 90% confluence, cells were induced to differentiate in 2% horse serum for 4 days. Fully differentiated 3T3-L1 adipocytes and C2C12 myofibers were then treated with naïve CD4+ T cell– or TH1–conditioned medium for 48 hours at 37°C, and mRNA was isolated as described below.
Immunoprecipitation and Western blotting
Tissues were homogenized in Cell Extraction Buffer (Invitrogen). Proteins were separated using polyacrylamide gels, transferred to PVDF membranes, and probed with serine473-phosphorylated Akt or Akt antibodies (Cell Signaling Technology). After incubation with secondary antibody, antibody-bound proteins were detected using electrochemiluminescence reagent according to manufacturer’s instructions (GE Healthcare Bioscience). Bands were scanned and quantified using a STORM 840 instrument (GE Healthcare Bioscience).
RNA isolation and qRT-PCR
Total RNA was isolated using TRIzol reagent and examined by qRT-PCR using predesigned primers and probes. Gene expression levels were expressed as relative mRNA levels compared with 18S rRNA internal control.
Statistical analysis
All statistical analyses were performed using GraphPad Prism 5.0 (GraphPad Software). Mean differences were analyzed using independent two-sample t-tests. Temporal observations were analyzed using repeated measures analysis of variance with a Bonferroni significance level of α*= α/number of tests, where α=0.05 is the unadjusted significance level. All data are reported as mean±standard error of the mean (SEM). Except the Bonferroni-based significance levels, a significance level of p<0.05 was used for all other hypothesis tests.
RESULTS
HFD-fed αβ T cell–deficient mice have reduced adipose tissue inflammation and enhanced insulin signaling despite larger adipocyte size and increased PGAT weight
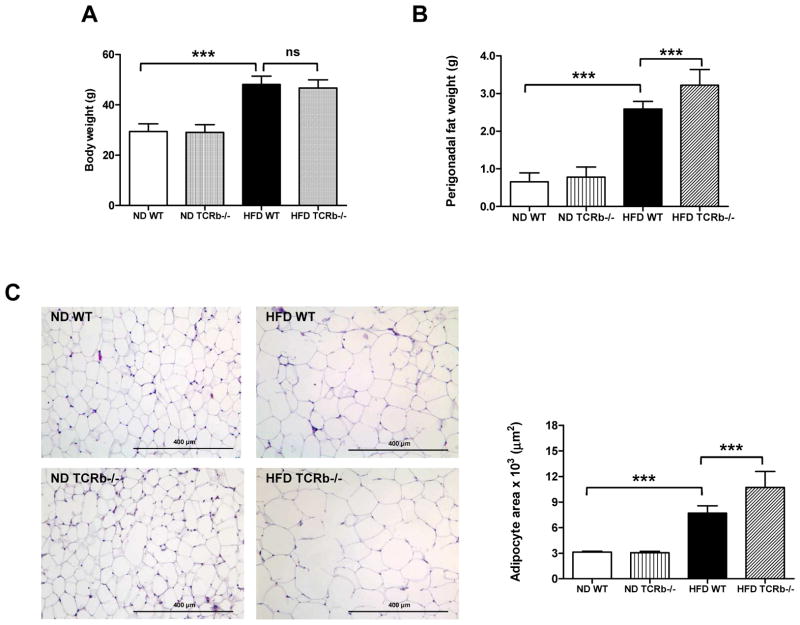
After 12 weeks of HFD, TCRb−/− mice gained similar body weight to WT controls (Figure 1A). Nevertheless, liver weight was significantly reduced (Supplementary Figure 1A), attributable to reduced lipid deposition (Supplementary Figure 1B). Perigonadal fat weight was ~20% higher in obese TCRb−/− mice than WT controls (Figure 1B). Furthermore, adipocyte size was significantly larger in obese TCRb−/− mice (Figure 1C), suggesting improved triglyceride storage.
Figure 1. Deficiency of αβ T cells leads to increased perigonadal fat weight and adipocyte size.
(A) Body weight of 20-week-old wild-type (WT) and TCRb−/− mice on normal diet (ND) or high-fat diet (HFD) (n=32–40 mice/group). (B) Perigonadal fat weight (n=32–40 mice/group). (C) Representative images of paraffin-imbedded perigonadal adipose tissue (PGAT) sections stained with hematoxylin/eosin. Mean surface area of adipocytes in 3–5 randomly selected sections for each mouse (n=3 mice/group). Data are mean ± SD. ***P<0.001.
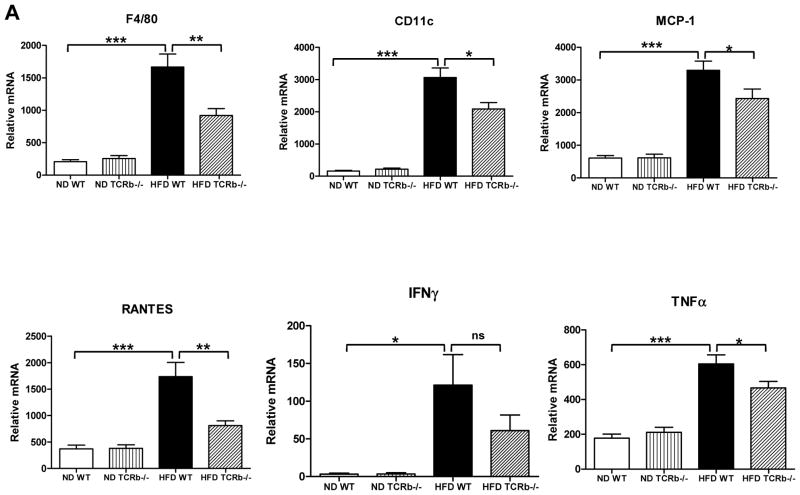
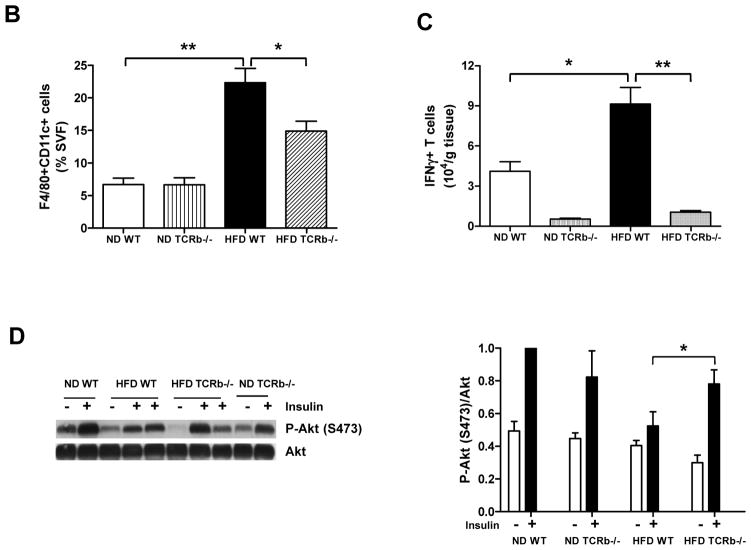
As expected, αβ T cell number in PGAT of TCRb−/− mice was negligible (Supplementary Figure 2A). Approximately 3 times more γδ T cells accumulated per gram of PGAT in HFD-fed TCRb−/− mice than HFD-fed WT controls (Supplementary Figure 2B). Nevertheless, total T cell number was significantly lower in HFD-fed TCRb−/− mice (Supplementary Figure 2C). qRT-PCR analysis of PGAT revealed markedly decreased expression of macrophage marker F4/80, a marker of classically activated (M1) macrophages; CD11c; chemokines, including monocyte chemoattractant protein–1 (MCP-1) and regulated on activation, normal T-cell expressed and secreted (RANTES); and proinflammatory cytokines TNF-α and IFN-γ in obese TCRb−/− mice compared with HFD-fed WT controls (Figure 2A). Flow cytometry analysis confirmed a lower proportion of F4/80+ CD11c+ macrophages (Figure 2B) and fewer IFN-γ–secreting CD3+ T cells (Figure 2C) in the stromal vascular fraction of HFD-fed TCRb−/− mice than HFD-fed WT controls. Western blot analysis of PGAT lysates revealed that HFD-fed TCRb−/− mice injected with insulin had significantly higher levels of serine473-phosphorylated Akt normalized to total Akt protein compared to HFD-fed WT mice (Figure 2D). Together these results indicated that αβ T cell deficiency was associated with improved insulin resistance and reduced adipose tissue inflammation with decreased accumulation of proinflammatory macrophages and T cells.
Figure 2. Reduced PGAT inflammation and enhanced insulin signaling in HFD-fed TCRb−/− mice.
(A) Quantitative reverse transcriptase polymerase chain reaction (RT-PCR) analysis of inflammatory gene expression in PGAT of WT and TCRb−/− mice (n=12–23 mice/group). (B) CD11c+ F4/80+ macrophages in ND-fed (n=4 mice/group) and HFD-fed (n=10–12 mice/group) mice were analyzed by flow cytometry as a percentage of total number of stromal vascular fraction (SVF) cells. (C) Flow cytometry analysis of the number of interferon-γ (IFNγ)-producing T cells per gram of PGAT (n=3–6 mice/group). (D) Serine-phosphorylated Akt [P-Akt (S473)] protein expression in PGAT of mice treated with 1.5 U/kg body weight regular human insulin or PBS 10 minutes prior to sacrifice. The levels of P-Akt (S473) were expressed as P-Akt/Akt ratio. Results are shown as means of 2 separate experiments (n=3–4 mice/group). All data are shown as ± SEM. *P<0.05, **P<0.01, ***P<0.001.
αβ T cell deficiency improves skeletal muscle metabolic function
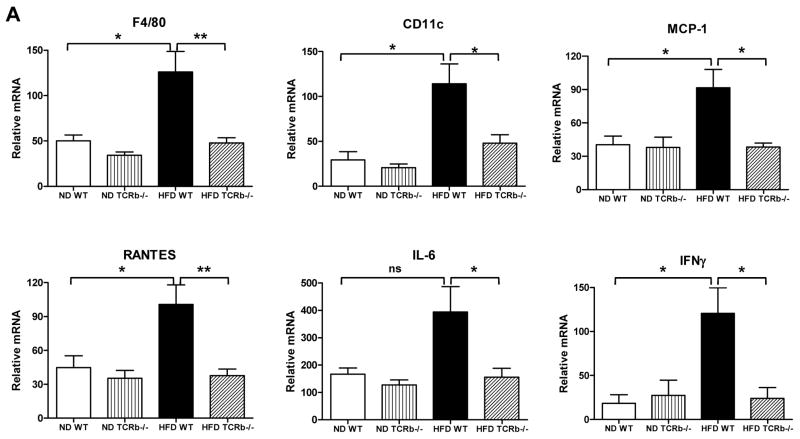
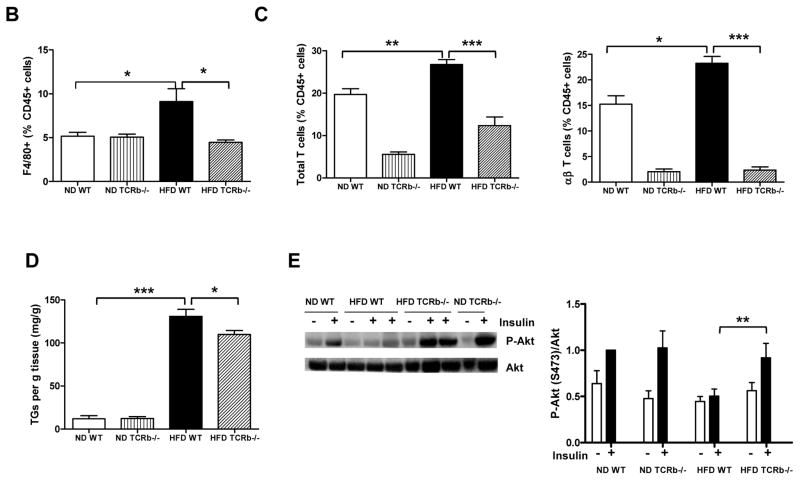
Whole body glucose uptake primarily reflects skeletal muscle utilization. Similar to PGAT, skeletal muscle of obese WT mice had increased mRNA levels of F4/80, CD11c, MCP-1, RANTES, IL-6, and IFN-γ compared to lean WT animals. The expression of these inflammatory markers was significantly reduced in HFD-fed TCRb−/− mice (Figure 3A). Consistent with previous reports (15), macrophage content was higher in skeletal muscle of obese WT mice than lean WT controls. Obese αβ T cell–deficient mice had decreased F4/80+ macrophage content (Figure 3B). We also made the novel observation that obesity increased T cells in skeletal muscle. The percentages of total T cells and αβ T cells were higher in obese WT mice than their lean counterparts (Figure 3C). Further looking at αβ T cell subsets, we observed a 2-fold induction of CD8+ T cell content in skeletal muscle of HFD-fed mice. CD4+ T cells were also elevated in obese skeletal muscle; however, the results did not reach statistical significance (Supplementary Figure 3). As expected, αβ T cell content was negligible in TCRb−/− mice (Figure 3C). Similar to PGAT, γδ T cell content was not different between ND- and HFD-fed groups, but was higher in TCRb−/− mice (data not shown). The percentage of total T cells was lower in HFD-fed TCRb−/− mice than HFD-fed WT mice (Figure 3C). Immunohistochemistry confirmed higher CD3+ T cell numbers in skeletal muscle of HFD-fed mice compared to ND-fed WT mice (Supplementary Figure 4). HFD-fed TCRb−/− mice had slightly but significantly lower triglyceride levels in skeletal muscle compared to HFD-fed WT mice (Figure 3D). Skeletal muscle of HFD-fed TCRb−/− mice also had higher levels of serine473-phosphorylated Akt (Figure 3E). These results suggest improved insulin sensitivity in obese TCRb−/− mice, attributable to attenuated skeletal muscle inflammation and lower triglyceride level.
Figure 3. The effect of αβ T cell deficiency on skeletal muscle function.
(A) Quantitative RT-PCR analysis of inflammatory gene expression in skeletal muscle of ND-fed (n=6–8 mice/group) and HF-fed (n=12–17 mice/group) mice. (B) Flow cytometry analysis of F4/80+ macrophages (% CD45+ cells), (C) total CD3+ T cells and αβ T cells (% CD45+ cells) (n=3–5 mice/group). (D) Triglyceride (TG) levels normalized to gram of tissue (n=5–7 mice/group for ND and n=13 mice/group for HFD). (E) P-Akt (S473) protein expression in skeletal muscle of mice injected with insulin or PBS (1.5 U/kg body weight). Results are shown as means±SEM of 2 separate experiments (n=3–4 mice/group). All data are shown as ± SEM. *P<0.05, **P<0.01, ***P<0.001.
HFD-fed TCRb−/− mice are partially protected against obesity-induced systemic insulin resistance and glucose intolerance
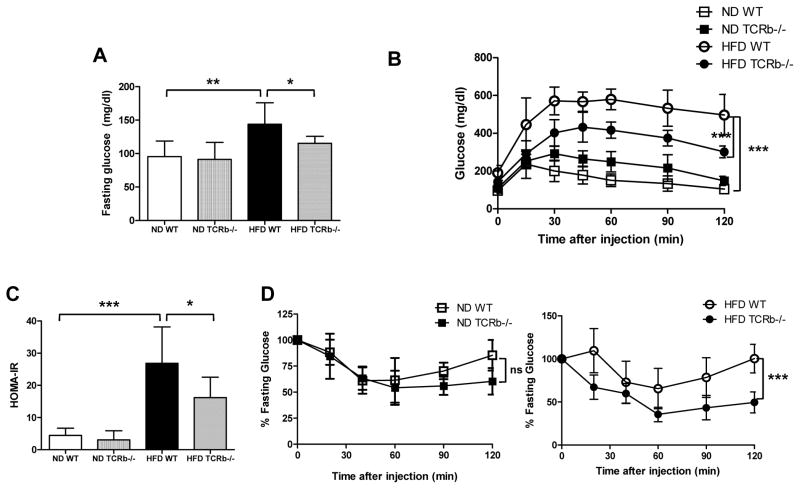
We then determined whether αβ T cell deficiency affects systemic metabolic functions. After a 6-hour fast, obese WT mice exhibited hyperglycemia, with blood glucose ~20% higher than lean controls. αβ T cell deficiency significantly reduced plasma glucose level (Figure 4A). After 12 weeks on HFD, WT mice had impaired glucose tolerance compared to lean controls. In contrast, glucose tolerance was markedly improved in obese TCRb−/− mice (Figure 4B). HOMA-IR values were also significantly improved in HFD-fed TCRb−/− mice compared to HFD-fed WT controls (Figure 4C). While TCRb−/− and WT mice fed ND had similar insulin tolerance (Figure 4D left), TCRb−/− mice on HFD demonstrated improved insulin sensitivity upon insulin challenge (Figure 4D right). Our results thus show that αβ T cell deficiency ameliorated HFD-induced systemic insulin resistance and hyperglycemia.
Figure 4. Metabolic phenotype of mice with αβ T cell deficiency.
(A) Fasting blood glucose concentration (n=7–10 mice/group), (B) glucose tolerance test (n=7 mice/group), and (C) HOMA-IR in WT and TCRb−/− mice on ND and HFD. (D) Insulin tolerance test in 20-week-old ND-fed (left) or HFD-fed (right) WT and TCRb−/− mice (n=7 mice/group). All data are shown as ± SD of 3 experiments. *P<0.05, **P<0.01, ***P<0.001.
Fasting plasma triglyceride and NEFA concentrations were higher in obese WT mice than lean controls. αβ T cell deficiency led to lower fasting NEFA (Supplementary Figure 5A) and triglyceride levels (Supplementary Figure 5B) in HFD-fed mice. As expected, WT mice with diet-induced obesity had lower plasma concentration of adiponectin, an anti-inflammatory factor. The suppressive effect of obesity on adiponectin levels was abolished in obese TCRb−/− mice, whose plasma adiponectin concentration was similar to that of ND-fed mice (Supplementary Figure 5C).
TH1 cells accumulate in PGAT and skeletal muscle of obese mice
Consistent with previous studies showing increased CD4+IFNγ+ (TH1) cells in adipose tissue of obese WT mice (11, 17, 19), we found increased TH1 cell accumulation in PGAT of HFD-fed WT mice (Supplementary Figure 6A). Flow cytometry analysis also demonstrated increased TH1 cell content in skeletal muscle of obese mice, which has never been shown before (Supplementary Figure 7A). qRT-PCR showed significant upregulation of IL-2 and IL-12β, cytokines crucial for CD4+ T cell polarization into TH1, in both PGAT and skeletal muscle of obese WT mice compared to those on ND (Supplementary Figures 6B and 7B). In addition, class II major histocompatibility complex (MHC II) molecules CD74 and CIITA were upregulated, suggesting TH1 cell activation (Supplementary Figures 6C and 7C). These data indicate that obesity changes adipose tissue and skeletal muscle milieu, which favors proinflammatory TH1 cell accumulation.
HFD-fed TCRb−/− mice administered TH1 cells are more susceptible to diet-induced hyperglycemia and insulin resistance
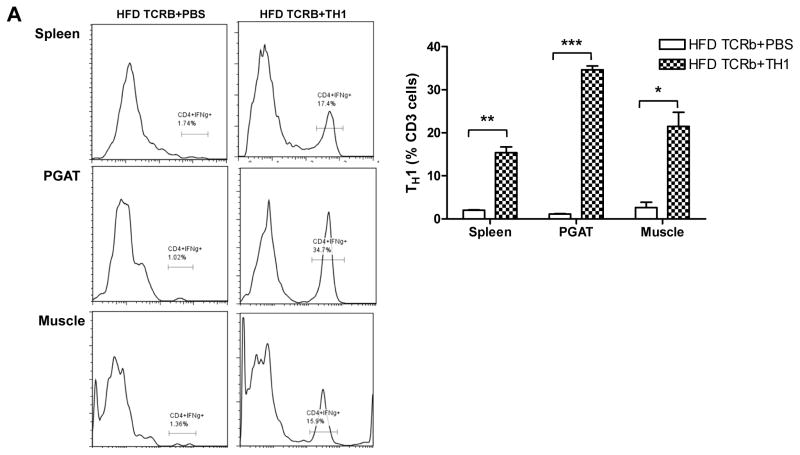
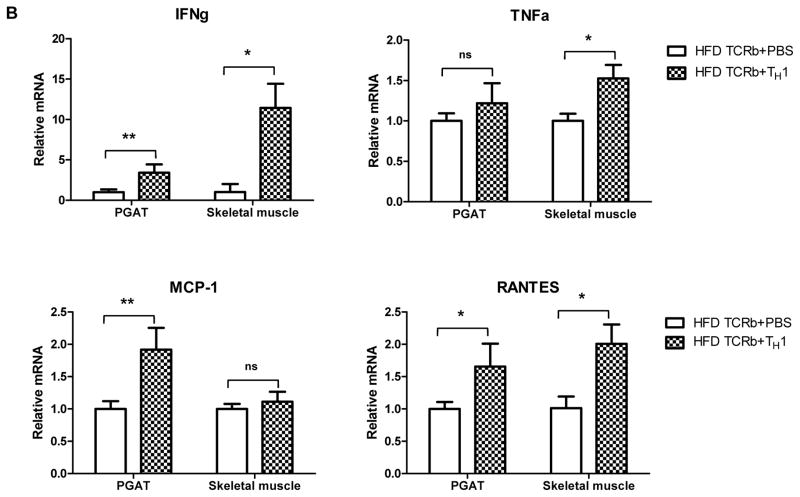
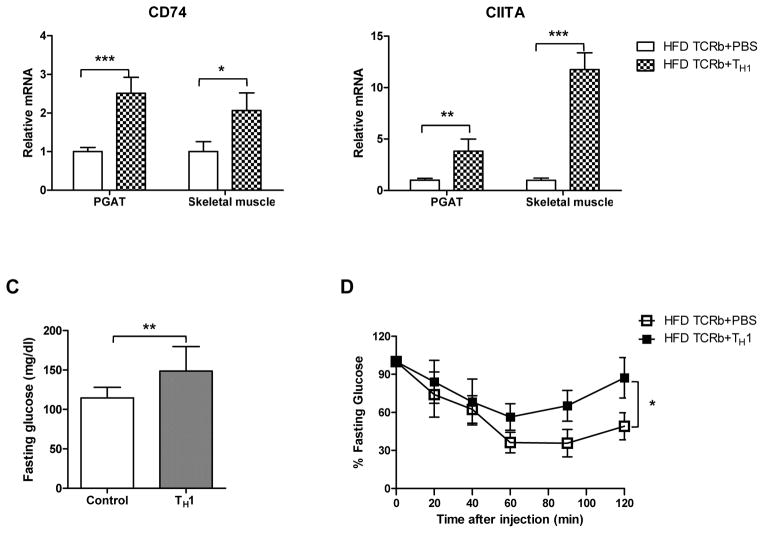
Following the loss-of-function studies described above, we conducted gain-of-function experiments by injecting 5×10⁵ CD4+ cells differentiated to IFN-γ–producing TH1 cells or PBS weekly over 12 weeks into TCRb−/− mice fed HFD. Flow cytometry analysis showed that injected TH1 cells homed into PGAT, skeletal muscle, and spleen (Figure 5A). All transferred CD4+ cells that infiltrated the tissues expressed IFN-γ (data not shown). Although the injected cells were not labeled, we concluded that the population of CD4+IFNγ+ (TH1) cells that we saw in tissues was due to the cell transfer because TCRb−/− mice had negligible numbers of CD4 and CD8 cells. TH1 cell transfer resulted in significant induction of IFN-γ in both PGAT and skeletal muscle (Figure 5B). Adoptive transfer of TH1 cells also increased expression of MCP-1 and RANTES in PGAT and transcription levels of TNF-α and RANTES in skeletal muscle compared to HFD-fed TCRb−/− PBS-injected controls. MHC II gene expression was also higher in PGAT and skeletal muscle of TCRb−/− mice after transfer (Figure 5B). These results were consistent with our in vitro data. 3T3-L1 adipocytes stimulated with TH1-conditioned medium for 48 hours showed a reduction in mRNA levels of adiponectin and marked increase in MCP-1, RANTES, and IL-6 compared to untreated controls (Supplementary Figure 8A). Similar to 3T3-L1, treatment of differentiated C2C12 myotubes with TH1-conditioned medium for 48 hours significantly upregulated MCP-1, RANTES, IL-6, and TNF-α (Supplementary Figure 8B). Naïve CD4+T cell–conditioned medium did not affect adipocytes or muscle cells, suggesting that the detrimental effects of treatment are TH1 cell specific. Final concentration of IFN-γ in diluted TH1-conditioned medium, which was used to treat 3T3-L1 and C2C12 cells, was calculated to be 10 ng/ml.
Figure 5. TH1 adoptive cell transfer reverses metabolic characteristics of HFD-fed TCRb−/− mice.
(A) Representative histograms and flow cytometry result summary showing the homing of TH1 cells into spleen, PGAT, and skeletal muscle of HFD-fed TCRb−/− mice after adoptive transfer (n=3–4 mice/group). (B) Inflammatory gene expression in PGAT and skeletal muscle of HFD-fed TCRb−/− mice injected with PBS or TH1 cells (n=5 mice/group). (C) Fasting glucose and (D) insulin tolerance test in HFD-fed TCRb−/− mice after 12 weeks of adoptive TH1 cell transfer (n=8 mice/group). Panels A and B are shown as mean±SEM; panels C and D are shown as mean±SD of 2 separate experiments. *P<0.05, **P<0.01, ***P<0.001.
TH1 adoptive transfer resulted in elevated fasting glucose levels in obese TCRb−/− mice (Figure 5C). In addition, a statistically significant difference in ITTs was observed between HFD-fed TCRb−/− PBS and TH1 treatment groups (Figure 5D). These results indicate that TH1 cells initiate adipose tissue and skeletal muscle inflammation and induce hyperglycemia and insulin resistance.
DISCUSSION
Our results showed the important contribution of αβ T cells and TH1 cells to obesity-induced skeletal muscle and adipose tissue inflammation and insulin resistance. HFD-fed mice deficient in αβ T cells were protected from obesity-induced insulin resistance. Improved glucose metabolism was associated with reduced skeletal muscle and adipose tissue inflammation and decreased macrophage infiltration compared with WT age-matched controls. In addition, TH1 cell content was higher in skeletal muscle and adipose tissue of mice with diet-induced obesity. Adoptive transfer of TH1 cells into HFD-fed TCRb−/− mice aggravated systemic insulin resistance and induced hyperglycemia. TH1 cells infiltrated adipose tissue and skeletal muscle after transfer and impaired adipocyte and myofiber metabolic functions.
αβ T cell deficiency resulted in improved inflammation and insulin sensitivity in adipose tissue. HFD-fed TCRb−/− mice had attenuated obesity-induced adipose tissue inflammatory gene expression. TNF-α, IL-6, and IFN-γ, known to suppress insulin signaling (9, 11, 21, 22), as well as MCP-1 and RANTES, which are potent chemokines mediating blood monocyte and T lymphocyte migration (23, 24), were lower in obese TCRb−/− mice. These data are consistent with decreased adipose tissue macrophage and T cell accumulation and improved insulin signaling in PGAT of obese mice with αβ T cell deficiency.
Improved adipose tissue metabolic function paralleled elevated plasma adiponectin level in HFD-fed TCRb−/− mice. Adiponectin enhances insulin-stimulated glucose uptake and free fatty acid oxidation in skeletal muscle and improves insulin sensitivity in adipocytes (25). In addition, plasma NEFA and triglyceride levels were lower in HFD-fed TCRb−/− mice. Previous studies linked elevated NEFA with impaired peripheral glucose utilization and development of insulin resistance in obese individuals (26, 27). Long-term NEFA overload leads to triglyceride accumulation in insulin-sensitive tissues and induces insulin resistance through inhibition of the IRS-1/phosphatidylinositol 3-kinase/Akt pathway (28, 29). HFD-fed TCRb−/− mice had reduced triglyceride deposition in liver attributable to lower NEFA levels, which resulted in improved insulin sensitivity in liver and contributed to improved systemic glucose metabolism in these mice. Attenuated plasma NEFA levels also caused decreased ectopic lipid deposition in skeletal muscle. Together with increased adiponectin, reduced triglycerides contributed to enhanced skeletal muscle insulin signaling and, therefore, improved systemic insulin resistance.
Elevated NEFAs in obesity reflect defective triglyceride storage function in adipose tissue. Previous studies have shown suppression of lipid accumulation in adipocytes in obese adipose tissue (30). In our study, histological analysis revealed increased adipocyte size in PGAT of obese TCRb−/− mice compared to controls. Larger adipocytes in αβ T cell–deficient mice were consistent with increased PGAT weight in these mice despite similar body weight gain of TCRb−/− and WT mice. In contrast to other reports (1, 31), in which adipocyte hypertrophy led to macrophage accumulation and adipose tissue inflammation, our findings indicated that PGAT of HFD-fed TCRb−/− mice was characterized by reduced inflammation and improved insulin sensitivity. We thus demonstrated that adipocyte hypertrophy in the absence of αβ T cells was not associated with increased inflammation in adipose tissue. Similar results were shown in Tbet−/− mice and Mgl1−/− mice on HFD that had higher adipose tissue weight with significantly increased adipocyte diameter despite reduced adipose tissue inflammation and improved systemic insulin sensitivity (32, 33). Although small adipocytes are considered beneficial during the progression of obesity, histological observations of adipocytes of TCRb−/− mice were performed at the established stage of obesity. Larger adipocytes of HFD-fed TCRb−/− mice may suggest enhanced capacity to store triglycerides compared to adipocytes from WT mice, which could further explain the attenuated plasma NEFA levels in HFD-fed TCRb−/− mice with reduced triglyceride accumulation in the liver and skeletal muscle.
Improved glucose and insulin tolerance in HFD-fed TCRb−/− mice may primarily reflect reduced inflammation in skeletal muscle, the major tissue responsible for glucose uptake (34, 35). Human studies revealed significantly higher macrophage numbers in muscle from obese subjects than from lean controls and correlation with body mass index (15). In combination with elevated NEFA, muscle macrophages increase proinflammatory cytokine expression and reduce insulin signaling (15, 36). However, the contribution of T cells to skeletal muscle inflammation is unknown. In our study, inflammatory gene expression and macrophage content were increased in skeletal muscle of obese mice. In addition, we made the novel discovery that obese skeletal muscle tissue has increased total T cells and αβ T cells, including CD8+ T cells and IFN-γ–producing CD4 cells. αβ T cell deficiency resulted in improved skeletal muscle inflammatory gene expression in HFD-fed mice. Reduced total T cells and αβ T cell in HFD-fed TCRb−/− mice was accompanied by decreased macrophage accumulation in skeletal muscle, suggesting a potential role of skeletal muscle T cells in macrophage recruitment. As a result, the levels of proinflammatory cytokines secreted by activated macrophages and T cells, such as TNFα, IL-6, and IFN-γ, were also decreased, resulting in improved skeletal muscle insulin sensitivity. Attenuated skeletal muscle inflammation may be attributable to both decreased T cell and macrophage infiltration and reduced ectopic lipid deposition, and this may explain why the level of inflammatory gene expression in skeletal muscle of obese TCRb−/− mice was comparable to that of lean mice.
Similar to findings in adipose tissue, our flow cytometry analysis showed marked increase in TH1 cells in skeletal muscle tissue of obese WT mice. We also demonstrated higher mRNA level of IFN-γ, the main cytokine produced by activated T cells. Elevated IL-2 and IL-12β expression further suggested that obese skeletal muscle milieu promotes TH1 cell proliferation. We found increased expression of the transcriptional regulator of the MHC II pathway (CIITA) and MHC II invariant chain (CD74) in skeletal muscle of obese WT mice, which is important for differentiation of naïve CD4+ T cells into TH1 cells (37, 38). This finding suggests that macrophages in skeletal muscle may induce IFN-γ production in CD4+ T cells via the MHC II pathway. The upregulation of MHC II may imply the involvement of obesity-associated antigenic protein that promotes T cell activation in both adipose tissue and skeletal muscle.
Based on our findings showing obesity-induced TH1 accumulation in adipose tissue and skeletal muscle of obese mice, as well as previous reports demonstrating higher TH1 cell content in adipose tissue (17, 19), we hypothesized that the absence of TH1 cells in αβ T cell–deficient mice partially accounts for improved adipose tissue and skeletal muscle inflammation and systemic insulin resistance. Adoptive transfer of in vitro–cultured TH1 cells into HFD-fed TCRb−/− mice aggravated systemic insulin resistance and restored fasting glucose to levels observed in obese WT animals. Impaired glucose metabolism likely resulted from increased inflammation in PGAT and skeletal muscle induced by infiltrating TH1 cells.
Pathogenic effects of TH1 cells might be mediated by secretion of proinflammatory cytokines, which could impair adipocyte and skeletal muscle cell metabolic functions. Our in vitro studies demonstrated that TH1 directly modulates the inflammatory state of 3T3-L1 adipocytes and C2C12 skeletal muscle cells. Culturing 3T3-L1 cells with TH1 cell secretory products dramatically upregulated inflammatory mediators and reduced adiponectin mRNA level. In addition, we observed the ability of TH1 cells to inhibit lipid accumulation in mature 3T3-L1 (data not shown). These data may explain the improved lipid storage in adipose tissue of obese TCRb−/− mice, which had larger adipocytes. We also made the novel discovery that TH1 cells induced inflammation in C2C12 myotubes. The results of our in vitro studies further support the hypothesis that increased adipocyte size and reduced inflammation in adipose tissue and skeletal muscle in HFD-fed TCRb−/− mice may be attributed to the absence of TH1 cells. These results are also consistent with improved glucose tolerance and adipose tissue inflammation despite increased visceral adiposity in obese mice deficient in T-bet (32).
Conclusions
We thus showed that improved metabolic characteristics of HFD-fed TCRb−/− mice despite the absence of anti-inflammatory TH2 and Treg cells may be attributed to TH1 cell deficiency. Nevertheless, we cannot ignore the potential contribution of CD8+ T cells, which can also produce IFN-γ and are absent in obese TCRb−/− mice. Our findings are relevant to human data showing increased TH1 content in obese adipose tissue (39, 40), as well as higher frequency of hypertriglyceridemia and hyperglycemia in patients treated with IFN-γ, the main TH1 cytokine (41).
Supplementary Material
Skeletal muscle of obese mice had higher αβ T cells, including TH1 cells
Obese αβ T cell deficient mice had reduced skeletal muscle inflammation
TH1 cell adoptive transfer impaired insulin tolerance in αβ T cell deficient mice
TH1 cells induced inflammation in skeletal muscle
Acknowledgments
Sources of funding: This work was supported by NIH grants T32 GM88129 and T32 HL007812 (to I.M.K), R01HL098839 (to H.W.), and R01DK078847 (to C.M.B.).
The authors thank Kerrie Jara (Baylor College of Medicine) for editorial assistance and Leif Peterson (The Methodist Hospital) for his help with statistical analysis.
Footnotes
Conflict of interest: The authors declare no conflict of interest.
Publisher's Disclaimer: This is a PDF file of an unedited manuscript that has been accepted for publication. As a service to our customers we are providing this early version of the manuscript. The manuscript will undergo copyediting, typesetting, and review of the resulting proof before it is published in its final citable form. Please note that during the production process errors may be discovered which could affect the content, and all legal disclaimers that apply to the journal pertain.
References
- 1.Xu H, Barnes GT, Yang Q, Tan G, Yang D, Chou CJ, et al. Chronic inflammation in fat plays a crucial role in the development of obesity-related insulin resistance. J Clin Invest. 2003;112:1821–1830. doi: 10.1172/JCI19451. [DOI] [PMC free article] [PubMed] [Google Scholar]
- 2.Lumeng CN, Bodzin JL, Saltiel AR. Obesity induces a phenotypic switch in adipose tissue macrophage polarization. J Clin Invest. 2007;117:175–184. doi: 10.1172/JCI29881. [DOI] [PMC free article] [PubMed] [Google Scholar]
- 3.Weisberg SP, McCann D, Desai M, Rosenbaum M, Leibel RL, Ferrante AW., Jr Obesity is associated with macrophage accumulation in adipose tissue. J Clin Invest. 2003;112:1796–1808. doi: 10.1172/JCI19246. [DOI] [PMC free article] [PubMed] [Google Scholar]
- 4.Kintscher U, Hartge M, Hess K, Foryst-Ludwig A, Clemenz M, Wabitsch M, et al. T-lymphocyte infiltration in visceral adipose tissue: a primary event in adipose tissue inflammation and the development of obesity-mediated insulin resistance. Arterioscler Thromb Vasc Biol. 2008;28:1304–1310. doi: 10.1161/ATVBAHA.108.165100. [DOI] [PubMed] [Google Scholar]
- 5.Rausch ME, Weisberg S, Vardhana P, Tortoriello DV. Obesity in C57BL/6J mice is characterized by adipose tissue hypoxia and cytotoxic T-cell infiltration. Int J Obes (Lond) 2008;32:451–463. doi: 10.1038/sj.ijo.0803744. [DOI] [PubMed] [Google Scholar]
- 6.Wu H, Ghosh S, Perrard XD, Feng L, Garcia GE, Perrard JL, et al. T-cell accumulation and regulated on activation, normal T cell expressed and secreted upregulation in adipose tissue in obesity. Circulation. 2007;115:1029–1038. doi: 10.1161/CIRCULATIONAHA.106.638379. [DOI] [PubMed] [Google Scholar]
- 7.Nishimura S, Manabe I, Nagasaki M, Eto K, Yamashita H, Ohsugi M, et al. CD8+ effector T cells contribute to macrophage recruitment and adipose tissue inflammation in obesity. Nat Med. 2009;15:914–920. doi: 10.1038/nm.1964. [DOI] [PubMed] [Google Scholar]
- 8.Wu H, Perrard XD, Wang Q, Perrard JL, Polsani VR, Jones PH, et al. CD11c expression in adipose tissue and blood and its role in diet-induced obesity. Arterioscler Thromb Vasc Biol. 2010;30:186–192. doi: 10.1161/ATVBAHA.109.198044. [DOI] [PMC free article] [PubMed] [Google Scholar]
- 9.Feinstein R, Kanety H, Papa MZ, Lunenfeld B, Karasik A. Tumor necrosis factor-alpha suppresses insulin-induced tyrosine phosphorylation of insulin receptor and its substrates. J Biol Chem. 1993;268:26055–26058. [PubMed] [Google Scholar]
- 10.Salles J, Tardif N, Landrier JF, Mothe-Satney I, Guillet C, Boue-Vaysse C, et al. TNFalpha gene knockout differentially affects lipid deposition in liver and skeletal muscle of high-fat-diet mice. J Nutr Biochem. 2012 doi: 10.1016/j.jnutbio.2011.12.001. [DOI] [PubMed] [Google Scholar]
- 11.Rocha VZ, Folco EJ, Sukhova G, Shimizu K, Gotsman I, Vernon AH, et al. Interferon-gamma, a Th1 cytokine, regulates fat inflammation: a role for adaptive immunity in obesity. Circ Res. 2008;103:467–476. doi: 10.1161/CIRCRESAHA.108.177105. [DOI] [PMC free article] [PubMed] [Google Scholar]
- 12.Guilherme A, Virbasius JV, Puri V, Czech MP. Adipocyte dysfunctions linking obesity to insulin resistance and type 2 diabetes. Nat Rev Mol Cell Biol. 2008;9:367–377. doi: 10.1038/nrm2391. [DOI] [PMC free article] [PubMed] [Google Scholar]
- 13.Saltiel AR. New perspectives into the molecular pathogenesis and treatment of type 2 diabetes. Cell. 2001;104:517–529. doi: 10.1016/s0092-8674(01)00239-2. [DOI] [PubMed] [Google Scholar]
- 14.Hong EG, Ko HJ, Cho YR, Kim HJ, Ma Z, Yu TY, et al. Interleukin-10 prevents diet-induced insulin resistance by attenuating macrophage and cytokine response in skeletal muscle. Diabetes. 2009;58:2525–2535. doi: 10.2337/db08-1261. [DOI] [PMC free article] [PubMed] [Google Scholar]
- 15.Varma V, Yao-Borengasser A, Rasouli N, Nolen GT, Phanavanh B, Starks T, et al. Muscle inflammatory response and insulin resistance: synergistic interaction between macrophages and fatty acids leads to impaired insulin action. Am J Physiol Endocrinol Metab. 2009;296:E1300–1310. doi: 10.1152/ajpendo.90885.2008. [DOI] [PMC free article] [PubMed] [Google Scholar]
- 16.Feuerer M, Herrero L, Cipolletta D, Naaz A, Wong J, Nayer A, et al. Lean, but not obese, fat is enriched for a unique population of regulatory T cells that affect metabolic parameters. Nat Med. 2009;15:930–939. doi: 10.1038/nm.2002. [DOI] [PMC free article] [PubMed] [Google Scholar]
- 17.Winer S, Chan Y, Paltser G, Truong D, Tsui H, Bahrami J, et al. Normalization of obesity-associated insulin resistance through immunotherapy. Nat Med. 2009;15:921–929. doi: 10.1038/nm.2001. [DOI] [PMC free article] [PubMed] [Google Scholar]
- 18.Wong N, Fam BC, Cempako GR, Steinberg GR, Walder K, Kay TW, et al. Deficiency in interferon-gamma results in reduced body weight and better glucose tolerance in mice. Endocrinology. 152:3690–3699. doi: 10.1210/en.2011-0288. [DOI] [PubMed] [Google Scholar]
- 19.Strissel KJ, DeFuria J, Shaul ME, Bennett G, Greenberg AS, Obin MS. T-cell recruitment and Th1 polarization in adipose tissue during diet-induced obesity in C57BL/6 mice. Obesity (Silver Spring) 2010;18:1918–1925. doi: 10.1038/oby.2010.1. [DOI] [PMC free article] [PubMed] [Google Scholar]
- 20.Fitch FW, Gajewski TF, Hu-Li J. Production of TH1 and TH2 cell lines and clones. Curr Protoc Immunol. 2006;Chapter 3(Unit 3):13. doi: 10.1002/0471142735.im0313s72. [DOI] [PubMed] [Google Scholar]
- 21.Hotamisligil GS, Shargill NS, Spiegelman BM. Adipose expression of tumor necrosis factor-alpha: direct role in obesity-linked insulin resistance. Science. 1993;259:87–91. doi: 10.1126/science.7678183. [DOI] [PubMed] [Google Scholar]
- 22.Rieusset J, Bouzakri K, Chevillotte E, Ricard N, Jacquet D, Bastard JP, et al. Suppressor of cytokine signaling 3 expression and insulin resistance in skeletal muscle of obese and type 2 diabetic patients. Diabetes. 2004;53:2232–2241. doi: 10.2337/diabetes.53.9.2232. [DOI] [PubMed] [Google Scholar]
- 23.Gunn MD, Nelken NA, Liao X, Williams LT. Monocyte chemoattractant protein-1 is sufficient for the chemotaxis of monocytes and lymphocytes in transgenic mice but requires an additional stimulus for inflammatory activation. J Immunol. 1997;158:376–383. [PubMed] [Google Scholar]
- 24.Schall TJ, Bacon K, Toy KJ, Goeddel DV. Selective attraction of monocytes and T lymphocytes of the memory phenotype by cytokine RANTES. Nature. 1990;347:669–671. doi: 10.1038/347669a0. [DOI] [PubMed] [Google Scholar]
- 25.Fasshauer M, Paschke R, Stumvoll M. Adiponectin, obesity, and cardiovascular disease. Biochimie. 2004;86:779–784. doi: 10.1016/j.biochi.2004.09.016. [DOI] [PubMed] [Google Scholar]
- 26.Santomauro AT, Boden G, Silva ME, Rocha DM, Santos RF, Ursich MJ, et al. Overnight lowering of free fatty acids with Acipimox improves insulin resistance and glucose tolerance in obese diabetic and nondiabetic subjects. Diabetes. 1999;48:1836–1841. doi: 10.2337/diabetes.48.9.1836. [DOI] [PubMed] [Google Scholar]
- 27.Reaven GM, Hollenbeck C, Jeng CY, Wu MS, Chen YD. Measurement of plasma glucose, free fatty acid, lactate, and insulin for 24 h in patients with NIDDM. Diabetes. 1988;37:1020–1024. doi: 10.2337/diab.37.8.1020. [DOI] [PubMed] [Google Scholar]
- 28.Dresner A, Laurent D, Marcucci M, Griffin ME, Dufour S, Cline GW, et al. Effects of free fatty acids on glucose transport and IRS-1-associated phosphatidylinositol 3-kinase activity. J Clin Invest. 1999;103:253–259. doi: 10.1172/JCI5001. [DOI] [PMC free article] [PubMed] [Google Scholar]
- 29.Saltiel AR, Kahn CR. Insulin signalling and the regulation of glucose and lipid metabolism. Nature. 2001;414:799–806. doi: 10.1038/414799a. [DOI] [PubMed] [Google Scholar]
- 30.Suganami T, Ogawa Y. Adipose tissue macrophages: their role in adipose tissue remodeling. J Leukoc Biol. 2010;88:33–39. doi: 10.1189/jlb.0210072. [DOI] [PubMed] [Google Scholar]
- 31.Cinti S, Mitchell G, Barbatelli G, Murano I, Ceresi E, Faloia E, et al. Adipocyte death defines macrophage localization and function in adipose tissue of obese mice and humans. J Lipid Res. 2005;46:2347–2355. doi: 10.1194/jlr.M500294-JLR200. [DOI] [PubMed] [Google Scholar]
- 32.Stolarczyk E, Vong CT, Perucha E, Jackson I, Cawthorne MA, Wargent ET, et al. Improved Insulin Sensitivity despite Increased Visceral Adiposity in Mice Deficient for the Immune Cell Transcription Factor T-bet. Cell Metab. 2013;17:520–533. doi: 10.1016/j.cmet.2013.02.019. [DOI] [PMC free article] [PubMed] [Google Scholar]
- 33.Westcott DJ, Delproposto JB, Geletka LM, Wang T, Singer K, Saltiel AR, et al. MGL1 promotes adipose tissue inflammation and insulin resistance by regulating 7/4hi monocytes in obesity. J Exp Med. 2009;206:3143–3156. doi: 10.1084/jem.20091333. [DOI] [PMC free article] [PubMed] [Google Scholar]
- 34.Petersen KF, Shulman GI. Pathogenesis of skeletal muscle insulin resistance in type 2 diabetes mellitus. Am J Cardiol. 2002;90:11G–18G. doi: 10.1016/s0002-9149(02)02554-7. [DOI] [PubMed] [Google Scholar]
- 35.DeFronzo RA, Tripathy D. Skeletal muscle insulin resistance is the primary defect in type 2 diabetes. Diabetes Care. 2009;32(Suppl 2):S157–163. doi: 10.2337/dc09-S302. [DOI] [PMC free article] [PubMed] [Google Scholar]
- 36.Pillon NJ, Bilan PJ, Fink LN, Klip A. Cross-talk between skeletal muscle and immune cells: muscle-derived mediators and metabolic implications. Am J Physiol Endocrinol Metab. 2013;304:E453–465. doi: 10.1152/ajpendo.00553.2012. [DOI] [PubMed] [Google Scholar]
- 37.Deng T, Lyon CJ, Minze LJ, Lin J, Zou J, Liu JZ, et al. Class II Major Histocompatibility Complex Plays an Essential Role in Obesity-Induced Adipose Inflammation. Cell Metab. 2013;17:411–422. doi: 10.1016/j.cmet.2013.02.009. [DOI] [PMC free article] [PubMed] [Google Scholar]
- 38.Morris DL, Cho KW, Delproposto JL, Oatmen KE, Geletka LM, Martinez-Santibanez G, et al. Adipose Tissue Macrophages Function as Antigen Presenting Cells and Regulate Adipose Tissue CD4+ T Cells in Mice. Diabetes. 2013 doi: 10.2337/db12-1404. [DOI] [PMC free article] [PubMed] [Google Scholar]
- 39.Zeyda M, Huber J, Prager G, Stulnig TM. Inflammation correlates with markers of T-cell subsets including regulatory T cells in adipose tissue from obese patients. Obesity (Silver Spring) 2011;19:743–748. doi: 10.1038/oby.2010.123. [DOI] [PubMed] [Google Scholar]
- 40.Surendar J, Mohan V, Rao MM, Babu S, Aravindhan V. Increased levels of both Th1 and Th2 cytokines in subjects with metabolic syndrome (CURES-103) Diabetes Technol Ther. 2011;13:477–482. doi: 10.1089/dia.2010.0178. [DOI] [PubMed] [Google Scholar]
- 41.Mahrle G, Schulze HJ. Recombinant interferon-gamma (rIFN-gamma) in dermatology. J Invest Dermatol. 1990;95:132S–137S. doi: 10.1111/1523-1747.ep12875030. [DOI] [PubMed] [Google Scholar]
Associated Data
This section collects any data citations, data availability statements, or supplementary materials included in this article.


