Abstract
Contrast-enhanced intravascular ultrasound imaging is a promising tool for the characterization of coronary vasa vasorum proliferation, which has been identified as a marker of, and possible etiologic factor in, the development of high-risk atherosclerotic plaques. Resonance-based nonlinear detection methods have required the development of prototype catheters which are not commercially available, thus limiting clinical translation. In this study, we investigated the performances of a radial modulation imaging approach (25/3 MHz combination) using simulations, implemented it on a clinical 20-MHz rotating catheter, and tested it in a wall-less tissue-mimicking flow phantom perfused with lipid-encapsulated microbubbles (MBs). The effects of the phase lag, low-frequency pressure, and MB concentration on the envelope subtracted radial modulation signals were investigated as a function of depth. Our dual-pulse dual-frequency approach produced contrast-specific images with contrast-to-tissue improvements over B-mode of 15.1 ± 2.1 dB at 2 mm and 6.8 ± 0.1 dB at 4 mm depths. Using this imaging strategy, 200-μm-diameter cellulose tubing perfused with MBs could be resolved while surrounding tissue scattering was suppressed. These results raise promise for the detection of coronary vasa vasorum and may ultimately facilitate the detection of plaque at risk for rupture.
I. Introduction
In patients with coronary artery disease, acute coronary syndromes account for up to 70% of deaths [1]. The predictors of progression of an asymptomatic fibroatheromatous plaque into a vulnerable plaque that ruptures and causes an acute coronary syndrome are poorly diagnosed and not fully understood [2]. In most cases, the culprit lesions responsible for an acute coronary syndrome are not flow-limiting on coronary angiography, underscoring the poor ability of current imaging technologies to prospectively stratify patients at greatest risk for future acute coronary syndromes.
Post-mortem histological data document that vasa vasorum (VV; nomenclature used in this paper is provided in Table I) proliferation and intraplaque hemorrhage are critical processes in the progression from asymptomatic into high-risk unstable lesions [3]–[6]. VV are vessels that normally provide vascular supply to the blood vessel wall. During atherogenesis, there is abnormal adventitial VV proliferation and intraplaque neovascularization [7]. Increased VV density is strongly associated with plaque rupture and other features of vulnerable plaque, such as a thin fibrous cap, a large necrotic core, and intraplaque hemorrhage [3], [8], [9]. Conversely, it has also been shown that anti-angiogenic drug rPAI-1 treatment [10] and HMG-CoA reductase inhibitors (statins) [11], [12] reduced adventitial VV density and plaque extent, suggesting that VV could be implicated in plaque progression [3], [9], [13], [14]. These findings suggest that VV and plaque neovascularization are both markers of, and etiologic factors in, the development of high-risk atherosclerotic plaques, creating a rationale and need for the development of approaches to detect coronary VV in vivo.
TABLE I.
List of Abbreviations.
| CEUS | Contrast-enhanced ultrasound | |
| CTRRM | Contrast-to-tissue ratio in RM-mode | |
| CTRB-mode | Contrast-to-tissue ratio in B-mode | |
| CTRI | Contrast-to-tissue ratio improvement of RM-mode over B-mode | |
|
|
Optimal difference in backscattered power caused by RM for an MB of size Ri | |
|
|
Simulated difference in backscattered power caused by RM for an MB of size Ri | |
|
|
Simulated difference in backscattered power caused by RM for a populations of MB | |
|
|
Simulated difference in backscattered power caused by RM for a Gaussian population of MB, normalized to the mean backscattering power during HF1 and HF2 | |
|
|
Experimental difference in backscattered power caused by RM for a population of MB, normalized to the mean B-mode power of HF1 and HF2 | |
| HF | High frequency | |
| IVUS | Intravascular ultrasound | |
| LF | Low frequency | |
| MB | Microbubble | |
| R | Microbubble radius | |
| RM | Radial modulation | |
| VV | Vasa vasorum |
Contrast-enhanced ultrasound (CEUS) imaging using microbubbles (MBs) is an established modality for VV imaging in the carotids [15]–[18]. It was recently shown that levels of VV and plaque neovascularization detected on CEUS carotid imaging correlate with cardiovascular disease and cardiovascular events [18], [19]. Although nonlinear-based CEUS carotid imaging may have the potential to provide an overall measure of proneness to cardiovascular events, it cannot directly visualize VV of specific plaques within the coronary arterial tree. For coronary wall imaging, contrast-enhanced intravascular ultrasound (IVUS) is capable of detecting and spatially resolving VV in the coronary arterial wall in vivo using linear [20] and nonlinear approaches [21], [22]. The linear approach, which relies on the sequential analysis of consecutive video frames upon the injection of a microbubble bolus, is inherently susceptible to motion artifacts and suffers from a poor contrast-to-tissue ratio. Interestingly, nonlinear subharmonic and second-harmonic approaches have been shown to improve the contrast-to-tissue ratios in vitro and in atherosclerotic rabbit models compared with B-mode imaging. Recently, an ultraharmonic approach using a prototype catheter has also shown promising results [23]. However, these technologies require the use of prototype catheters that are not commercially available. Moreover, a commercial contrast-enhanced IVUS imaging platform does not exist, underscoring the necessity to develop new approaches for high-frequency contrast imaging.
Radial modulation (RM) [24]–[30] is a dual-frequency technique in which a low-frequency (LF) pulse, also called the modulation frequency, is used to manipulate the microbubble size, while high-frequency (HF) scattering variations in amplitude and/or phase are monitored. One implementation of RM imaging consists of synchronizing two successive short HF pulses such that they reach the MB when the MB is in a compressed and an expanded state, as induced by the LF pressure wave. By subtracting successive high-pass filtered HF scattered lines, this dual-pulse, dual-frequency approach results in an MB-specific RM image, in which tissue scattering is suppressed because it is minimally affected by the LF modulation pulse. RM imaging is particularly advantageous because unlike nonlinear approaches such as second-harmonic or subharmonic imaging, it decouples the MB size from the imaging frequency, which can thus be increased for improved spatial resolution required for applications such as IVUS. RM imaging systems have been implemented with a modified clinical scanner operating at lower frequencies (7.5/0.9 MHz combination) [28] and a high-frequency ultrasound scanner (VisualSonics 770- 20/3.7 MHz combination, VisualSonics Inc., Toronto, ON, Canada) [27]. RM imaging has been reported to achieve up to 40 dB of contrast-to-tissue ratio in a porcine kidney perfusion model [28] and could be well-suited for IVUS contrast imaging.
In this study, we sought to develop a dual-frequency IVUS imaging system based on microbubble radial modulation using a commercial single-element rotating catheter, capable of contrast-specific imaging at high resolution by transmitting both low- (3 MHz) and high- (25 MHz) frequency pulses. We first studied the effects of microbubble size distribution and HF/LF phase lag (relative position of the HF in the LF pulse) on the amplitude and polarity of RM-induced differences in HF backscattered power, using numerical simulations. Our RM IVUS imaging system was then implemented and its performances were evaluated in a wall-less tissue-mimicking phantom perfused with microbubbles. We quantified the effects of the phase lag on the amplitude and polarity of RM-induced difference in HF backscattered power and compared it with the simulation results. We then characterized our system in terms of contrast-to-tissue ratio and contrast-to-tissue ratio improvement as a function of depth, LF pressure, and MB concentration for envelope-subtracted RM imaging. Potential motion artifacts were studied by imaging anticoagulated blood at 30 frames/s in the flow phantom at physiological flow conditions. Finally, we investigated the ability of envelope-subtracted RM imaging for the detection of MBs circulating in 200-μm cellulose microtubes embedded in tissue-mimicking material.
II. Methods
A. Simulations
The MB oscillations in response to LF pulses (5-cycle, 3 MHz) of increasing amplitudes (90 to 260 kPa) were first calculated using thin-shelled microbubble oscillation theory. The simulation package Bubblesim [31] was used to compute the oscillations of MBs 1.5 to 10 μm in diameter. Shell viscosity was chosen as 0.8 Pa·s, shear modulus as 50 MPa, and shell thickness as 4 nm, corresponding to thin-shelled lipid-encapsulated MBs [31]. The Rayleigh–Plesset liquid model with radiation damping coupled to an isothermal gas phase was solved using the stiff variable ODE solver. The difference in HF backscattered power (P) from a pair of RM pulses is given by
| (1) |
At 25 MHz, the HF scattering cross section of MBs in the size range considered is proportional to the scatterer geometrical cross section (excitation frequency higher than MB resonance frequency) [32]. Hence, , the optimally synchronized RM difference in power for an MB of radius Ri is proportional to
| (2) |
where Ri,max and Ri,min are, respectively, the simulated bubble of radius Ri at maximal and minimal expansion and Iinc is the incident intensity. is found in simulations by searching for the maximum and minimum in simulated Ri(t). These simulations indicated the theoretical maximal for each MB size. They corresponded to a short HF pulse optimally placed on the LF manipulation pulse for each MB.
Because MBs of different sizes oscillate with different phases in response to the LF pulse [32], in practice for imaging, synchronizing the HF pulse to reach each individual MB at its maximal and minimal expansion is not possible for a polydispersed MB suspension. Furthermore, the HF imaging pulse has a finite duration, which extends over part of the LF pulse. Therefore, the amplitude and polarity of , the RM difference in time-averaged power (over the HF duration), for an MB of size Ri, was investigated by simulation, using a 2.5-cycle, 25-MHz HF imaging pulse positioned at different phase lags in a 5-cycle, 3-MHz LF pulse. For each HF/LF phase lag (a phase lag of 0 corresponds to an HF1 pulse centered on LF1 phase 0, i.e., on LF1 negative-to-positive zero-crossing and correspondingly an HF2 pulse centered on LF2 positive-to-negative zero-crossing), was calculated as
| (3) |
where and are, respectively, proportional to the mean MB scattering power during HF pulse 1 and 2 for an MB of radius Ri. These simulations were performed for MB sizes ranging from 1.5 to 10 μm and phase lags covering one LF cycle. represents the contribution of an MB of radius Ri to the difference of HF backscattered power between a pair of RM pulses produced by LF manipulation of the MB size.
Assuming incoherent scattering, the total power for an MB population of mean μ and standard deviation σ can be expressed as
| (4) |
For comparison with experimental data, the RM power was normalized by the mean of the backscattered power from the population during exposure to LF1 and LF2:
| (5) |
where
The normalization conveniently eliminates Iinc from the equation, making dimensionless.
B. Flow Phantom
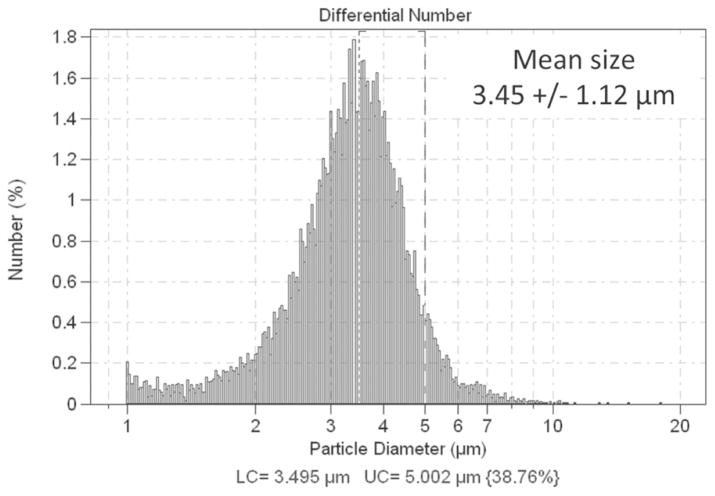
Phospholipid-encapsulated MBs containing perfluoro-carbon gas were prepared [33], measured by electrozone sensing (3.5 ± 1.1 μm in diameter, Fig. 1, Multisizer 3, Beckman Coulter Inc., Brea, CA), and circulated at a flow velocity of 0.5 cm/s in a 6-mm-diameter wall-less cylindrical agar-based phantom containing 0.5% Sigmacell cellulose (20-μm particles, Sigma-Aldrich Co. LLC, Saint Louis, MO) to mimic tissue scattering (Fig. 2). This phantom had an attenuation coefficient of 0.3 dB/MHz/cm (data not shown). A 20-MHz single-element rotating catheter (PZT, aperture 0.09 × 0.07 cm, Sonicath Ultra 3.2F, Boston Scientific Corp., Fremont, CA) was placed against the wall of the phantom to allow comparison of contrast and tissue signals as a function of depth. In a separate set of experiments, a similar 4-mm wall-less phantom also containing 0.5% Sigmacell was built and 200-μm cellulose microdialysis hollow fibers (Spectra/Por, Spectrum Laboratories Inc., Rancho Dominguez, CA) were placed in the phantom and perfused with microbubbles. Citrated porcine blood was also circulated at a mean velocity of 20 cm/s and imaged at a rotation speed of 30 Hz to assess the susceptibility of RM imaging to motion artifacts.
Fig. 1.
Size histogram (diameter) of the lipid encapsulated microbubbles used in this study, measured using a Coulter counter.
Fig. 2.
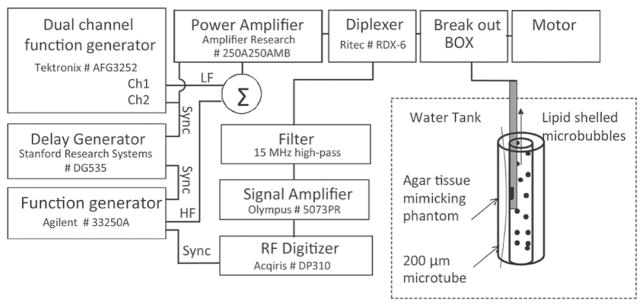
Experimental setup. RM excitation pulses were sent to the IVUS catheter positioned in a wall-less agar-based flow phantom perfused with lipid-encapsulated MB. Some 200-μm cellulose tubes were placed in the phantom and also perfused with MB.
C. RM System
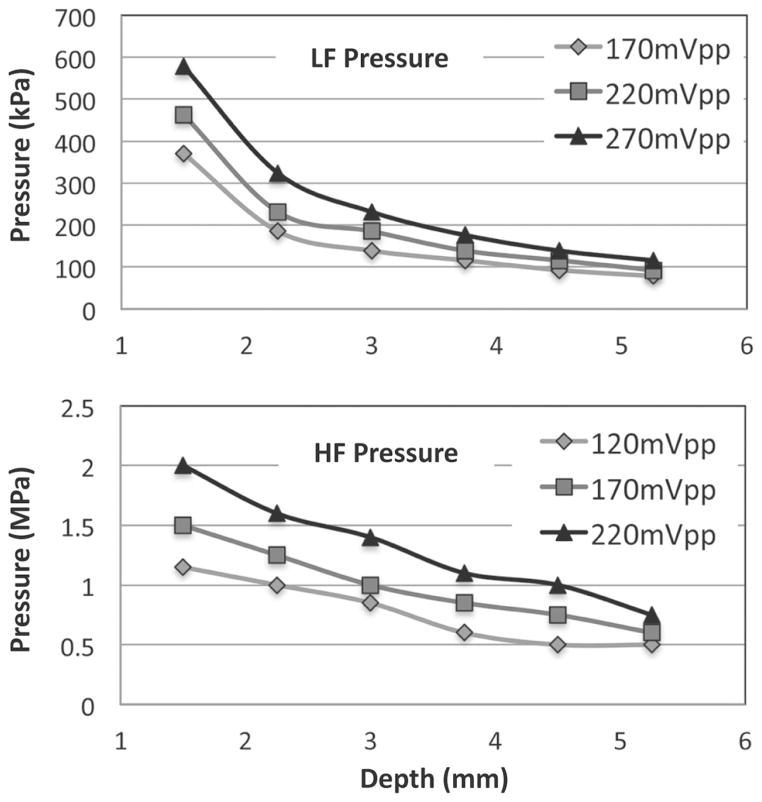
The RM system is based on a 20-MHz single-crystal catheter connected through a breakout box (provided by Boston Scientific) to custom pulsing and receiving electronics (Fig. 2) and to a standard motor rotating at 2.6 Hz, or to the Galaxy system (Boston Scientific) for rotation at 30 Hz. Two 5-cycle, 3 MHz LF pulses with inverted phases were generated on channel 1 of a dual-channel function generator (AFG3252, Tektronix Inc., Beaverton, OR), separated by a 14 μs interval. Channel 2 was used to generate two trigger signals used to gate the power amplifier (250A250AMB, Amplifier Research Corp., Souderton, PA) and to trigger a second function generator (33250A, Agilent Technologies Inc., Santa Clara, CA) that generated the 2.5-cycle, 25 MHz HF pulses. The HF signal trigger was relayed by a delay generator (Model DG535, Stanford Research Systems, Sunnyvale, CA), used for adjusting the HF/LF phase lag. The HF and LF pulses were then summed using a power splitter/combiner (ZSC-2-1W+, Mini-Circuits, Brooklyn, NY) and amplified by 55 dB by the power amplifier. Two diplexers (model RDX-6, Ritec Inc., Warwick, RI) were inserted in series to isolate electronic noise during reception. The excitation pressure pulses were measured using a 200-μm-aperture calibrated hydrophone (HGL-0200, Onda Corp., Sunnyvale, CA). LF and HF pressures are displayed as a function of distance in Fig. 3. A typical pair of dual-frequency RM pulses (phase lag of 0), measured by the hydrophone is shown in Fig. 4. Pairs of pulses were sent at a repetition rate of 416 Hz. The line density was 160 lines per image. On reception, the radio-frequency signal was amplified by 35 dB (5073PR, Olympus, Waltham, MA) and high-pass filtered (15 MHz). RF signals were digitized at a sampling frequency of 400 MHz (Acqiris DP310, Agilent Technologies Inc.) and stored for offline processing. RF data were then numerically band-pass filtered (first-order Butterworth, 20 to 25 MHz), corrected for distortion (see next section), and the envelope signals were subtracted to generate RM images. Finally, RM images were median filtered using a 15 × 3 pixel window before display and analysis. Because radiation force pushing MBs away from the catheter was noticed when the LF pulsing was turned on, each frame of data was acquired following a 5 s delay, ensuring replenishment of MB near the catheter.
Fig. 3.
Peak negative pressure of the 3 MHz manipulation pulse (LF) and high-frequency imaging pulse (HF) as a function of depth for three excitation voltages (before amplification). LF and HF pressure decreased as a function of depth.
Fig. 4.
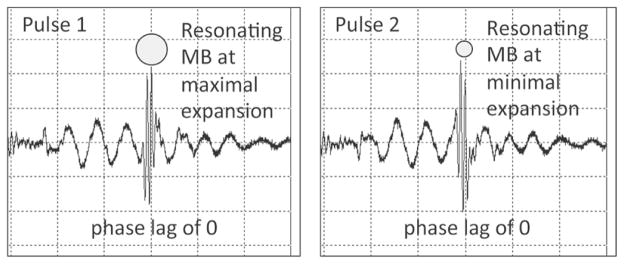
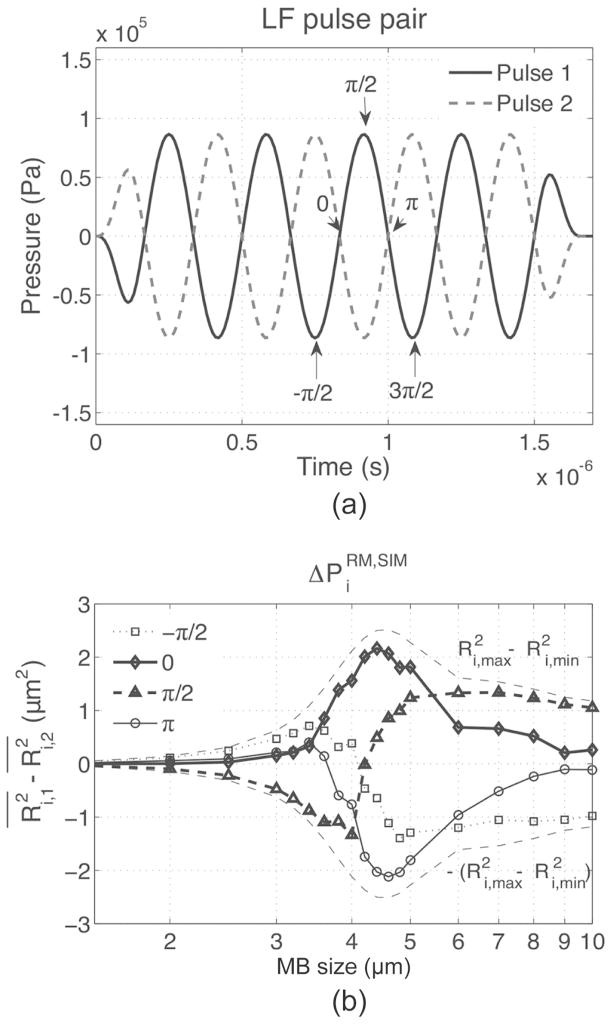
Hydrophone measurements showing a pair of pulses used for RM imaging, measured at 2 mm from catheter center. The HF pulse was centered at the third negative-to-positive zero crossing of LF pulse 1 and third positive-to-negative crossing of LF pulse 2. LF pulses have an inverted phase. HF pulses have the same phase. This corresponds to an HF/LF phase lag of 0.
D. Nonlinear Propagation of the RM Pulse Complex
It has been shown that the transmission of an LF/HF pulse complex can result in HF pulse delay and distortion [34], because the LF introduces variations in the propagation speed of the HF. These nonlinear propagation effects can result in a deterioration of tissue signal cancellation in RM imaging. The HF also causes delay and distortion in the LF, but it is of lesser concern in our imaging scheme and has not been considered in this study.
Delay is prominent when the HF is positioned at LF peaks and valleys (i.e., at phase lags of ± π/2). Delay caused by nonlinear propagation can be compensated using cross-correlation-based techniques [35].
Distortion is expected to be more important at phase lags of 0 and π, when the HF pulse is experiencing the strongest pressure gradient [34]. To address this, pulse distortion between each HF1 and HF2 line pair was compensated in the frequency domain, using a mean frequency drift calculated in tissue for each LF excitation amplitude and for each phase lag using |
 (HF1(t))|/|
 (HF2(t))|. It was found that this drift was independent of depth. The compensated signals were then inverse-Fourier transformed back into the time domain before envelope calculation and image subtraction.
E. Data Analysis
The effects of varying the phase lag, MB concentration, and LF amplitude were studied as a function of depth. Regions of interest (ROI) were manually drawn at increasing depths in the lumen and in the tissue in the acquired images. The effect of the phase lag on was evaluated using
| (6) |
where and are, respectively, the mean backscattered power (calculated in the spectral domain) in the −6-dB bandwidths of HF1 and HF2 in the ROI. This quantity, evaluated in large ROIs, is noisy with smaller ROIs, and is therefore not appropriate for imaging.
For RM imaging, a time-based subtraction of distortion-compensated pairs of envelope signals was performed to compute the RM signal:
| (7) |
where
 stands for the Hilbert transform. For B-mode imaging, sB-mode(t) was taken as the mean of HF1 and HF2 envelopes, which were obtained while transmitting LF:
| (8) |
In this way, the comparisons between RM- and B-modes were calculated on the same ROI in both modes. Regions of interest were manually drawn at increasing depths in the lumen (MB) and in the tissue (T) in the acquired images. They were used to compute the RM contrast-to-tissue ratio (CTRRM), B-mode CTR (CTRB-mode), and CTR improvement (CTRI), respectively using
| (9) |
| (10) |
| (11) |
where 〈〉ROI represents the average value in the ROI. Please note the use of signal envelopes for signal subtraction in the image formation process (7); this allowed investigation of the polarity of the RM signal before log compression. The CTRI is a parameter that measures the improvement in MB signal independently of MB concentration [21], [22], and allows comparison of performances with other MB imaging strategies, such as with subharmonic and second-harmonic imaging, for example. The presence of LF harmonics was also measured by passively recording signals backscattered in the HF band without transmitting HF pulses. Experiments were repeated three times (one time for phase experiment) and results are shown as mean ± standard deviation.
III. Results
A. Simulations
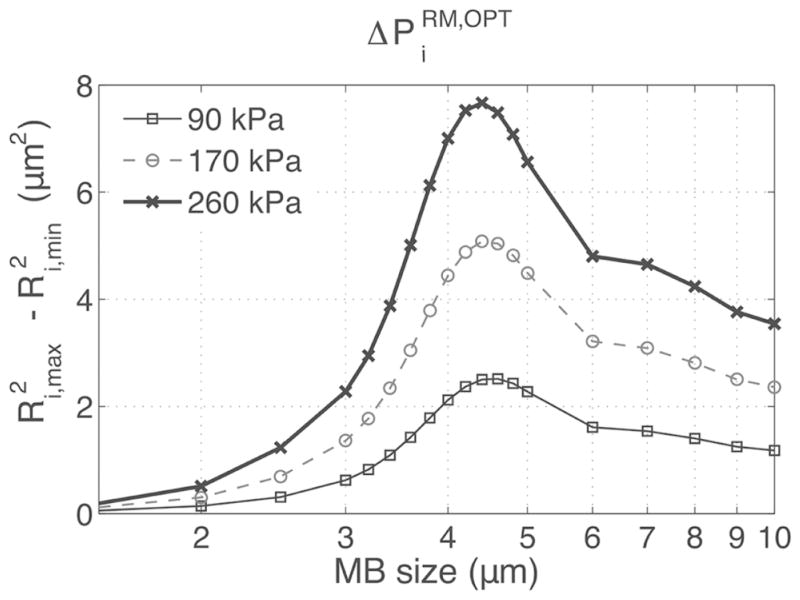
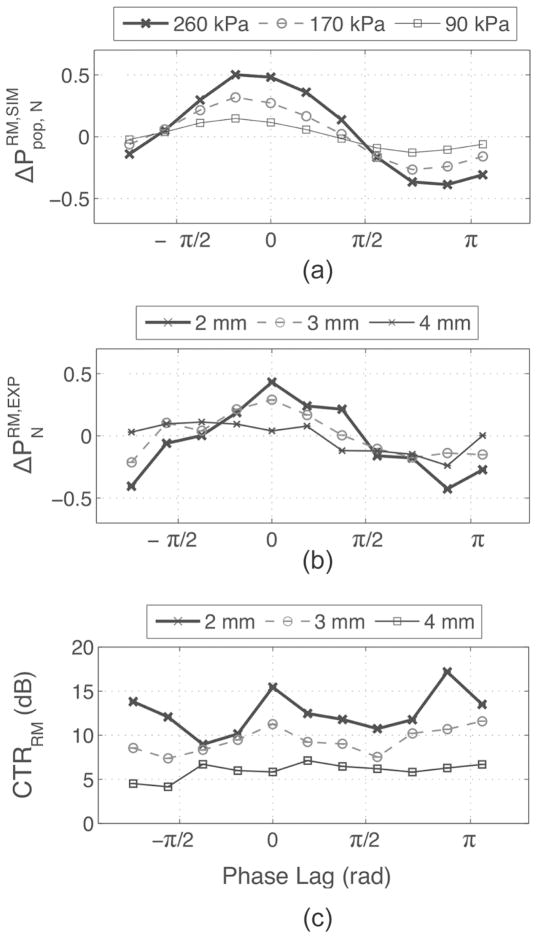
The difference in HF backscattered power from MBs exposed to an RM pair of pulses, , was first investigated by simulation using an LF of 3 MHz, for MBs with sizes varying from 1.5 to 10 μm. In Fig. 5, , which is proportional to , is plotted as a function of MB size and LF pressure. peaked for MB sizes around 4 μm and increased with LF pressure. However, in practice, MB sizes are polydispersed and a fixed HF timing must be chosen within the LF cycle for imaging. Therefore, the effect of varying the phase lag was also investigated by simulation as a function of MB size and is reported in Fig. 6. It can be seen that when HF is positioned at the LF pulse 1 positive peak, (i.e., π/2 phase lag), , which is proportional to , was negative for smaller MBs and positive for larger MBs. This is explained by the fact that smaller MBs are imaged by HF1 during compression and by HF2 during expansion, resulting in negative . Indeed, at 3 MHz, small MBs, which are driven below their resonance frequency, oscillate in phase with the pressure pulse (MB is compressed when pressure in high), whereas big MBs, driven above their resonance frequency, oscillate with opposite phase with respect to pressure (MB is expanded when pressure is high). This response is characteristic of a first-order damped oscillator [32]. Also, at a phase lag of π/2 [see Fig. 6(b)], MBs of resonant size (4 μm) are near equilibrium size when imaged with HF1 and HF2 and do not contribute to . can therefore be positive or negative at this phase lag, depending on the MB population distribution (a larger number of bigger MBs will result in net positive RM signal and vice versa). When the HF was positioned at the LF-pressure zero crossings (i.e., 0 and π phase lags), reached maximal amplitude—nearly 80% of for the 4-μm MB—and across all MB sizes were respectively either all positive or all negative. At phase lags of 0 and π, Fig. 6(b) also indicated that MB with sizes between 3.5 and 5 μm (−3-dB threshold) had the highest . In Fig. 7(a), is plotted using (5), as a function of the phase lag for LF pressures of 90, 170, and 260 kPa, assuming an MB population distributed normally (μ = 3.5; σ = 1.1, corresponding to the MB population used in the in vitro experiments). Assuming that the mean scattered power is dominated by incoherent scattering, increased with LF pressure, was positive for phase lags between −π/2 and π/2, and negative beyond that range. At phase lags of −π/2 and π/2, was close to 0.
Fig. 5.
The oscillations of MBs of sizes ranging from 1.5 to 10 μm were simulated using a 3 MHz 5-cycle LF pulse. The maximal and minimal MB expansions were determined using the Ri(t) response and used to calculate , which is proportional to [see (2)].
Fig. 6.
The phase lag was varied over one LF cycle [arrows in (a)] and the corresponding difference in HF scattered power was estimated by as a function of the MB size using (3) (b). determined in Fig. 5 is also reported in (b) for comparison.
Fig. 7.
(a) , (b) , and (c) CTRRM as functions of the phase lag for different LF pressures or depth. LF excitation amplitude was 220 mVpp and MB concentration of 6.4 × 105 MB/mL. Experimental pressures at 2, 3, and 4 mm were, respectively, 300, 190, and 120 kPa.
B. Distortion-Compensated RF Lines
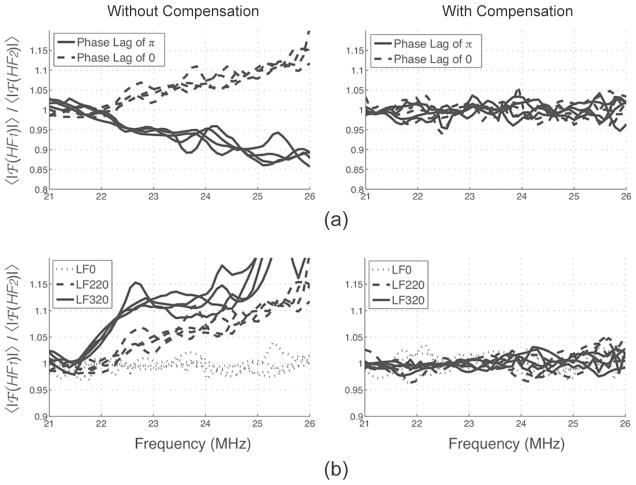
Distortion was found in our in vitro data. Distortion was strongest and of opposite sign at phase lags of 0 and π, and increased with LF pressure, as expected, but was independent of depth. For example, at a phase lag of 0, in tissue, the spectrum of HF1 presented an upshift in frequency (pulse compression) whereas the spectrum of HF2 presented a downshift in frequency (pulse expansion), as described in [34]. In Fig. 8, it can be seen that the phase lag and the LF pressure had a strong influence on the ratio of the averaged spectra of HF1 and HF2. Each line represents the averaged spectrum over ROIs taken in tissue at depths ranging from 2 to 5 mm. Interestingly, depth did not affect this ratio.
Fig. 8.
Effect of (a) the phase lag and (b) LF amplitude on the HF pulse spectra ratio before and after distortion compensation in tissue at depths of 2 to 5 mm. Distortion was depth-independent. LF excitation was fixed at 220 mVpp in (a) and phase lag was fixed at 0 in (b).
Distortion compensation, which corrected for this drift in frequency (Fig. 8), resulted in better tissue signal cancellation. In Fig. 9(a), a typical pair of HF lines and their envelopes, taken in tissue, is displayed before and after compensation. Arrows indicate areas where the compensation reduced the difference between HF1 and HF2 in tissue in RF and envelope signals. Fig. 9(b) displays RM images obtained before and after distortion compensation. Some speckle, present in the tissue before compensation (white arrows) disappeared after compensation. Averaged over areas chosen in MBs and tissue, distortion compensation typically improved CTR and CTRI by ~1 dB. This number is largely hindered by the sparse nature of the noise and does not give full justice to the improvements offered by compensating for distortion, which is clearly visible in tissue in Figs. 9(a) and 9(b). In our system, we did not see evidence of cumulative delay at any depth, phase lag, or LF pressure used, possibly because of the low LF pressures used and short propagation lengths. Delay was therefore not compensated for.
Fig. 9.
Typical pairs of (a) backscattered HF pulses in tissue and (b) RM-mode image before and after distortion compensation (excitation amplitude of 220 mVpp and a phase lag of 0). Arrows indicate speckle in the tissue that disappeared after distortion compensation.
C. In Vitro Experiment: The Effect of the Phase Lag
The HF/LF phase lag was first varied over one LF cycle using a fixed excitation amplitude of 220 mVpp and a fixed MB concentration 6.4 × 105 MB/mL. Fig. 7(b) shows at depths of 2, 3, and 4 mm, corresponding to pressures of 300, 190, and 120 kPa. behaved similarly to our simulations: increased with pressure, was positive at a phase lag between −π/2 and π/2, was negative beyond that range, and respectively reached maxima and minima near phase lags of 0 and π. Correspondingly, CTRRM peaked at phase lags of 0 and π. In Fig. 10(a), the polarities of RM images (subtraction of signal envelopes) are displayed before log compression. The polarity of the envelope-subtracted RM images was uniformly positive at a phase lag of 0 and uniformly negative at a phase lag of π, consistent with and [Figs. 7(a) and 7(b), respectively]. At phase lags of ± π/2, positive and negative pixels appeared next to each other, which is also consistent with a mean ΔP close to 0 in Figs. 7(a) and 7(b). Typical RF lines corresponding to the signal in MBs are shown in Fig. 10(b), and show positive (phase lag of 0), negative (phase lag of π), and mixed RM polarity (phase lag of ±π/2).
Fig. 10.
(a) Envelope-subtracted RM images before log compression and (b) typical corresponding pairs of HF RF lines and their envelopes in MB for different phase lags. RM signal in MB was positive at phase lag of 0, negative at π, and mixed at ± π/2.
D. In Vitro Experiment: Effect of LF Pressure
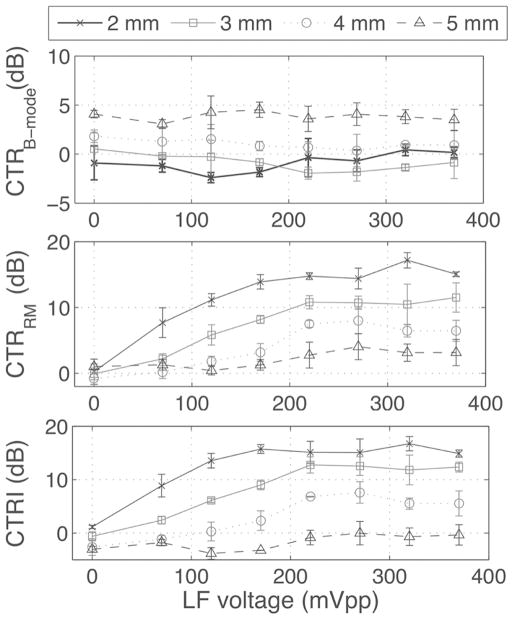
For this experiment, the phase lag was fixed at 0 and MB concentration was fixed at 6.4 × 105 MB/mL while the LF pressure was varied. CTRRM and CTRI increased with LF amplitude and decreased with depth (Fig. 11). CTRI plateaued at 220 mVpp. At this excitation amplitude, corresponding to 300 kPa at 2 mm (see Fig. 3), CTRRM was 14.8 ± 0.5 dB at 2 mm and 7.5 ± 0.5 dB at 4 mm. This corresponded to a CTRI of 15.1 ± 2.1 dB at 2 mm and 6.8 ± 0.1 dB at 4 mm (see Fig. 11). HF pulses were then turned off to quantify the infiltration of LF harmonics into the RM signal. LF harmonics are caused by MB nonlinear oscillations that propagate into the HF frequency band. This should be avoided because they deteriorate the spatial resolution of the image (harmonics are present for the duration of the MB LF oscillations, i.e., 5 LF cycles). LF harmonics appeared near the catheter (2 mm depth) and increased with LF pressure. At 220 mVpp excitation, harmonics accounted for 4.1 ± 1.0 dB of CTRRM and 2.8 ± 0.8 dB of CTRI at 2 mm and were close to 0 dB at other depths. At a higher excitation of 370 mVpp, harmonics increased to 8.3 ± 2.7 dB of CTRRM and 4.4 ± 3.6 dB of CTRI at 2 mm. CTRB-mode did not vary with LF amplitude but increased with depth (close to 0 dB for depths of 2 and 3 mm; up to 4 dB at 5 mm depth). In Fig. 12, the data from Fig. 11 has been replotted as a function of the LF pressure for all LF excitation amplitudes and depths. CTRRM generally increased with the LF pressure, as reflected by fitting the data to a linear regression with a Pearson correlation coefficient r of 0.8 (p < 0.001).
Fig. 11.
CTRB-mode, CTRRM, and CTRI as functions of LF excitation amplitude for different depths, with a phase lag of 0 and an MB concentration of 6.4 × 105 MB/mL. All parameters were calculated in ROI of 1 mm centered at 2, 3, 4, and 5 mm from the catheter center using (9)–(11). Measurements were repeated 3 times.
Fig. 12.
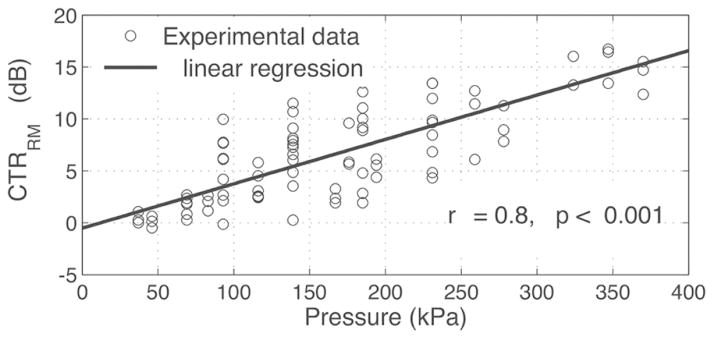
CTRRM increased as a function of the LF pressure. Linear regression has a Pearson correlation coefficient of 0.8 with p < 0.001.
E. In Vitro Experiment: The Effect of MB Concentration
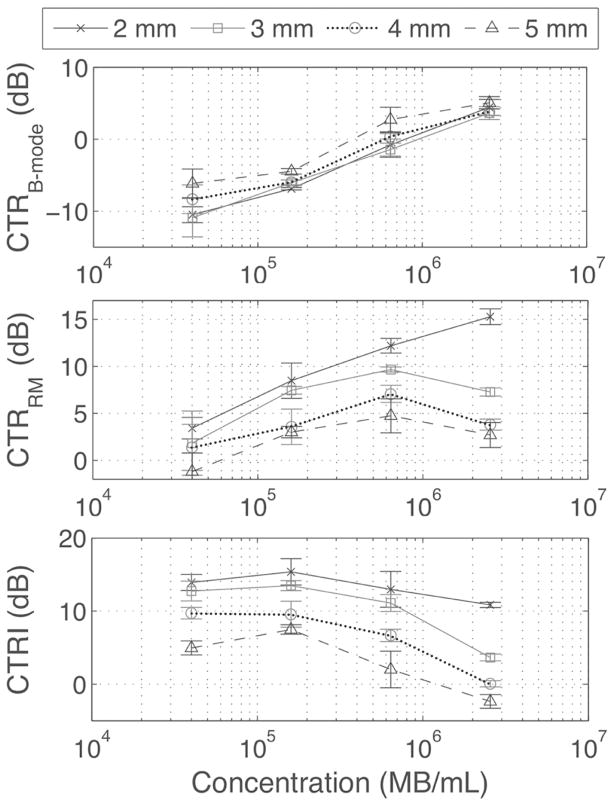
Finally, the phase lag was fixed at 0 and LF voltage at 220 mVpp (Fig. 13) while the MB concentration was varied. As expected, CTRB-mode increased with concentration at all depths. CTRRM increased with concentration at all depths except for the highest concentration at 3, 4, and 5 mm, where it decreased. CTRI was independent of MB concentration at low MB concentration, but the CTRI decreased to 2.4 × 106 MB/mL at depths of 3, 4, and 5 mm, because of attenuation of the LF.
Fig. 13.
CTRB-Mode, CTRRM, and CTRI as functions of MB concentration, with a fixed LF excitation amplitude of 220 mVpp and a phase lag of 0. All parameters were calculated in ROI of 1 mm centered at 2, 3, 4, and 5 mm from the catheter center using (9)–(11). Measurements were repeated 3 times.
F. B-Mode and RM-Mode Images
Typical examples of B-mode and RM images (phase lag of 0, LF amplitude of 220 mVpp and MB concentration of (a) 6.4 × 105 MB/mL and (b) 1.0 × 107 MB/mL) are shown in Fig. 14. In Fig. 14(a), MBs were circulated at a mean velocity of 0.5 cm/s and imaged at a catheter rotation speed of 2.6 Hz, corresponding to the experimental conditions in Figs. 7, 11, and 13. In B-mode, tissue and MBs are difficult to distinguish from each other. In RM-mode, the MB signal remains while tissue scattering is suppressed. The RM signal from MB varied with depth and is visible up to 4 mm in depth. In Fig. 14(b), B-mode and RM-mode images are shown for a heterogeneous hollow wall-less flow phantom comprising two 200-μm tubes. These images were acquired near the edge of the tube where some phantom material had accumulated in the lumen, as visible in the B-mode image. In the RM image, only the MB-perfused tubes (arrows) are highlighted; the tissue signal was suppressed.
Fig. 14.
(a) IVUS B-mode (left) and RM images (right) of MBs (6.4 × 105 MB/mL) infused in a tissue mimicking phantom containing scatterers. In B-mode, MB and tissue were difficult to distinguish from each other; in RM-mode, MB signal was enhanced while tissue scattering was strongly suppressed. (b) MBs infused in two 200-μm tubes (indicated by arrows at 1 and 5 o’clock in the B-mode image) placed in tissue-mimicking material were apparent in RM mode but not in B-mode. (c) Citrated blood circulated at 20 cm/s and tissue phantom were suppressed in RM mode at a frame rate of 30 images/s. Dots are separated by 1 mm. Dynamic ranges are respectively 40 dB and 30 dB for the B-mode and RM-mode images.
One drawback of multi-pulse imaging techniques is its inherent sensitivity to motion artifacts, which can be caused in this geometry by scatterer movement and catheter rotation. Characterization of our system was performed at a frame rate of 2.6 Hz and low MB velocities. These parameters were chosen to limit the total energy delivered to the catheter at the higher excitation settings and the amount of MBs used. Once an optimal set of parameters was determined, we tested the effect of these limitations by acquiring images at native IVUS 30 Hz rotation speed, while circulating blood at 20 cm/s, a velocity found in the epicardial coronary circulation. Fig. 14(c) shows that RM imaging at 30 frames/s suppressed signal from blood and tissue.
IV. Discussion
The results reported in this study indicate that our radial modulation approach with a 25/3 MHz combination can produce MB-specific imaging with a commercial IVUS catheter. RM signal increased with LF amplitude, as previously reported by us and others [24], [26]–[28], [36] and decreased with depth. Our results indicate that driving MBs near resonance using a phase lag of 0 (or π) produces a strictly positive (negative) envelope-subtracted RM image and corresponded to a peak in CTRRM (Figs. 7 and 10). To get some insight into the origin of the RM signal, we analyzed and compared it with with varying phase lags and LF amplitudes, assuming predominant incoherent scattering. The highest , using our MB population (Fig. 1), was found when the HF pulse was positioned at a phase lag of 0 relative to the LF pulse, which was corroborated by our simulations [Figs. 7(a) and 7(b)]. According to our simulations, the at this phase lag was mostly the result of MBs with diameters near 4 μm [Fig. 6(b)], which produced strictly positive , resulting in a higher than any other phase lag with this MB population. Our experimental and simulations results suggest that using a phase lag of 0, such that all MBs produce positive or neutral RM signals [Figs. 6(b) and 7], was advantageous in RM imaging. In contrast, using a phase lag of π/2 (or −π/2), the positive RM response of an MB bigger than 4 μm was reduced by the negative RM response of an MB smaller than 4 μm positioned close to it within the resolution size of the pulse. Depending on the phase lag, this led to positive or negative pixels in the RM image (Fig. 10), lower CTRRM, and neutral and . Our simple simulation approach did not account for constructive and destructive interferences that arise from phase differences caused by neighboring MBs in the US field. However, the concordance between and suggests that incoherent scattering dominates the mean scattering power and explains the higher CTRRM found at this phase lag by the simple superposition of single MB RM responses, independently of their positions. Constructive/destructive interferences at the MB concentrations used in this study seemed to be negligible in comparison to the reported effect of the phase lag, consistent with predominantly incoherent scattering.
By driving MBs near resonance and using a phase lag of 0, the contrast-to-tissue signal improvement over B-mode was 15.1 ± 2.1 dB at 2 mm and 6.8 ± 0.1 dB at 4 mm at an excitation amplitude of 220 mVpp, corresponding to an LF pressure of 300 kPa at 2 mm and 120 kPa at 4 mm, respectively (Figs. 11 and 14). LF harmonic infiltration was found near the catheter, and contributed 4.1 ± 1.0 dB of the CTRRM signal at a depth of 2 mm. Harmonics were negligible at lower pressure and at higher depths. These harmonics could result in a degradation of the resolution in the vicinity of the catheter, but this was not observed in the microtube data [Fig. 14(b)]. The system could also resolve 200-μm-diameter microtubes perfused with MBs, placed at 1.5 and 2 mm distance from the center of the catheter [Fig. 14(b)], which is promising for VV imaging. The decrease of the CTRRM at a concentration of 2.4 × 106 MB/mL at depths of 3, 4, and 5 mm but not at 2 mm (Fig. 13) indicates that the RM signal can be attenuated as the RM pulses propagate through high MB concentrations. The increase in CTRB-mode with depth was caused by attenuation in the tissue, which was stronger than in MBs at 25 MHz (data not shown).
Normalization in (8) using only B-mode 1 or B-mode 2 induced a very small (~1 dB) change in CTRI values (11). Using the average of both frames is the best approach in the absence of a separate B-mode frame without transmission of the LF.
A. Choice of RM Parameters, MB Size and Phase Lag
One major challenge in implementing RM imaging on a single-element catheter pertains to the inefficient transmission of the LF pulse. It was found that a 20-MHz crystal could produce moderate pressure levels at 3 MHz with a reasonable LF waveform (see Fig. 4). This corresponds to an HF/LF ratio near 10, a recommended rule of thumb for radial modulation imaging [28], which allows snapshots of the LF-driven MB oscillation to be imaged with the HF pulse. Because of the geometry of the catheter element, the LF pressure decayed rapidly with distance. We assumed that driving the MB near resonance could partly compensate for the limited LF amplitude by producing more RM signal than at a frequency away from resonance. We found that LF harmonics were generated close to the catheter, at pressure levels comparable to other published data [25], [27], [36]. The catheter geometry therefore imposes a compromise between near-field (2 mm) harmonics generation (undesirable) and far-field (4 and 5 mm) sensitivity (desirable).
B. The Choice of the LF Frequency
This implementation of RM imaging relies on synchronizing the HF pulses at maximal MB expansion and compression, while remaining in the linear oscillating regime to avoid the generation of LF harmonics [25], [27]. Our previous findings [36] suggested that for an LF amplitude below 0.15 mechanical index, a stronger RM signal can be obtained with an LF pulse tuned to the mean MB size resonance frequency without generating LF harmonics. This peak in RM signal was obtained at different phase lags depending on the choice of LF frequency. Our simulated (Fig. 7) and experimental results (Figs. 7 and 10) indicate that for an LF pulse corresponding to the mean MB size resonance frequency, CTRRM peaked at phase lags of 0 and π, when and reached maximal amplitudes, which corresponded to strictly positive or negative RM images (Fig. 10). This is consistent with strictly positive or negative for MB of a chosen size range (Fig. 6), which, assuming predominant incoherent scattering, can be used to predict maximal . Our results indicate that this approach can be used to adjust the phase lag depending on the LF frequency and MB size combination. In our implementation, tuning the LF to mean MB size resonance frequency had the benefit of requiring less LF pressure while producing RM signals with a single polarity (only positive RM) across MB sizes [Fig. 6(b)], and produces the highest CTRRM (Fig. 7).
C. Waveform Delay and Distortion
Delay, distortion, and aberration can occur when transmitting an HF/LF pulse complex [34] and are mainly caused by variation in the speed of sound of the HF caused by the LF. Delay and distortion therefore increase with the LF pressure and are cumulative in depth. The variation in the speed of sound c caused by the LF can be estimated by c = c0(1 + βnκp), where c0 is the speed of sound without the LF, βn = 1 + B/(2A) is a nonlinearity parameter, κ is the compressibility, and p is the LF pressure [34]. As a worst-case scenario, in water, at 5 mm depth, with βn = 3.6, κ = 4.6 × 10⁻¹⁰ Pa−1, and a constant LF pressure of 350 kPa (which is not the case with our system), the delay between HF1 and HF2 with a phase lag of π/2 is 4 ns. At the LF pressures and depth studied, the delay was not apparent in our data and was therefore not compensated for. Distortion, however, was found in the data and was depth-independent. We found an improvement in tissue suppression when the images were corrected for the distortion effect (Figs. 8 and 9). The observed depth independence can be attributed to the rapid decrease in LF pressure with distance in our configuration. Aberration was not investigated in this study.
D. Comparison With Other IVUS Contrast Imaging Approaches
Compared with other IVUS imaging approaches for VV imaging, this method constitutes a novel compromise between nonlinear and linear approaches. Our system produced comparable or higher CTR but lower CTRI compared with harmonic or subharmonic imaging [21], [22]. Importantly, it was implemented on a commercially available catheter, which could help fast track clinical translation. Because of a short inter-pulse delay (14 μs), the method is inherently less sensitive to motion-related artifacts compared with the linear approach, which is based on frame-to-frame video-sequence analyses [20] and provides much better contrast to tissue ratios. Our simulations indicate that these performances could be further optimized using monodispersed MBs, as discussed later. Recently, a chirp reversal imaging and ultraharmonic imaging approaches have been reported for contrast-specific IVUS imaging [23]. These methods achieved CTRs of 10 dB CTR, which is comparable to our findings, but MB concentration and CTRI values were not reported in that study, making direct comparisons difficult.
E. Future Work
Using a phase lag of 0 for resonance, our simulations [Fig. 6(b)] indicate MBs in the 3.5 to 5 μm size range contributed the most (−3-dB threshold) to the RM signal. That corresponds to less than half of our MBs (Fig. 1). This estimation is corroborated by the appearance of the RM images (Fig. 14), which are patchy, with bright areas surrounded by darker areas with very little RM signal, whereas the corresponding B-mode images are more uniform. Considering a Gaussian MB size distribution and a phase lag of 0, we estimated the effect of narrower MB size dispersion on the RM signal, by calculating for decreasing MB size dispersions. We found that for a mean MB size of 4 μm, a 2 dB increase in can be expected by decreasing the standard deviation of the MB population from 1.1 μm to 0.5 μm and a 3.2 dB increase with further decrease to 0.1 μm, assuming a constant MB concentration. There are different approaches for decreasing microbubble size dispersion, including micro-fluidic flow focusing devices [37] and differential centrifugation techniques that can generate monodispersed MB populations with size distribution of 4.2 ± 0.1 μm [38]. Finally, numerical studies predict that the natural resonance frequency of MBs oscillating in a constrained environment can increase or decrease depending on the surrounding tissue rigidity and compliance [39]–[41]. If there is a change in the resonance frequency of targeted versus non-targeted MB, as suggested by these simulations studies, and if scattering from targeted MB is stronger than the vascular wall, RM imaging could be used to differentiate targeted from non-targeted MBs, and allow a direct, specific imaging of targeted MBs, by monitoring the polarity of the signal, or by tuning the phase of HF relative to LF. The acoustic radiation force from the LF in the IVUS RM imaging could be used to push MBs to the wall and image adhered MBs in molecular imaging.
V. Conclusions
In this study, we evaluated the performance of a radial modulation approach for contrast-specific high-resolution IVUS imaging using a commercial single-element catheter. Simulations and in vitro characterization in a mock flow phantom indicate that by driving MBs near resonance as the modulating frequency, it is possible to achieve a CTRRM of 14.8 ± 0.5 dB and a CTRI of 15.1 ± 2.1 dB at 2 mm. Both parameters decreased to 7.5 ± 0.5 and 6.8 ± 0.1 dB at 4 mm, which is sufficient depth for coronary imaging. Microvessels embedded in scattering tissue and perfused with MBs were masked in B-mode but could be resolved in RM-mode. Blood circulating at coronary flow rates was cancelled out. Our simulations also suggest that RM imaging performance could benefit from using mono-dispersed MBs. These results raise promise for the detection of coronary vasa vasorum and may ultimately enable the detection of vulnerable plaque at risk for rupture.
Acknowledgments
We thank Boston Scientific Corp. for providing hardware support for this study.
Biographies
 François Tchi-Ho Yu received his B.S. degree in electrical engineering in 2001 from the Ecole Polytechnique de Montréal, Canada, and his Ph.D. degree in biomedical engineering in 2009 from the University of Montreal, Canada. His Ph.D. research focused on high-frequency ultrasonic backscatter from blood. He is currently a postdoctoral fellow at the Center for Ultrasound Molecular Imaging and Therapeutics at the University of Pittsburgh. His research interests include ultrasound tissue characterization, high-frequency ultrasound contrast imaging, and ultrasound microbubble-mediated drug delivery and therapy.
 Flordeliza Villanueva received her medical education from the Boston University School of Medicine in 1984 as part of a specialized 6-year B.A./M.D. program, then completed her internship and residency training at Duke University Medical Center from 1984 to 1987. Following her residency, she completed a one-year research fellowship in cardiology at the University of Pittsburgh School of Medicine in 1988, then completed her cardiology fellowship training at the University of Virginia from 1988 to 1992. Dr. Villanueva joined the faculty at the University of Pittsburgh School of Medicine in 1992. Her clinical focus is on noninvasive cardiac imaging, and she currently is the Director of Non-Invaisve Cardiac Imaging for the Heart and Vascular Institute based at Presbyterian University Hospital, UPMC. Her research interests are centered on ultrasound-based approaches to molecular imaging of cardiovascular disease, and also on the therapeutic applications of ultrasound contrast agents, including gene and drug delivery. She is the Director of the Center for Ultrasound Molecular Imaging and Therapeutics.
 Xucai Chen was born in Jiangsu Province, China, in 1962. He finished his undergraduate training at the China University of Mining and Technology in 1982. He received his Ph.D. degree from Yale University in 1991 in the Program in Engineering and Applied Science. He completed his postdoctoral training in the Department of Medicine and Department of Electrical Engineering at the University of Rochester in 1993. He joined the faculty at the University of Rochester after his fellowship. He joined the faculty at the University of Pittsburgh in 2006 as a Research Associate Professor of Medicine. His research interests are diagnostic and therapeutic ultrasound, microbubble dynamics, and high-speed imaging.
References
- 1.Fuster V, Fayad ZA, Moreno PR, Poon M, Corti R, Badimon JJ. Atherothrombosis and high-risk plaque: Part II: Approaches by noninvasive computed tomographic/magnetic resonance imaging. J Am Coll Cardiol. 2005;46(7):1209–1218. doi: 10.1016/j.jacc.2005.03.075. [DOI] [PubMed] [Google Scholar]
- 2.Sanz J, Fayad ZA. Imaging of atherosclerotic cardiovascular disease. Nature. 2008;451(7181):953–957. doi: 10.1038/nature06803. [DOI] [PubMed] [Google Scholar]
- 3.Virmani R, Kolodgie FD, Burke AP, Finn AV, Gold HK, Tulenko TN, Wrenn SP, Narula J. Atherosclerotic plaque progression and vulnerability to rupture: Angiogenesis as a source of intraplaque hemorrhage. Arterioscler Thromb Vasc Biol. 2005;25(10):2054–2061. doi: 10.1161/01.ATV.0000178991.71605.18. [DOI] [PubMed] [Google Scholar]
- 4.Kolodgie FD, Gold HK, Burke AP, Fowler DR, Kruth HS, Weber DK, Farb A, Guerrero LJ, Hayase M, Kutys R, Narula J, Finn AV, Virmani R. Intraplaque hemorrhage and progression of coronary atheroma. N Engl J Med. 2003;349(24):2316–2325. doi: 10.1056/NEJMoa035655. [DOI] [PubMed] [Google Scholar]
- 5.Khurana R, Zhuang Z, Bhardwaj S, Murakami M, De Muinck E, Yla-Herttuala S, Ferrara N, Martin JF, Zachary I, Simons M. Angiogenesis-dependent and independent phases of intimal hyperplasia. Circulation. 2004;110(16):2436–2443. doi: 10.1161/01.CIR.0000145138.25577.F1. [DOI] [PubMed] [Google Scholar]
- 6.Levy AP, Moreno PR. Intraplaque hemorrhage. Curr Mol Med. 2006;6(5):479–488. doi: 10.2174/156652406778018626. [DOI] [PubMed] [Google Scholar]
- 7.Doyle B, Caplice N. Plaque neovascularization and antiangiogenic therapy for atherosclerosis. J Am Coll Cardiol. 2007;49(21):2073–2080. doi: 10.1016/j.jacc.2007.01.089. [DOI] [PubMed] [Google Scholar]
- 8.Moreno PR, Purushothaman KR, Fuster V, Echeverri D, Truszczynska H, Sharma SK, Badimon JJ, O’Connor WN. Plaque neovascularization is increased in ruptured atherosclerotic lesions of human aorta: Implications for plaque vulnerability. Circulation. 2004;110(14):2032–2038. doi: 10.1161/01.CIR.0000143233.87854.23. [DOI] [PubMed] [Google Scholar]
- 9.Moreno PR, Purushothaman KR, Sirol M, Levy AP, Fuster V. Neovascularization in human atherosclerosis. Circulation. 2006;113(18):2245–2252. doi: 10.1161/CIRCULATIONAHA.105.578955. [DOI] [PubMed] [Google Scholar]
- 10.Drinane M, Mollmark J, Zagorchev L, Moodie K, Sun B, Hall A, Shipman S, Morganelli P, Simons M, Mulligan-Kehoe MJ. The antiangiogenic activity of rPAI-1(23) inhibits vasa vasorum and growth of atherosclerotic plaque. Circ Res. 2009;104(3):337–345. doi: 10.1161/CIRCRESAHA.108.184622. [DOI] [PMC free article] [PubMed] [Google Scholar]
- 11.Wilson SH, Herrmann J, Lerman LO, Holmes DR, Jr, Napoli C, Ritman EL, Lerman A. Simvastatin preserves the structure of coronary adventitial vasa vasorum in experimental hypercholesterolemia independent of lipid lowering. Circulation. 2002;105(4):415–418. doi: 10.1161/hc0402.104119. [DOI] [PubMed] [Google Scholar]
- 12.Gossl M, Herrmann J, Tang H, Versari D, Galili O, Mannheim D, Rajkumar SV, Lerman LO, Lerman A. Prevention of vasa vasorum neovascularization attenuates early neointima formation in experimental hypercholesterolemia. Basic Res Cardiol. 2009;104(6):695–706. doi: 10.1007/s00395-009-0036-0. [DOI] [PMC free article] [PubMed] [Google Scholar]
- 13.Moreno PR, Purushothaman KR, Zias E, Sanz J, Fuster V. Neovascularization in human atherosclerosis. Curr Mol Med. 2006;6(5):457–477. doi: 10.2174/156652406778018635. [DOI] [PubMed] [Google Scholar]
- 14.Diaz-Flores L, Jr, Madrid JF, Gutierrez R, Varela H, Valladares F, Diaz-Flores L. Cell contribution of vasa-vasorum to early arterial intimal thickening formation. Histol Histopathol. 2007;22(12):1379–1386. doi: 10.14670/HH-22.1379. [DOI] [PubMed] [Google Scholar]
- 15.Feinstein SB. The powerful microbubble: From bench to bedside, from intravascular indicator to therapeutic delivery system, and beyond. Am J Physiol Heart Circ Physiol. 2004;287(2):H450–H457. doi: 10.1152/ajpheart.00134.2004. [DOI] [PubMed] [Google Scholar]
- 16.Feinstein SB. Contrast ultrasound imaging of the carotid artery vasa vasorum and atherosclerotic plaque neovascularization. J Am Coll Cardiol. 2006;48(2):236–243. doi: 10.1016/j.jacc.2006.02.068. [DOI] [PubMed] [Google Scholar]
- 17.Schinkel AF, Krueger CG, Tellez A, Granada JF, Reed JD, Hall A, Zang W, Owens C, Kaluza GL, Staub D, Coll B, Ten Cate FJ, Feinstein SB. Contrast-enhanced ultrasound for imaging vasa vasorum: Comparison with histopathology in a swine model of atherosclerosis. Eur J Echocardiogr. 2010;11(8):659–664. doi: 10.1093/ejechocard/jeq048. [DOI] [PubMed] [Google Scholar]
- 18.Staub D, Schinkel AF, Coll B, Coli S, van der Steen AF, Reed JD, Krueger C, Thomenius KE, Adam D, Sijbrands EJ, ten Cate FJ, Feinstein SB. Contrast-enhanced ultrasound imaging of the vasa vasorum: From early atherosclerosis to the identification of unstable plaques. JACC Cardiovasc Imaging. 2010;3(7):761–771. doi: 10.1016/j.jcmg.2010.02.007. [DOI] [PubMed] [Google Scholar]
- 19.Staub D, Patel MB, Tibrewala A, Ludden D, Johnson M, Espinosa P, Coll B, Jaeger KA, Feinstein SB. Vasa vasorum and plaque neovascularization on contrast-enhanced carotid ultrasound imaging correlates with cardiovascular disease and past cardiovascular events. Stroke. 2010;41(1):41–47. doi: 10.1161/STROKEAHA.109.560342. [DOI] [PubMed] [Google Scholar]
- 20.Vavuranakis M, Kakadiaris IA, O’Malley SM, Papaioannou TG, Sanidas EA, Naghavi M, Carlier S, Tousoulis D, Stefanadis C. A new method for assessment of plaque vulnerability based on vasa vasorum imaging, by using contrast-enhanced intravascular ultrasound and differential image analysis. Int J Cardiol. 2008;130(1):23–29. doi: 10.1016/j.ijcard.2007.07.170. [DOI] [PubMed] [Google Scholar]
- 21.Goertz DE, Frijlink ME, Tempel D, van Damme LC, Krams R, Schaar JA, Ten Cate FJ, Serruys PW, de Jong N, van der Steen AF. Contrast harmonic intravascular ultrasound: A feasibility study for vasa vasorum imaging. Invest Radiol. 2006;41(8):631–638. doi: 10.1097/01.rli.0000229773.11715.da. [DOI] [PubMed] [Google Scholar]
- 22.Goertz DE, Frijlink ME, Tempel D, Bhagwandas V, Gisolf A, Krams R, de Jong N, van der Steen AF. Subharmonic contrast intravascular ultrasound for vasa vasorum imaging. Ultrasound Med Biol. 2007;33(12):1859–1872. doi: 10.1016/j.ultrasmedbio.2007.05.023. [DOI] [PubMed] [Google Scholar]
- 23.Maresca D, Renaud G, van Soest G, Li X, Zhou Q, Shung KK, de Jong N, van der Steen AF. Contrast-enhanced intravascular ultrasound pulse sequences for bandwidth-limited transducers. Ultrasound Med Biol. 2013;39(4):706–713. doi: 10.1016/j.ultrasmedbio.2012.10.020. [DOI] [PMC free article] [PubMed] [Google Scholar]
- 24.Deng CX, Lizzi FL, Kalisz A, Rosado A, Silverman RH, Coleman DJ. Study of ultrasonic contrast agents using a dual-frequency band technique. Ultrasound Med Biol. 2000;26(5):819–831. doi: 10.1016/s0301-5629(00)00217-9. [DOI] [PubMed] [Google Scholar]
- 25.Shariff H, Bevan PD, Karshafian R, Williams R, Burns PN. Radial modulation imaging: raising the frequency for contrast imaging. Proc IEEE Ultrasonics Symp. 2006:104–107. [Google Scholar]
- 26.Bouakaz A, Versluis M, Borsboom J, de Jong N. Radial modulation of microbubbles for ultrasound contrast imaging. IEEE Trans Ultrason Ferroelectr Freq Control. 2007;54(11):2283–2290. doi: 10.1109/tuffc.2007.532. [DOI] [PubMed] [Google Scholar]
- 27.Cherin E, Brown J, Masoy SE, Shariff H, Karshafian R, Williams R, Burns PN, Foster FS. Radial modulation imaging of microbubble contrast agents at high frequency. Ultrasound Med Biol. 2008;34(6):949–962. doi: 10.1016/j.ultrasmedbio.2007.11.017. [DOI] [PubMed] [Google Scholar]
- 28.Masoy SE, Standal O, Nasholm P, Johansen TF, Angelsen B. SURF imaging: In vivo demonstration of an ultrasound contrast agent detection technique. IEEE Trans Ultrason Ferroelectr Freq Control. 2008;55(5):1112–1121. doi: 10.1109/TUFFC.2008.763. [DOI] [PubMed] [Google Scholar]
- 29.Emmer M, Vos HJ, Versluis M, de Jong N. Radial modulation of single microbubbles. IEEE Trans Ultrason Ferroelectr Freq Control. 2009;56(11):2370–2379. doi: 10.1109/TUFFC.2009.1325. [DOI] [PubMed] [Google Scholar]
- 30.Hansen R, Angelsen BA. Contrast imaging by non-overlapping dual frequency band transmit pulse complexes. IEEE Trans Ultrason Ferroelectr Freq Control. 2011;58(2):290–297. doi: 10.1109/TUFFC.2011.1806. [DOI] [PubMed] [Google Scholar]
- 31.Hoff L. Acoustic Characterization of Contrast Agents for Medical Ultrasound Imaging. Trondheim, Norway: Kluwer Academic; 2001. [Google Scholar]
- 32.Leighton TG. The Acoustic Bubble. ch 4. London, UK: Harcourt Brace and Co; 1994. pp. 291–298. [Google Scholar]
- 33.Weller GE, Villanueva FS, Klibanov AL, Wagner WR. Modulating targeted adhesion of an ultrasound contrast agent to dysfunctional endothelium. Ann Biomed Eng. 2002 Sep;30:1012–1019. doi: 10.1114/1.1513565. [DOI] [PubMed] [Google Scholar]
- 34.Hansen R, Masoy SE, Tangen TA, Angelsen BA. Nonlinear propagation delay and pulse distortion resulting from dual frequency band transmit pulse complexes. J Acoust Soc Am. 2011 Feb;129:1117–1127. doi: 10.1121/1.3518753. [DOI] [PubMed] [Google Scholar]
- 35.Hansen R, Angelsen BA. Contrast imaging by non-overlapping dual frequency band transmit pulse complexes. IEEE Trans Ultrason Ferroelectr Freq Control. 2011 Feb;58:290–297. doi: 10.1109/TUFFC.2011.1806. [DOI] [PubMed] [Google Scholar]
- 36.Yu FTH, Villanueva FS, Chen X. The selection of the low frequency for radial modulation imaging at 20 MHz. Proc IEEE Ultrasonics Symp. 2010:908–911. [Google Scholar]
- 37.Hettiarachchi K, Talu E, Longo ML, Dayton PA, Lee AP. On-chip generation of microbubbles as a practical technology for manufacturing contrast agents for ultrasonic imaging. Lab Chip. 2007;7(4):463–468. doi: 10.1039/b701481n. [DOI] [PMC free article] [PubMed] [Google Scholar]
- 38.Feshitan JA, Chen CC, Kwan JJ, Borden MA. Microbubble size isolation by differential centrifugation. J Colloid Interface Sci. 2009;329(2):316–324. doi: 10.1016/j.jcis.2008.09.066. [DOI] [PubMed] [Google Scholar]
- 39.Qin S, Ferrara KW. The natural frequency of nonlinear oscillation of ultrasound contrast agents in microvessels. Ultrasound Med Biol. 2007;33(7):1140–1148. doi: 10.1016/j.ultrasmedbio.2006.12.009. [DOI] [PMC free article] [PubMed] [Google Scholar]
- 40.Sassaroli E, Hynynen K. Resonance frequency of microbubbles in small blood vessels: A numerical study. Phys Med Biol. 2005;50(22):5293–5305. doi: 10.1088/0031-9155/50/22/006. [DOI] [PubMed] [Google Scholar]
- 41.Martynov S, Stride E, Saffari N. The natural frequencies of microbubble oscillation in elastic vessels. J Acoust Soc Am. 2009;126(6):2963–2972. doi: 10.1121/1.3243292. [DOI] [PubMed] [Google Scholar]


