

This study demonstrates a rapid decline in the percentage of patients treated with ESAs after changes to reimbursement policy, but not after warnings about use. Reimbursement restrictions of other overused or off-label drugs may help reduce health care expenditures.
Abstract
Purpose:
Since 2004, concerns about the safety of erythropoiesis-stimulating agents (ESAs) have resulted in label changes and restrictions on their use. We examined changes in ESA use and blood transfusions over time.
Methods:
The SEER-Medicare database was used to identify patients age ≥ 65 years with breast, lung, prostate, ovary, or colon cancer, diagnosed between 2000 and 2007, who had a chemotherapy claim after their cancer diagnosis. We calculated the mean number of ESA claims per patient per year. Follow-up claims were available through 2008. We used multivariable logistic regression models to analyze the association of ESA use and extended ESA use with clinical and demographic variables.
Results:
Among 121,169 patients identified, 46,063 (38%) received an ESA. ESA use increased from 12.4% to 16.2% by 2006 and then decreased to 7.9% by 2008. Similarly, the mean number of ESA claims per patient decreased steadily over the entire timeframe. The annual percentage of patients undergoing transfusion remained relatively constant (9% to 10%). In a Cox proportional hazards time-dependent model, ESA use was positively associated with black race (odds ratio [OR], 1.11; 95% CI, 1.07 to 1.15), metropolitan location (OR, 1.17; 95% CI, 1.13 to 1.21), metastatic disease (OR, 1.39; 95% CI, 1.35 to 1.41), female sex (OR, 1.17; 95% CI, 1.14 to 1.20), > one comorbidity (OR, 1.29; 95% CI, 1.25 to 1.32), and tumor type. The number of denied claims increased over time.
Conclusion:
Our study demonstrated a rapid decline in the percentage of patients treated with ESAs after changes to reimbursement policy, but not after warnings about use. Reimbursement restrictions of other overused or off-label drugs may help reduce health care expenditures.
Introduction
In 1993, the US Food and Drug Administration (FDA) approved epoetin alfa, an erythropoiesis-stimulating agent (ESA), for use in patients with cancer.1 Approval for darbepoietin, the long-acting erythropoietin preparation, followed in 2002.2 The FDA approvals of ESAs were based on the reduced RBC transfusion requirements (27% v 52% of patients) demonstrated in placebo-controlled trials comparing 12 weeks of ESA with placebo.1,2 As a result, uptake of ESAs was rapid.3 However, as early as 1998, data began to emerge among patients with renal failure suggesting increased thrombosis and decreased survival among patients treated with ESAs.4 Subsequently, concern were raised about the safety of ESAs in patients with cancer after reports from several studies suggesting that ESA use was associated with poorer survival.5,6 As a result of this concern, several regulatory efforts have been enacted to dissuade clinicians from the off-label prescription of these medications.7
In 2004, the FDA convened an Oncologic Drugs Advisory Committee (ODAC) meeting to address the safety of ESAs. The result was the addition to the product label of information on time to progression and survival. The FDA later convened another ODAC meeting in 2007 based on additional results from clinical trials.8 Recommendations to the FDA included lowering the baseline hemoglobin for ESA initiation and restricting the use of ESAs to indications on the label (Appendix Table A1, online only). After the ODAC meeting, the Centers for Medicare and Medicaid Services (CMS) issued a new cancer coverage policy that included additional restrictions on both the initiation and duration of ESA use. Furthermore, in 2010, the FDA established a Risk Evaluation and Mitigation Strategy (REMS) program to further improve evidence-based use, requiring that patients be made aware of the drugs' risks.9,10
Despite an increasing number of studies questioning the safety of ESAs, use in the United States increased by 340% between 2001 and 2005.9,11,12 It is estimated that annual Medicare expenditures for ESAs during this period exceeded $1 billion.13 However, despite the debate regarding the appropriate use of ESAs, little is known about the effects of these regulatory changes on ESA or transfusion use. We performed a population-based analysis to determine the patterns and predictors of ESA and transfusion use among Medicare beneficiaries with cancer over time as these regulatory changes were promulgated.
Methods
Data Source
We analyzed data from the SEER-Medicare database.14 SEER provides information on tumor histology, location, stage of disease, treatment, and survival, along with SEER site of diagnosis and demographic and selected census tract–level information on 26% of the population in the United States. The Medicare database includes Medicare A (inpatient) and B (outpatient) eligibility status, billed claims, and diagnoses. These two files are linked by unique patient identification numbers and provide the ability to determine who has been treated with an ESA and the dates of service. Exemption from the Columbia University Institutional Review Board was obtained.
Cohort Selection
We identified all individuals age ≥ 65 years who had a pathologically confirmed primary diagnosis of breast, prostate, colon, lung, or ovarian cancer from January 1, 2000, through December 31, 2007, and who were treated with chemotherapy after the cancer diagnosis. These cancers were thought to represent common cancers for which ESAs are frequently used. We excluded patients who were enrolled in a non-Medicare health maintenance organization or not covered by Medicare Parts A and B over the same period.3 Patients who were enrolled in Medicare because of end-stage renal disease and dialysis as well as patients with other primary cancers were excluded. We also excluded patients whose reporting source of death was autopsy or death certificate, whose reason for entitlement was not age, and whose date of death differed by > 3 months between SEER and Medicare. Age at diagnosis was categorized into 5-year intervals. We recoded the SEER marital status variable as married, not married, or unknown, and the race variable as black, white, or other. Patients were classified as having nonmetastatic disease if they had stage 1 to 3 or locoregional cancer when they were treated. They were classified as having metastatic disease if they had stage 4 or distant cancer based on SEER historic stage or recurrence.
Socioeconomic Status Score
We generated an aggregate socioeconomic status score from education, poverty level, and income information from the 2000 census tract data, as described previously by Du et al.15 Patients' scores were ranked on a scale of 1 to 5 using a formula that incorporated education, poverty, and income weighted equally, with 1 being the lowest value. Fifty-five patients lacked sufficient information in ≥ one category and were excluded from the analyses.
Assessment of Comorbid Disease
To assess the prevalence of comorbid disease in our cohort, we used the Klabunde adaptation of the Charlson comorbidity index.16,17 Medicare inpatient and outpatient claims were searched for diagnostic codes of the International Classification of Diseases (ninth revision), Clinical Modification (ICD-9-CM).18 Claims from 12 months before the cancer diagnosis were considered. Each condition was weighted, and patients were assigned a score based on the Klabunde Charlson index.17
Treatment Characteristics
We extracted information on chemotherapy from the date of diagnosis from the Medicare files by searching the Level II Healthcare Common Procedure Coding System codes, Current Procedural Terminology (CPT) codes, ICD-9-CM diagnostic and procedure codes, diagnostic-related group codes, and center codes from physician claims files, hospital outpatient claims files, and Medicare provider review files. Claims between the years of 2000 and 2008 were included.
We searched for CPT and Level II Healthcare Common Procedure Coding System codes corresponding to the ESAs erythropoietin and darbopoietin (Q0136-7, Q4081, J0880-2, and J0885-6) or blood transfusion (36430, 36455, 36512, 86890, 86927, 86999, 86930-2, P9010, P9016-7, P9020-2, P9038-9, and P9040). Only outpatient ESA use was assessed. All patients were classified as having received an ESA if their first ESA claim was after they received their first chemotherapy treatment. Patients were classified as having received a transfusion if the first transfusion claim was within 30 days before cancer diagnosis or at any time after. Use of ESA was categorized by the number of claims per patient per year and the percentage of patients alive in a given year or month who received an ESA and chemotherapy. Patients were classified as having received below or above the top quartile12 of the total number of ESA claims. We determined the number of ESA claims denied by CMS (National Claims History–denied physician claims) and calculated the percentage of ESA claims that were denied.
Statistical Analysis
Treatments with or without an ESA were compared using χ2 tests, with respect to clinical and demographic variables. To estimate overall use, we used multivariable logistic regression models to evaluate the association between ESA use and clinical and demographic variables. We performed a time-dependent Cox proportional hazards analysis to account for differential follow-up time to determine predictors of any ESA use.
The variables of interest in the models include age category (65 to 69, 70 to 74, 75 to 79, or ≥ 80 years), extent of disease (metastatic or nonmetastatic), tumor type (colon, breast, lung, prostate, or ovary), and race (black, white, or other), and year of first chemotherapy. A sensitivity analysis was performed by altering the number of claims for the outcome variables. We performed a piecewise regression analysis using the percentage of living patients who received an ESA per month as the outcome, where the breakpoint was set as the date of the CMS policy change (July 2007). The date of the CMS policy was chosen as July 2007. All analyses were conducted using SAS software (version 9.3; SAS Institute, Cary, NC). All statistical tests were two sided, with an α of 0.05.
Results
Among 121,169 patients analyzed, 46,063 (38%) received an ESA over the period of analysis. Of those who received ESAs, 12,358 (27%) had ≥ 12 claims (top quartile). Annual ESA use increased gradually from 12.4% in 2000 to 16.2% in 2006 and then decreased to 7.9% by 2008 (51% reduction). During the timeframe, 36,603 (30%) received a blood transfusion, and the annual percentage of patients undergoing transfusion remained relatively constant during this timeframe, ranging from 9% to 10%. Over the period of analysis, transfusion rates were highest for patients with ovarian cancer (49%) and lowest for patients with breast or prostate cancer (22% to 26%). Figure 1 shows the change in the percentage of patients with ESA claims per month in relation to the regulatory meetings by ODAC and CMS. We used monthly rates to represent the month that the CMS regulations were in effect. We observed a discontinuity and change in magnitude and direction of the slope observed at the time of policy change. After a gradual increase, the percentage of patients who received an ESA dropped after July 2007. The decline of ESA use over time was greatest for patients with ≥ 12 claims for ESAs (P < .01). At the peak of ESA use in 2006, the number of claims submitted was approximately 81,000. The number of claims per patient per quarter decreased gradually over the entire time, whereas the percentage of ESA claims that were denied payment increased from 6.7% in 2006 to 17.7% in 2008 (Fig 2).
Figure 1.
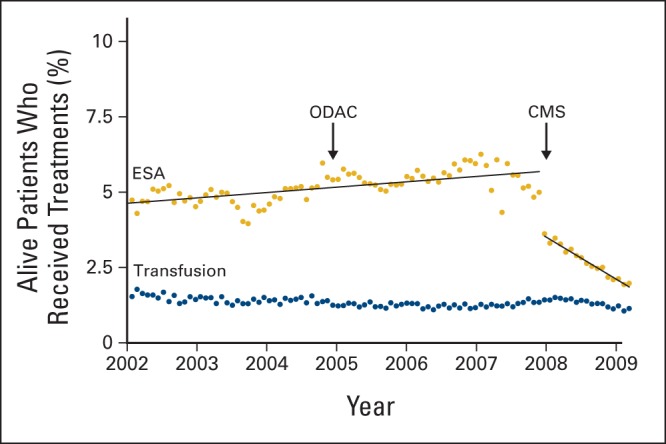
Percentage of patients with cancer who received erythropoiesis-stimulating agents (ESAs) per month in relation to regulatory changes. CMS, Centers for Medicare and Medicaid Services; ODAC, Oncologic Drugs Advisory Committee.
Figure 2.
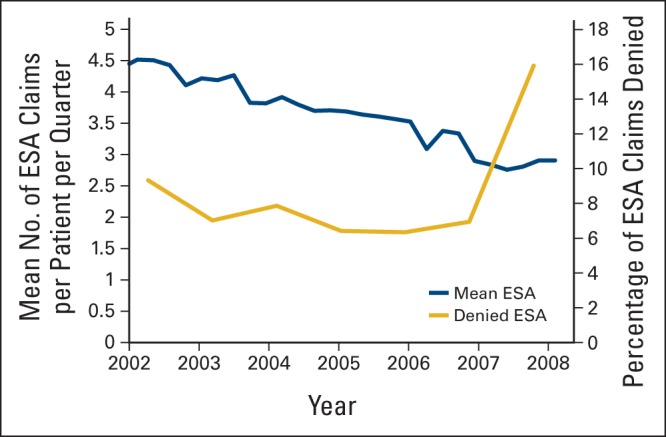
Mean number of erythropoiesis-stimulating agent (ESA) claims and percent of denied ESA claims between 2002 and 2009.
Female patients were more likely than male patients to receive an ESAs (52% v 27%), and patients with metastatic cancer were more likely to receive an ESA compared with those with nonmetastatic disease (44% v 29%). Patients with prostate cancer were the least likely to receive an ESA (13%; Table 1). The proportion of patients with each tumor receiving an ESA did not change over time. In a multivariable analysis, ESA use was positively associated with black race (odds ratio [OR], 1.18; 95% CI, 1.12 to 1.24), metropolitan location (OR, 1.25; 95% CI, 1.19 to 1.31), being married (OR, 1.12; 95% CI, 1.09 to 1.16), metastatic disease (OR, 1.83; 95% CI, 1.78 to 1.88), and female sex (OR, 1.32; 95% CI, 1.28 to 1.37). The effect of tumor type was prominent in ESA use. Patients with ovarian (OR, 2.41; 95% CI, 2.26 to 2.57) or lung cancer (OR, 1.82; 95% CI, 1.75 to 1.89) were more likely to receive an ESA compared with patients with breast cancer (Table 1).
Table 1.
Multivariable Analysis of Factors Associated With ESA Use Among Elderly Patients With Cancer Undergoing Chemotherapy (N = 121,169)
| Factor | Total Patients |
No ESA (n = 75,106; 62%) |
ESA (n = 46,063; 38%) |
OR | 95% CI | HR | 95% CI | |||
|---|---|---|---|---|---|---|---|---|---|---|
| No. | % | No. | % | No. | % | |||||
| Age at diagnosis, years | ||||||||||
| 65-69 | 27,505 | 23 | 16,031 | 58 | 11,474 | 42 | Referent | Referent | ||
| 70-74 | 36,691 | 30 | 22,081 | 60 | 14,610 | 40 | 1.00 | 0.97 to 1.04 | 1.01 | 0.98 to 1.03 |
| 75-79 | 32,481 | 27 | 20,205 | 62 | 12,276 | 38 | 0.97 | 0.93 to 1.00 | 1.02 | 0.99 to 1.04 |
| ≥ 80 | 24,492 | 20 | 16,739 | 69 | 7,703 | 31 | 0.80 | 0.77 to 0.83 | 0.93 | 0.90 to 0.95 |
| Race | ||||||||||
| White | 103,903 | 86 | 64,025 | 61 | 39,878 | 38 | Referent | Referent | ||
| Black | 9,429 | 8 | 5,869 | 62 | 3,560 | 38 | 1.18 | 1.12 to 1.24 | 1.11 | 1.07 to 1.15 |
| Other | 7,837 | 6 | 5,212 | 67 | 2,625 | 33 | 0.93 | 0.88 to 0.98 | 0.91 | 0.88 to 0.95 |
| Sex | ||||||||||
| Female | 51,928 | 43 | 24,867 | 48 | 27,051 | 52 | 1.33 | 1.28 to 1.37 | 1.17 | 1.14 to 1.20 |
| Male | 69,241 | 57 | 50,239 | 73 | 19,002 | 27 | Referent | Referent | ||
| Residence | ||||||||||
| Metropolitan | 109,669 | 91 | 67,437 | 61 | 42,231 | 39 | 1.25 | 1.19 to 1.31 | 1.17 | 1.13 to 1.21 |
| Nonmetropolitan | 11,500 | 9 | 7,668 | 67 | 3,832 | 33 | Referent | Referent | ||
| Marital status | ||||||||||
| Married | 71,492 | 59 | 44,962 | 63 | 26,530 | 37 | 1.12 | 1.09 to 1.15 | 1.05 | 1.03 to 1.07 |
| Not married | 41,392 | 34 | 23,689 | 57 | 17,703 | 43 | Referent | Referent | ||
| Unknown | 8,285 | 7 | 6,455 | 78 | 1,830 | 22 | 0.86 | 0.81 to 0.92 | 0.86 | 0.82 to 0.90 |
| SES, quintile | ||||||||||
| Lowest | 14,811 | 12 | 9,500 | 64 | 5,311 | 36 | Referent | Referent | ||
| Second | 22,988 | 19 | 14,594 | 63 | 8,394 | 37 | 0.99 | 0.95 to 1.04 | 0.98 | 0.94 to 1.01 |
| Third | 26,973 | 22 | 16,879 | 63 | 10,094 | 37 | 1.01 | 0.96 to 1.06 | 0.97 | 0.93 to 1.00 |
| Fourth | 26,849 | 22 | 16,562 | 62 | 10,287 | 38 | 1.02 | 0.97 to 1.07 | 0.97 | 0.94 to 1.01 |
| Highest | 29,493 | 24 | 17,534 | 59 | 11,959 | 41 | 1.07 | 1.02 to 1.13 | 0.99 | 0.95 to 1.02 |
| Tumor stage | ||||||||||
| Nonmetastatic | 48,755 | 40 | 34,447 | 71 | 14,308 | 29 | Referent | Referent | ||
| Metastatic | 72,414 | 60 | 40,659 | 56 | 31,755 | 44 | 1.83 | 1.78 to 1.88 | 1.39 | 1.35 to 1.41 |
| Tumor site | ||||||||||
| Breast | 20,375 | 17 | 11,272 | 55 | 9,103 | 45 | Referent | Referent | ||
| Colon | 17,787 | 15 | 10,510 | 59 | 7,277 | 41 | 0.94 | 0.90 to 0.99 | 1.04 | 1.00 to 1.07 |
| Lung | 36,114 | 30 | 15,231 | 42 | 20,833 | 58 | 1.82 | 1.78 to 1.88 | 2.43 | 2.36 to 2.50 |
| Prostate | 41,615 | 34 | 36,354 | 88 | 5,261 | 13 | 0.23 | 0.22 to 0.25 | 0.25 | 0.24 to 0.26 |
| Ovary | 5,278 | 4 | 1,739 | 33 | 3,539 | 67 | 2.41 | 2.26 to 2.57 | 2.43 | 2.34 to 2.53 |
| Comorbidity score | ||||||||||
| 0 | 78,441 | 65 | 50,257 | 64 | 28,184 | 36 | Referent | Referent | ||
| 1 | 28,025 | 23 | 16,649 | 59 | 11,376 | 41 | 1.11 | 1.08 to 1.15 | 1.10 | 1.08 to 1.13 |
| > 1 | 14,703 | 12 | 8,200 | 56 | 6,503 | 44 | 1.34 | 1.28 to 1.39 | 1.29 | 1.25 to 1.32 |
| Year of first chemotherapy | 1.02 | 1.01 to 1.02 | 1.02 | 1.01 to 1.02 | ||||||
Abbreviations: ESA, erythropoiesis-stimulating agent; HR, hazard ratio; OR, odds ratio; SES, socioeconomic status.
In a time-dependent Cox proportional hazard analysis accounting for follow-up time, the trends were similar (Table 1). We also evaluated prolonged ESA use (≥ 12 claims), prolonged use was positively associated with black race (OR, 1.12; 95% CI, 1.04 to 1.19), greater comorbidity (OR, 1.46; 95% CI, 1.39 to 1.54), and tumor type (OR, 2.09; 95% CI, 1.97 to 2.21; lung v breast cancer). Prolonged ESA use was negatively associated with later year of treatment (data not shown). There was a small but statistically significant interaction between year and race, tumor type, and extent of disease.
Discussion
Our findings suggest that reimbursement policies instituted by CMS resulted in a substantial decrease in ESA use over time, without a significant change in the number of patients undergoing blood transfusion. Interestingly, black patients and female patients were more likely to receive any ESA as well as prolonged ESA treatment. In addition, despite the rapid decline in ESA use in 2007, there was also an increase in denied claims among those submitted, suggesting possibly an even greater impact of the policy in reducing ESA expenditures for CMS.
After initial approval of ESAs, their use increased dramatically. In a prior study evaluating the use of ESAs between 1991 and 2002, the proportion of patients receiving ESAs increased from 4.8% in 1991 to 45.9% in 2002. Of note, during this period of rapid increase in ESA use, the rate of blood transfusions per year remained constant.3 In response to the changing guidelines, several institutions responded by establishing management tools for implementing best practices. A study from MD Anderson Cancer Center (Houston, TX) reported that between 2006 and 2008, before and after the implementation of guidelines, ESA use decreased by 83%, and the number of patients treated with an ESA decreased by 80%; the greatest reductions were in use among patients with solid tumors and patients with hemoglobin levels > 10 g/dL. In this single-institution study, transfusion rates increased from 7% to 9%.19 Our data confirm the rapid decline in use of ESAs after reimbursement policy changed and suggest that decreased ESA use had a minimal impact on transfusion rates.
Prior data examining the patterns of ESA use have predominantly focused on compliance with guidelines.9,20–25 The majority of these studies found fair to moderate compliance with initiating ESAs in those with hemoglobin levels < 10 g/dL.9,21–25 An evaluation of patients in the United States treated with an ESA between 2002 and 2006 noted that 24% of patients who received an ESA had hemoglobin levels > 12 gm/dL.24 In previous studies by our group, we reported increased use among women and black patients, likely because of lower baseline hemoglobin levels.3 We also reported substantial misuse of ESAs. A large number of patients received either an ultra-short course of ESA treatment or prolonged-duration ESA therapy, with 14% of patients continuing to receive ESA treatment well after the completion of chemotherapy.24
Safety matters aside, the rapid rise and fall of ESA use is of major concern from a public policy perspective. ESAs represented a major source of drug-associated health care expenditures for many years. It is estimated that at their peak, Medicare expenditures for ESAs were > $1 billion annually.13 Although we do not know if the reductions in use resulted in changes in patient quality of life, a recent study that modeled conservative use of ESAs noted that ESAs were not cost effective and that the incremental cost per quality-adjusted life-year gained with ESA treatment was $267,000, compared with supportive transfusions.26,27 Given the widespread use and misuse of ESAs, one may question if these expenditures could have been avoided.
It is estimated that approximately 10% of all drugs that are FDA approved subsequently receive a black-box warning, and approximately 3% are subsequently withdrawn from the market.28 A number of factors contribute to the problem, including lack of postmarketing surveillance, inadequate clinician reporting of adverse drug reactions, and rapid early uptake of medications because of extensive pharmaceutical marketing.28 In addition, the accelerated approval process has not mandated postmarketing surveillance, and these drugs are often approved with minimal adverse event information.29 One of the factors that may have contributed to the rapid uptake of ESAs was direct-to-consumer advertising, although there is little published literature on this.
We acknowledge several important limitations of our study and of the SEER-Medicare database in general.30 It is possible that not all patients who received an ESA were captured with Medicare claims. However, because of the substantial expense associated with ESAs, we believe this misclassification is likely minor. SEER-Medicare lacks data on hemoglobin levels. Therefore, we could not calculate the number of patients who received an ESA who had high hemoglobin levels. We were not able to differentiate individual physician or practice patterns. ESA use was associated in clinical trials with an improvement in quality of life. We were unable to measure if changes in use adversely affected patients' well-being. Given the widespread recognition of the safety concerns of ESAs, regulations culminated in 2010 with the development of the Amgen ESA APPRISE program, requiring that physicians complete a special training module, provide medication guides, discuss the risks, benefits, and FDA-approved uses of ESAs with patients before beginning treatment, and document this discussion. Our data does not capture data through 2010; therefore we anticipate there were further declines in ESA use after that date. Finally, while we know that denied claims increased, we don't know the reason for the denial or the number that were appealed.
Our study demonstrated that recent changes to reimbursement policy may have driven a more limited use of ESAs, with coincident reductions in health care expenditures. However, it is also possible that the regulatory burdens have dissuaded providers to use the medications in settings where there may be a substantial benefit to patients. ESAs are not the only drugs that are overused and misused, contributing to the growing financial burden of cancer care. It is possible that restrictions on other overused drugs may help reduce health care expenditures.
Acknowledgment
Supported by Grants No. R01CA134964 (D.L.H.) and No. R01CA169121 (J.D.W.) from the National Cancer Institute (NCI). This study used the linked SEER-Medicare database. The interpretation and reporting of these data are the sole responsibilities of the authors. We acknowledge the efforts of the Applied Research Branch, Division of Cancer Prevention and Population Science, NCI; the Offices of Information Services and Strategic Planning, Health Care Financing Administration; Information Management Services; and the SEER Program tumor registries in the creation of the SEER-Medicare database.
Appendix
Table A1.
Specific Changes After 2004 and 2007 FDA Evaluations of ESAs
| Changes |
|---|
| 2004 |
| FDA required minor changes to product label to include information on response rates, time to disease progression, and OS in patients with solid tumors and information on risk of thrombotic events and tumor promotion: |
| Black-box warning for cancer therapy |
| ESAs shortened OS and/or increased risk of tumor progression or recurrence in some clinical studies in patients with breast, non–small cell lung, head and neck, lymphoid, and cervical cancers |
| To decrease these risks as well as risk of serious cardio- and thrombovascular events, use lowest dose needed to avoid RBC transfusion |
| Use ESAs only for treatment of anemia resulting from concomitant myelosuppressive chemotherapy |
| ESAs are not indicated for patients receiving myelosuppressive therapy when anticipated outcome is cure |
| Discontinue after completion of chemotherapy course |
| 2007 |
| CMS determined that ESA treatment for anemia secondary to myelosuppressive anticancer chemotherapy in solid tumors, multiple myeloma, lymphoma, and lymphocytic leukemia is only reasonable and necessary under following conditions: |
| Hemoglobin level immediately before initiation or maintenance of ESA treatment is < 10 g/dL (or hematocrit < 30%) |
| Starting dose for ESA treatment is recommended FDA label starting dose: ≤ 150 U/kg 3× per week for epoetin and 2.25 mcg/kg once per week for darbepoetin alfa; equivalent doses may be administered over other approved periods |
| Maintenance of ESA therapy is starting dose if hemoglobin level remains < 10 g/dL (or hematocrit < 30%) 4 weeks after initiation of therapy and rise in hemoglobin is > 1 g/dL (hematocrit > 3%) |
| For patients whose hemoglobin rises < 1 g/dL (hematocrit rise < 3%) compared with pretreatment baseline over 4 weeks of treatment and whose hemoglobin level remains < 10 g/dL after 4 weeks of treatment (or hematocrit < 30%), recommended FDA label starting dose may be increased once by 25%; continued use of drug is not reasonable or necessary if hemoglobin rises < 1 g/dL (hematocrit rise < 3%) compared with pretreatment baseline by 8 weeks of treatment |
| Continued administration of drug is not reasonable or necessary if there is rapid rise in hemoglobin > 1 g/dL (hematocrit > 3%) over 2 weeks of treatment, unless hemoglobin remains below or subsequently falls to < 10 g/dL (or hematocrit < 30%); continuation and reinstitution of ESA therapy must include dose reduction of 25% from previously administered dose |
| ESA treatment duration for each course of chemotherapy includes 8 weeks after final dose of myelosuppressive chemotherapy in chemotherapy regimen |
NOTE. Data adapted.7
Abbreviations: ESA, erythropoiesis-stimulating agent; FDA, US Food and Drug Administration; OS, overall survival.
Authors' Disclosures of Potential Conflicts of Interest
The authors indicated no potential conflicts of interest.
Author Contributions
Conception and design: Dawn L. Hershman, Alfred I. Neugut, Jason D. Wright
Financial support: Dawn L. Hershman
Collection and assembly of data: Dawn L. Hershman, Jin Joo Shim
Data analysis and interpretation: All authors
Manuscript writing: All authors
Final approval of manuscript: All authors
References
- 1.Henry DH, Brooks BJ, Jr, Case DC, Jr, et al. Recombinant human erythropoietin therapy for anemic cancer patients receiving cisplatin chemotherapy. Cancer J Sci Am. 1995;1:252–260. [PubMed] [Google Scholar]
- 2.Vansteenkiste J, Pirker R, Massuti B, et al. Double-blind, placebo-controlled, randomized phase III trial of darbepoetin alfa in lung cancer patients receiving chemotherapy. J Natl Cancer Inst. 2002;94:1211–1220. doi: 10.1093/jnci/94.16.1211. [DOI] [PubMed] [Google Scholar]
- 3.Hershman DL, Buono DL, Malin J, et al. Patterns of use and risks associated with erythropoiesis-stimulating agents among Medicare patients with cancer. J Natl Cancer Inst. 2009;101:1633–1641. doi: 10.1093/jnci/djp387. [DOI] [PMC free article] [PubMed] [Google Scholar]
- 4.Besarab A, Bolton WK, Browne JK, et al. The effects of normal as compared with low hematocrit values in patients with cardiac disease who are receiving hemodialysis and epoetin. N Engl J Med. 1998;339:584–590. doi: 10.1056/NEJM199808273390903. [DOI] [PubMed] [Google Scholar]
- 5.Leyland-Jones B, Semiglazov V, Pawlicki M, et al. Maintaining normal hemoglobin levels with epoetin alfa in mainly nonanemic patients with metastatic breast cancer receiving first-line chemotherapy: A survival study. J Clin Oncol. 2005;23:5960–5972. doi: 10.1200/JCO.2005.06.150. [DOI] [PubMed] [Google Scholar]
- 6.Henke M, Laszig R, Rübe C, et al. Erythropoietin to treat head and neck cancer patients with anaemia undergoing radiotherapy: Randomised, double-blind, placebo-controlled trial. Lancet. 2003;362:1255–1260. doi: 10.1016/S0140-6736(03)14567-9. [DOI] [PubMed] [Google Scholar]
- 7.US Food and Drug Administration product label. Epogen (epoetin alfa) for injection. 2010.
- 8.Wright JR, Ung YC, Julian JA, et al. Randomized, double-blind, placebo-controlled trial of erythropoietin in non–small-cell lung cancer with disease-related anemia. J Clin Oncol. 2007;25:1027–1032. doi: 10.1200/JCO.2006.07.1514. [DOI] [PubMed] [Google Scholar]
- 9.Bennett CL, McKoy JM, Henke M, et al. Reassessments of ESAs for cancer treatment in the US and Europe. Oncology (Williston Park) 2010;24:260–268. [PubMed] [Google Scholar]
- 10.Mitka M. New oversight put in place for physicians giving anemia drugs to patients with cancer. JAMA. 2010;303:1355–1356. doi: 10.1001/jama.2010.359. [DOI] [PubMed] [Google Scholar]
- 11.Bohlius J, Schmidlin K, Brillant C, et al. Recombinant human erythropoiesis-stimulating agents and mortality in patients with cancer: A meta-analysis of randomised trials. Lancet. 2009;373:1532–1542. doi: 10.1016/S0140-6736(09)60502-X. [DOI] [PubMed] [Google Scholar]
- 12.Bohlius J, Schmidlin K, Brillant C, et al. Erythropoietin or darbepoetin for patients with cancer: Meta-analysis based on individual patient data. Cochrane Database Syst Rev. 2009;3:CD007303. doi: 10.1002/14651858.CD007303.pub2. [DOI] [PMC free article] [PubMed] [Google Scholar]
- 13.Cotter DJ. Reevaluating erythropoiesis-stimulating agents. N Engl J Med. 2010;362:1743. author reply 1743-1744. [PubMed] [Google Scholar]
- 14.Potosky AL, Riley GF, Lubitz JD, et al. Potential for cancer related health services research using a linked Medicare-tumor registry database. Med Care. 1993;31:732–748. [PubMed] [Google Scholar]
- 15.Du XL, Fang S, Vernon SW, et al. Racial disparities and socioeconomic status in association with survival in a large population-based cohort of elderly patients with colon cancer. Cancer. 2007;110:660–669. doi: 10.1002/cncr.22826. [DOI] [PubMed] [Google Scholar]
- 16.Charlson ME, Sax FL, MacKenzie CR, et al. Assessing illness severity: Does clinical judgment work? J Chronic Dis. 1986;39:439–452. doi: 10.1016/0021-9681(86)90111-6. [DOI] [PubMed] [Google Scholar]
- 17.Klabunde CN, Potosky AL, Legler JM, et al. Development of a comorbidity index using physician claims data. J Clin Epidemiol. 2000;53:1258–1267. doi: 10.1016/s0895-4356(00)00256-0. [DOI] [PubMed] [Google Scholar]
- 18.World Health Organization. International Classification of Disease (ninth revision) http://www.who.int/classifications/icd/en/
- 19.Ferrajoli A, Buzdar AU, Dejesus Y, et al. Usage of erythropoiesis-stimulating agents in cancer patients at an academic cancer center and experience with specific care management tools for anemia. Cancer. 2011;117:3268–3275. doi: 10.1002/cncr.25865. [DOI] [PubMed] [Google Scholar]
- 20.Adams JR, Elting LS, Lyman GH, et al. Use of erythropoietin in cancer patients: Assessment of oncologists' practice patterns in the United States and other countries. Am J Med. 2004;116:28–34. doi: 10.1016/j.amjmed.2003.06.004. [DOI] [PubMed] [Google Scholar]
- 21.Hess G, Nordyke RJ, Hill J, et al. Effect of reimbursement changes on erythropoiesis-stimulating agent utilization and transfusions. Am J Hematol. 2010;85:838–843. doi: 10.1002/ajh.21837. [DOI] [PubMed] [Google Scholar]
- 22.Ludwig H, Aapro M, Bokemeyer C, et al. Treatment patterns and outcomes in the management of anaemia in cancer patients in Europe: Findings from the Anaemia Cancer Treatment (ACT) study. Eur J Cancer. 2009;45:1603–1615. doi: 10.1016/j.ejca.2009.02.003. [DOI] [PubMed] [Google Scholar]
- 23.Luo W, Nordstrom BL, Fraeman K, et al. Adherence to guidelines for use of erythropoiesis-stimulating agents in patients with chemotherapy-induced anemia: Results of a retrospective study of an electronic medical-records database in the United States, 2002-2006. Clin Ther. 2008;30:2423–2435. doi: 10.1016/j.clinthera.2008.12.022. [DOI] [PubMed] [Google Scholar]
- 24.Nordstrom BL, Luo W, Fraeman K, et al. Use of erythropoiesis-stimulating agents among chemotherapy patients with hemoglobin exceeding 12 grams per deciliter. J Manag Care Pharm. 2008;14:858–869. doi: 10.18553/jmcp.2008.14.9.858. [DOI] [PMC free article] [PubMed] [Google Scholar]
- 25.Steinmetz T, Totzke U, Söling U, et al. Hemoglobin levels that trigger erythropoiesis-stimulating agent treatment decisions for cancer-associated anemia: Examination of practice in Germany. Curr Med Res Opin. 2008;24:2751–2756. doi: 10.1185/03007990802377057. [DOI] [PubMed] [Google Scholar]
- 26.Klarenbach S, Manns B, Reiman T, et al. Economic evaluation of erythropoiesis-stimulating agents for anemia related to cancer. Cancer. 2010;116:3224–3232. doi: 10.1002/cncr.25052. [DOI] [PubMed] [Google Scholar]
- 27.Sheffield R, Sullivan SD, Saltiel E, et al. Cost comparison of recombinant human erythropoietin and blood transfusion in cancer chemotherapy-induced anemia. Ann Pharmacother. 1997;31:15–22. doi: 10.1177/106002809703100101. [DOI] [PubMed] [Google Scholar]
- 28.Lasser KE, Allen PD, Woolhandler SJ, et al. Timing of new black box warnings and withdrawals for prescription medications. JAMA. 2002;287:2215–2220. doi: 10.1001/jama.287.17.2215. [DOI] [PubMed] [Google Scholar]
- 29.Mitka M. FDA takes slow road toward withdrawal of drug approved with fast-track process. JAMA. 2011;305:982, 984. doi: 10.1001/jama.2011.269. [DOI] [PubMed] [Google Scholar]
- 30.Warren JL, Klabunde CN, Schrag D, et al. Overview of the SEER-Medicare data: Content, research applications, and generalizability to the United States elderly population. Med Care. 2002;40(suppl):IV3–IV18. doi: 10.1097/01.MLR.0000020942.47004.03. [DOI] [PubMed] [Google Scholar]