

Among patients receiving radiation therapy (RT) in the last month of life, there was a shift away from the simplest technique toward more advanced RT technologies.
Abstract
Purpose:
We sought to analyze trends in radiation therapy (RT) technology use and costs in the last 30 days of life for patients dying as a result of cancer.
Methods:
We used the Surveillance, Epidemiology, and End Results (SEER) –Medicare and Texas Cancer Registry–Medicare databases to analyze claims data for 13,488 patients dying as a result of lung, breast, prostate, colorectal, melanoma, and pancreas cancers from 2000 to 2009. Logistic regression modeling was used to conduct adjusted analyses regarding influence of demographic, clinical, and health services variables on receipt of types of RT. Costs were calculated in 2009 US dollars.
Results:
The proportion of patients treated with two-dimensional RT decreased from 74.9% of those receiving RT in the last 30 days of life in 2000 to 32.7% in 2009 (P < .001). Those receiving three-dimensional RT increased from 27.2% in 2000 to 58.5% in 2009 (P < .001). The proportion of patients treated with intensity-modulated radiation therapy in the last 30 days of life increased from 0% in 2000 to 6.2% in 2009 (P < .001), and those undergoing stereotactic radiosurgery increased from 0% in 2000 to 5.0% in 2009 (P < .001). The adjusted mean costs of per-patient RT services delivered in the last 30 days of life were higher in the years 2007 to 2009.
Conclusion:
Among patients receiving RT in the last month of life, there was a shift away from the simplest technique toward more advanced RT technologies. Studies are needed to ascertain whether these technology shifts improve palliative outcomes and quality of life for patients dying as a result of cancer who receive RT services.
Introduction
Multiple studies have shown that advanced radiation therapy (RT) techniques have rapidly diffused into radiation oncology practice over the last one to two decades. Specifically, there has been a transition away from two-dimensional RT (2DRT) planning, which allows for rapid but limited conformality in planning to cover targeted treatment volumes, toward more conformal and normal-tissue–sparing techniques, such as three-dimensional RT (3DRT), intensity-modulated RT (IMRT), and in appropriate settings, stereotactic radiosurgery (SRS). This shift toward use of more advanced and resource-intensive RT techniques has been accompanied, in some scenarios, by data showing that these advancements were associated with improved cancer-control outcomes. Specifically, investigators have shown improved survival among patients undergoing 3DRT for stage III lung cancer1 and improved cancer-specific survival among patients treated curatively with IMRT for head and neck cancers.2 However, most of the studies conferring clinical benefit of these advanced radiotherapy techniques focused on patients treated for curable presentations of cancer.3 There are no published data documenting improved cancer-control or toxicity outcomes with use of 3DRT or IMRT in the palliative setting for patients with incurable cancer, although a survey of radiation oncologists did show that 57% of practitioners had used IMRT for palliation in 2004.4 Similarly, a recent analysis of the SEER-Medicare data showed that patients diagnosed with advanced cancer were treated with increasingly advanced RT techniques in their final year of life.5
The trend toward the end-of-life use of more advanced radiotherapy techniques among patients with incurable cancer has important clinical and policy implications. Concerns over the unsustainable growth in medical expenditures have directed policy makers to focus not only on the intensity of care but also on the costs of end-of-life care.6 Radiation oncology care is likely to be a focus of cost-containment scrutiny, given that recent Medicare data have shown that radiation oncology costs have outstripped their expected growth rate over the last decade.7 We sought to analyze whether cost trends for RT services in the final 30 days of life had changed in conjunction with any changes in technology use trends during that time period.
Methods
Data Source and Cohort Definition
We conducted this study by combining the Surveillance, Epidemiology, and End Results (SEER) –Medicare linked database with the Texas Cancer Registry (TCR) –Medicare linked database. The SEER program (a National Cancer Institute–supported database) consists of tumor registries in 17 geographic areas and, when added to the Texas cancer registry, covers approximately 30% of the US population.8 The Medicare program covers medical services for 97% of US citizens age 65 years and older.9,10 Data in the SEER files are linked to the Medicare claims files via encrypted person identifiers, and the TCR files are linked to Medicare using probabilistic linkage methods that protect individual patient privacy to obtain utilization data. All data were de-identified such that no protected health information could be linked to individual patients, and the MD Anderson Cancer Center's institutional review board exempted this study.
We identified 13,488 patients age 66 years or older who died as a result of breast, colorectal, lung, melanoma, prostate, and pancreas cancers between January 1, 2000, and December 31, 2009, and received RT in their final 30 days of life. The patients' causes of death were determined using the ninth and 10th revisions of the International Classification of Disease Codes (ICD-9 and ICD-10). These six cancers comprise over 60% of cancer causes of death.11 The Data Supplement shows the cohort development from the SEER-Medicare and TCR-Medicare databases and the selection criteria for this analysis.
Identification of RT Type
RT receipt was identified using Current Procedural Terminology codes to confirm RT delivery (77401 to 77416 for conventional RT; 77418 for IMRT; 77371-77373 for SRS). We determined the type of RT delivered by mapping simulation and planning codes (77300, 77305-15 [in absence of code 77295] for 2DRT; 77295 [with planning codes 77305-77315] for 3DRT; 77301 for IMRT) to RT delivery codes. We identified an initial or index date of RT delivery looking back 3 months from date of death to ensure that we did not count an RT course that had started antecedent to the final 30 days of life as having occurred within that window. We then assessed time intervals of up to 10 weeks after an index (initial) RT delivery claim date to identify the simulation/planning code corresponding to that index RT delivery date. A subsequent simulation/planning code within that interval was considered to represent a new RT course. If multiple simulation/planning codes occurred within 7 days of each other, then these were considered to be in reference to the same RT course, and the highest level planning code was used to designate the type of RT delivered. If no planning code was present, then the course was considered to be 2DRT. RT courses were only designated as having occurred within the last 30 days of life if the index RT delivery claims date occurred within the last 30 days of life.
Independent Variables
We included sociodemographic, clinical, and health services variables in our models analyzing RT type and costs. Independent variables included year of death (2000-2009), age at death, sex, race/ethnicity, cancer type, marital status, geographic region, and urban versus rural residence. We linked the SEER-Medicare and TCR-Medicare databases to the Area Resource File12 via state and county codes to ascertain the density of radiation oncologists, which was defined as the number of radiation oncologists (per 100,000) practicing within each patient's health service area. Comorbidity was determined by using Kalbunde's algorithm, which calculates a modified Charlson comorbidity score13 on the basis of outpatient and inpatient claims within a 12-month window before cancer diagnosis.14–16 Because cancer diagnosis preceded death by many years for some patients, those with missing data were given a Charlson status of “unknown,” which limits interpretation of this variable in this study.
Statistical Analyses and Costs
Statistical analyses were conducted with the SAS systems software for Windows (version 9.2; SAS Institute, Cary, NC) and STATA (version 12.0; STATA, College Station, TX). We performed the Cochrane Armitage test for trend to assess the change in the proportion of patients who received RT in the last 30 days of life from 2000 to 2009. Costs of care were calculated from the payer's perspective (amount reimbursed by Medicare) and included all costs associated with any RT-related codes that were incurred in the 30-day time period before death. We only assessed Part B claims (including revenue center codes 0330 and 0333 for hospital outpatient services) because itemized RT-related costs are not distinctly available for Part A. Costs were normalized to the 2009 US dollar by using the Medicare Economic Index17 for Medicare Part B. Costs were also adjusted for geographic variation by using the geographic practice cost index for Part B claims. Cost data were analyzed to assess trends in Medicare costs using the extended estimating equations method.18
Results
Types of RT Technologies Used in the Last 30 Days of Life
Of 13,488 patients who received RT in the last 30 days of life in this cohort, 7,661 (56.8%) were treated using 2DRT. There was a significant decrease in the proportion of patients treated with 2DRT from 74.9% of those receiving RT in the last 30 days of life in 2000 to 32.7% in 2009 (P < .001). Conversely, of those patients receiving RT, the proportion treated with 3DRT in the last 30 days of life increased from 27.2% in 2000 to 58.5% in 2009 (P < .001). There was also a significant increase in the proportion of patients treated with IMRT in the last 30 days of life, from 0% in 2000 to 6.2% in 2009 (P < .001). A similar trend was observed for the use of SRS in the last 30 days, from 0% of patients who received any RT in 2000 to 5.0% in 2009 (P < .001).
Figure 1 shows the trends in utilization of the types of RT as a percent of the total courses of RT delivered to patients in the last 30 days of life from 2000 to 2009. The proportion of RT courses delivered in the last 30 days of life that were 3DRT first exceeded 2DRT courses in the second half of 2006. The Data Supplement (univariable data) shows the proportion of patients who received either IMRT, 3DRT, or 2DRT by sociodemographic or health services characteristics. Data for the proportion receiving SRS are not shown because the number of patients was below the threshold to protect patient privacy per the SEER-Medicare data user agreement.
Figure 1.
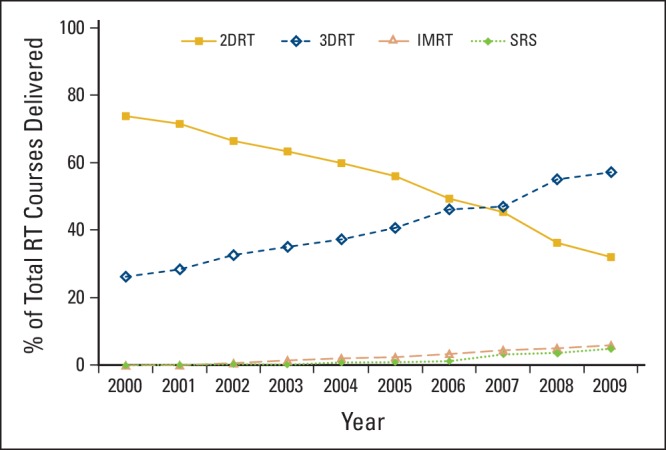
Use of types of radiation therapy (RT) technologies as a percent of the total number of courses of RT delivered to patients in the last 30 days of life from 2000 to 2009. 2DRT, two-dimensional RT; 3DRT, three-dimensional RT; IMRT, intensity-modulated RT; SRS, stereotactic radiosurgery.
Multivariable modeling evaluating patient, tumor, and health services factors associated with receipt of 2DRT compared with other modalities revealed that patients dying as a result of prostate cancer were significantly more likely to receive 2DRT, whereas patients with pancreatic cancer were least likely to receive 2DRT (Table 1). Use of 2DRT was significantly more likely in Texas and significantly less likely in the Southern SEER region (Georgia, Louisiana, Kentucky). Patients with a Charlson comorbidity score of 2 or more were less likely to receive 2DRT, and patients with an unknown Charlson score were more likely to receive 2DRT. Patients living in urban areas were also more likely to have undergone 2DRT. Multivariable modeling that assessed receipt of IMRT compared with non-IMRT techniques (Table 1) while adjusting for all patient, tumor, and health services characteristics showed that patients dying as a result of colorectal or pancreatic cancer were significantly more likely to receive IMRT in the final 30 days of life compared with patients with lung, breast, prostate, or melanoma cancers. Table 1 also shows the multivariable model results assessing adjusted likelihood of receipt of SRS. This revealed that patients dying as a result of melanoma were more likely to be treated with SRS. Patients living in urban areas and those residing in the Southern SEER region were significantly less likely to be treated with SRS.
Table 1.
Adjusted Analysis of Type of Radiation Therapy by Sociodemographic and Health Services Characteristics
| Characteristic | 2DRT (no SRS) |
IMRT (no SRS) |
SRS |
|||
|---|---|---|---|---|---|---|
| OR | 95% CI | OR | 95% CI | OR | 95% CI | |
| Sex | ||||||
| Male | ||||||
| Female | 1.08 | 1.000 to 1.162 | 0.96 | 0.765 to 1.211 | 1.14 | 0.848 to 1.520 |
| Ethnicity | ||||||
| White | ||||||
| African American | 1.00 | 0.876 to 1.140 | 0.94 | 0.619 to 1.416 | 0.45 | 0.198 to 1.026 |
| Hispanic | 0.98 | 0.842 to 1.150 | 1.38 | 0.909 to 2.084 | 0.73 | 0.367 to 1.441 |
| Other | 1.13 | 0.930 to 1.380 | 2.16 | 1.397 to 3.345 | 0.96 | 0.459 to 1.991 |
| Tumor/cause of death | ||||||
| Lung | ||||||
| Breast | 1.07 | 0.923 to 1.240 | 0.71 | 0.422 to 1.205 | 0.93 | 0.510 to 1.713 |
| Colorectal | 0.88 | 0.757 to 1.022 | 1.66 | 1.127 to 2.442 | 1.22 | 0.687 to 2.183 |
| Melanoma | 0.99 | 0.793 to 1.241 | 0.76 | 0.333 to 1.722 | 7.13 | 4.784 to 10.627 |
| Pancreas | 0.64 | 0.508 to 0.802 | 3.38 | 2.193 to 5.194 | 0.91 | 0.334 to 2.481 |
| Prostate | 1.30 | 1.113 to 1.520 | 0.97 | 0.595 to 1.570 | 0.28 | 0.086 to 0.883 |
| Region | ||||||
| Midwest | ||||||
| Northeast | 1.10 | 0.959 to 1.253 | 0.78 | 0.501 to 1.227 | 1.04 | 0.616 to 1.746 |
| South | 0.78 | 0.690 to 0.882 | 1.15 | 0.772 to 1.720 | 0.54 | 0.313 to 0.928 |
| West | 1.06 | 0.939 to 1.198 | 1.00 | 0.674 to 1.495 | 1.24 | 0.780 to 1.983 |
| Texas | 1.98 | 1.713 to 2.293 | 1.06 | 0.675 to 1.663 | 0.99 | 0.565 to 1.741 |
| Charlson comorbidity score | ||||||
| 0 | ||||||
| 1 | 1.00 | 0.912 to 1.085 | 1.20 | 0.921 to 1.570 | 1.15 | 0.826 to 1.611 |
| ≥ 2 | 0.85 | 0.763 to 0.938 | 1.20 | 0.875 to 1.656 | 0.95 | 0.616 to 1.475 |
| Unknown | 1.18 | 1.057 to 1.326 | 1.29 | 0.927 to 1.793 | 0.84 | 0.530 to 1.339 |
| Area | ||||||
| Rural | ||||||
| Urban | 1.17 | 1.042 to 1.316 | 1.20 | 0.818 to 1.774 | 0.57 | 0.360 to 0.901 |
| Radiation oncologist density | ||||||
| Lowest level | ||||||
| 2nd level | 1.05 | 0.949 to 1.167 | 1.32 | 0.959 to 1.822 | 1.31 | 0.841 to 2.027 |
| 3rd level | 0.86 | 0.773 to 0.950 | 1.41 | 1.025 to 1.945 | 1.61 | 1.046 to 2.462 |
| Highest level | 0.98 | 0.878 to 1.087 | 1.11 | 0.785 to 1.571 | 1.54 | 0.982 to 2.399 |
| Age at death, years | ||||||
| < 70 | ||||||
| 70-74 | 0.98 | 0.889 to 1.087 | 1.05 | 0.781 to 1.413 | 0.76 | 0.511 to 1.123 |
| 75-80 | 1.05 | 0.951 to 1.167 | 0.72 | 0.517 to 0.998 | 0.77 | 0.517 to 1.144 |
| ≥ 80 | 0.91 | 0.823 to 1.013 | 0.96 | 0.702 to 1.315 | 0.79 | 0.532 to 1.180 |
NOTE. Bold indicates statistical significance (P < .05).
Abbreviations: 2DRT, two-dimensional radiation therapy; IMRT, intensity-modulated radiation therapy; OR, odds ratio; SRS, stereotactic radiosurgery.
Costs Associated With RT Claims in the Last 30 Days of Life
We analyzed total amount reimbursed by Medicare Part B for all RT delivery, simulation, planning, management, physics, and device claims (including revenue center codes 0330 and 0333 for hospital outpatient services) among patients in our cohort treated with RT in the last 30 days of life. The total aggregated annual amount reimbursed by Medicare for RT services for all patients each year did not significantly increase from 2000 to 2009. However, the mean per-patient annual costs of RT services for patients who began an RT course in the final 30 days of life significantly increased from 2000 to 2009 (Fig A1; online only). We constructed a model to analyze costs adjusting for year of death (as a categorical variable), age at death, sex, race/ethnicity, cancer type causing death, comorbidity score, urban versus rural residence of the patient, neighborhood income level, neighborhood educational level, density of radiation oncologists per health service area, and geographic region (Table 2). In this adjusted analysis, Medicare reimbursement costs for RT services in the last 30 days of life were significantly higher during the years 2007 to 2009. Also, Medicare reimbursement costs were significantly lower for patients with unknown comorbidity scores as well as those dying as a result of breast cancer, prostate cancer, or melanoma. Nonclinical factors associated with significantly lower RT-related costs were: black race, residing in the Northeast and Texas (compared with the Western, Midwestern, and Southern Regions), and urban residence.
Table 2.
Unadjusted and Adjusted Mean Costs of Radiation Therapy Services in the Last 30 Days of Life
| Variable | Mean Cost ($) | Unadjusted ($) |
Adjusted Estimate ($) |
||
|---|---|---|---|---|---|
| Difference | 95% CI | Difference | 95% CI | ||
| Year of death | |||||
| 2000 (ref) | 3,671 | — | |||
| 2001 | 3,934 | 262 | −375 to 899 | 57 | −273 to 387 |
| 2002 | 3,663 | −8 | −632 to 616 | −144 | −467 to 179 |
| 2003 | 3,793 | 121 | −496 to 738 | −64 | −378 to 249 |
| 2004 | 3,672 | 1 | −612 to 614 | −221 | −544 to 103 |
| 2005 | 3,902 | 231 | −390 to 852 | −43 | −379 to 293 |
| 2006 | 3,938 | 267 | −355 to 889 | 189 | −195 to 573 |
| 2007 | 4,212 | 541 | −85 to 1,167 | 424 | 51 to 798 |
| 2008 | 4,489 | 818 | 171 to 1,465 | 442 | 51 to 834 |
| 2009 | 4,549 | 878 | 222 to 1,534 | 680 | 263 to 1,097 |
| Age at death, years | |||||
| < 70 (ref) | 3,982 | — | — | ||
| 70-74 | 4,071 | 90 | −227 to 406 | 11 | −211 to 234 |
| 75-79 | 3,902 | −80 | −400 to 241 | −93 | −310 to 124 |
| ≥ 80 | 3,908 | −74 | −395 to 248 | −105 | −339 to 128 |
| Ethnicity | |||||
| White (ref) | 4,011 | — | — | ||
| African American | 3,460 | −551 | −963 to −139 | −506 | −778 to −234 |
| Hispanic | 3,894 | −117 | −601 to 367 | 43 | −282 to 367 |
| Other | 4,123 | 112 | −498 to 722 | −145 | −751 to 460 |
| Tumor/cause of death | |||||
| Lung (ref) | 4,052 | — | — | ||
| Colorectal | 4,395 | 343 | −183 to 869 | 396 | −24 to 816 |
| Pancreas | 4,123 | 71 | −745 to 887 | 293 | −466 to 1,051 |
| Breast | 3,329 | −723 | −1,200 to −246 | −586 | −829 to −342 |
| Prostate | 3,296 | −756 | −1,267 to −246 | −554 | −844 to −263 |
| Melanoma | 3,637 | −416 | −1,171 to 340 | −547 | −901 to −194 |
| Charlson comorbidity score | |||||
| 0 (ref) | 4,017 | — | — | ||
| 1 | 4,095 | 78 | −197 to 352 | 26 | −163 to 215 |
| ≥ 2 | 4,073 | 56 | −271 to 383 | 45 | −194 to 283 |
| Unknown | 3,453 | −564 | −898 to −231 | −274 | −490 to −59 |
| Rural/urban | |||||
| Rural (ref) | 4,494 | — | — | ||
| Urban | 3,898 | −596 | −855 to −337 | −425 | −750 to −100 |
| Radiation oncologist density | |||||
| Lowest level (ref) | 4,077 | — | — | ||
| 2nd level | 3,806 | −272 | −579 to 35 | −45 | −281 to 191 |
| 3rd level | 3,963 | −114 | −418 to 190 | 6 | −240 to 252 |
| Highest level | 4,018 | −59 | −367 to 248 | −120 | −380 to 139 |
| Area | |||||
| Northeast (ref) | 3,041 | — | — | ||
| West | 4,333 | 1,292 | 953 to 1,631 | 1,222 | 915 to 1,530 |
| Midwest | 4,364 | 1,323 | 909 to 1,737 | 1,405 | 1,019 to 1,790 |
| South | 4,356 | 1,315 | 953 to 1,678 | 1,206 | 880 to 1,532 |
| Texas | 3,150 | 109 | −314 to 532 | 184 | −75 to 443 |
NOTE. Bold indicates statisical significance (P < .05).
Abbreviation: ref, reference.
Discussion
We observed substantial decrease in use of the simplest and least resource-intensive radiation therapeutic technique, 2DRT, for patients receiving RT in their final 30 days of life. We observed a corresponding increase in the use of 3DRT in the final 30 days of life, with 3DRT being the predominant technique among RT courses since late 2006. Similarly, although the overall proportion of patients receiving IMRT or SRS in the final month of life was low, the trend showed an increase from zero use of these technologies during the final month of life in patients who died of these cancers in 2000 to more than one in 20 patients treated with each of these more advanced techniques in 2009.
The finding of a trend toward 3DRT becoming the dominant RT technique for RT delivery at the end of life is unsurprising, given the widespread diffusion of 3D planning using computed tomography into RT practice in the United States over the past two decades. Several studies have confirmed the dosimetric advantage that 3DRT offers as a result of better target visualization and plan optimization, even in the palliative radiotherapy setting.19–22 However, to our knowledge, only one study, by Pope et al,22 has specifically sought to correlate that advantage with improved clinical outcome, and it did not find a significant improvement in patient-reported pain relief with 3DRT compared with 2DRT for patients with bone metastases.
The finding of increasing SRS use at the end of life for patients with metastatic cancer is also unsurprising, given that this modality was, in part, developed to treat metastatic disease and often offers a shortened and thus more convenient treatment course for select patients with advanced cancer (eg, patients with brain metastases who might have previously received 10 days of whole-brain radiotherapy).23–26 However, the finding of increased use of IMRT in this setting is significant considering that there are no published data assessing whether the use of IMRT improves outcomes for patients with end-stage cancer over the use of more conventional RT techniques (2DRT or 3DRT). However, it should be noted that the overall percentage of IMRT use remains low in this cohort of Medicare beneficiaries, especially in consideration of a survey study reporting that 57% of radiation oncologists have used IMRT for palliation.4 IMRT allows greater conformality of the full prescribed radiotherapy dose around a target compared with conventional RT techniques, which likely explains our finding that patients dying as a result of colorectal and pancreatic cancer were more likely to receive IMRT, given the complex and sensitive anatomy near tumors in the abdomen and pelvis. Studies of IMRT use have focused on nonmetastatic presentations of cancers in patients for whom treatment intent was curative. These studies have shown that IMRT improves rates of long-term complications of radiation treatment, for example, IMRT improved salivary function in patients treated for head and neck cancers or decreased rectal and genitourinary complications of prostate cancer treatment.3 However, no studies have specifically addressed potential reduction of acute toxicity with IMRT, which might be most relevant to patients with limited life expectancy who are receiving palliative RT, and this presents an important question for further investigation.
Not surprisingly, the shift toward more advanced, resource-intensive RT techniques delivered in the final 30 days of life has corresponded to significant annual increase in per-patient costs to Medicare for RT services delivered from 2007 to 2009. The finding that total aggregated annual RT costs to Medicare in the final 30 days of life did not significantly increase may be the result of a previous finding that the proportion of patients dying as a result of cancer who receive RT in the last month of life is significantly decreasing.27 This raises an interesting related question as to whether patients are less frequently being referred for palliative radiotherapy consultations at the end of life or whether they consult with a radiation oncologist and are increasingly likely to forego RT for end-stage cancer. Although overall radiation oncology physician services costs to Medicare have rapidly risen over the last decade,7 investigators have documented that the largest component of costs of cancer care are hospitalization costs.28 Thus, an important question to explore in future research is whether the increase in per-patient cost of RT driven by more intensive use of new technologies could be justified by improvements in palliation or decreased acute adverse effects (compared with the less expensive conventional RT techniques) that might allow patients with end-stage cancer to avoid hospitalization or acute care episodes in their final weeks of life. Cost-effectiveness studies that incorporate symptom and quality-of-life outcomes for various radiotherapeutic techniques are needed to ascertain the relative value of advanced technology diffusion in end-of-life radiation oncology care.
There are several important limitations to consider in this patterns-of-care analysis using claims linked to cancer registry data. First, we are unable to determine the intent (ie, palliative v curative) of radiation treatment among patients in this cohort. These registries do not contain information regarding patient preferences, physician decision making, or performance status of these patients. Second, the use of death as the reference point can be controversial.29 Although the assumption inherent in designing the study using death as the retrospective reference point is that these patients were treated with palliative intent, studies show that physicians are not able to consistently accurately predict survival times for individual patients.29–31 However, it should be noted that other investigators have used death as the study reference point to identify patterns of chemotherapy use, surgical care, and other end-of-life quality-of-care measures.32–34
In conclusion, our study showed that the trends toward greater use of more advanced RT techniques observed in other settings extends into the final month of life for patients dying as a result of cancer. This study emphasizes the need for additional research into whether diffusion of advanced RT technologies into end-of-life care improves quality of life and palliative goals of therapy for patients with end-stage cancer. Furthermore, the finding of increasing per-patient Medicare payments for RT services among those who received RT in the last month of life identifies the need for cost-effectiveness analyses to assess whether such an increase might be associated with added value from decreased costs associated with hospitalization or other modalities for symptom management among patients dying as a result of cancer.
Supplementary Material
Acknowledgment
Supported by Grant No. 1R21CA164449-01A1 from the National Institutes of Health, National Cancer Institute (B.A.G.) and Comparative Effectiveness Research on Cancer in Texas Grant No. RP101207 to the Cancer Prevention and Research Institute of Texas (L.S.E. and S.H.G.).
This study used the linked Surveillance, Epidemiology, and End Results (SEER) –Medicare database. The interpretation and reporting of these data are the sole responsibility of the authors. We thank the Applied Research Program, National Cancer Institute; the Office of Research, Development and Information, Centers for Medicare and Medicaid Services; Information Management Services (IMS); and the SEER Program registries for their efforts in the creation of the SEER-Medicare database. This article as been approved by IMS as compliant with the database user agreement.
The collection of cancer incidence data used in this study was supported by the Texas Department of State Health Services (DSHS) and Cancer Prevention Research Institute of Texas (CPRIT) as part of the statewide cancer reporting program and the Centers for Disease Control and Prevention (CDC) National Program of Cancer Registries Cooperative Agreement No. 5U58/DP000824-05. The contents of this study are solely the responsibility of its authors and do not necessarily represent the official views of the DSHS, CPRIT, or CDC.
Appendix
Figure A1.
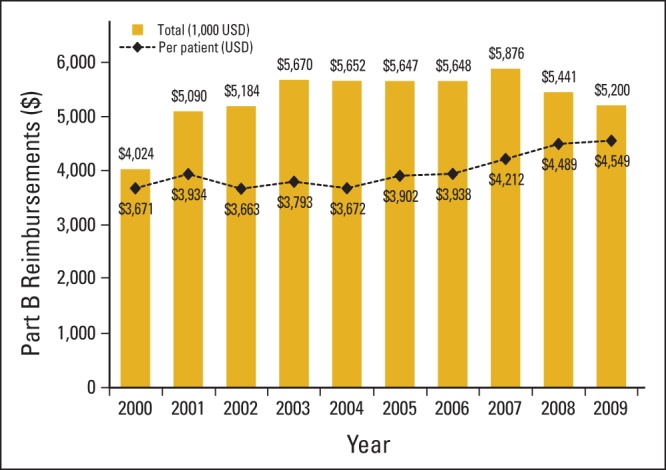
Aggregated and mean per-patient costs reimbursed by Medicare for radiation therapy (RT) services for patients beginning an RT course in the final 30 days of life from 2000 to 2009. USD, US dollars.
Authors' Disclosures of Potential Conflicts of Interest
The authors indicated no potential conflicts of interest.
Author Contributions
Conception and design: B. Ashleigh Guadagnolo
Financial support: B. Ashleigh Guadagnolo, Linda S. Elting
Administrative support: B. Ashleigh Guadagnolo, Sharon H. Giordano, Linda S. Elting
Collection and assembly of data: B. Ashleigh Guadagnolo
Data analysis and interpretation: All authors
Manuscript writing: All authors
Final approval of manuscript: All authors
References
- 1.Chen AB, Neville BA, Sher DJ, et al. Survival outcomes after radiation therapy for stage III non–small-cell lung cancer after adoption of computed tomography-based simulation. J Clin Oncol. 2011;29:2305–2311. doi: 10.1200/JCO.2010.33.4466. [DOI] [PubMed] [Google Scholar]
- 2.Beadle BM, Liao KP, Elting LS, et al. Improved survival using intensity-modulated radiation therapy in head and neck cancers: A SEER-Medicare analysis. Cancer. 2014;120:702–710. doi: 10.1002/cncr.28372. [DOI] [PubMed] [Google Scholar]
- 3.Veldeman L, Madani L, Hulstaert F, et al. Evidence behind use of intensity-modulated radiotherapy: A systematic review of comparative clinical studies. Lancet Oncol. 2008;9:367–375. doi: 10.1016/S1470-2045(08)70098-6. [DOI] [PubMed] [Google Scholar]
- 4.Mell LK, Mehrotra AK, Mundt AJ. Intensity-modulated radiation therapy use in the U.S., 2004. Cancer. 2005;104:1296–1303. doi: 10.1002/cncr.21284. [DOI] [PubMed] [Google Scholar]
- 5.Guadagnolo BA, Huo J, Liao KP, et al. Changing trends in radiation therapy technologies in the last year of life for patients diagnosed with metastatic cancer in the United States. Cancer. 2013;119:1089–1097. doi: 10.1002/cncr.27835. [DOI] [PMC free article] [PubMed] [Google Scholar]
- 6.Riley GF, Lubitz JD. Long-term trends in Medicare payments in the last year of life. Health Serv Res. 2010;45:565–576. doi: 10.1111/j.1475-6773.2010.01082.x. [DOI] [PMC free article] [PubMed] [Google Scholar]
- 7.Alhassani A, Chandra A, Chernew ME. The sources of the SGR ‘hole’. N Engl J Med. 2012;366:289–291. doi: 10.1056/NEJMp1113059. [DOI] [PubMed] [Google Scholar]
- 8.National Cancer Institute. Surveillance Epidemiology and End Results. http://seer.cancer.gov.
- 9.Warren JL, Klabunde CN, Schrag D, et al. Overview of the SEER-Medicare data: Content, research applications, and generalizability to the United States elderly population. Med Care. 2002;4D(suppl 8):IV-3-18. doi: 10.1097/01.MLR.0000020942.47004.03. [DOI] [PubMed] [Google Scholar]
- 10.Potosky AL, Riley GF, Lubitz JD, et al. Potential for cancer related health services research using a linked Medicare-tumor registry database. Med Care. 1993;31:732–748. [PubMed] [Google Scholar]
- 11.Jemal A, Siegel R, Xu J, et al. Cancer statistics, 2010. CA Cancer J Clin. 2010;60:277–300. doi: 10.3322/caac.20073. [DOI] [PubMed] [Google Scholar]
- 12.US Department of Health and Human Services. Health Resources and Services Administration Health Professions: Area resource file (ARF) national county-level health resource information database. http://arg.hrsa.gov.
- 13.Charlson ME, Pompei P, Ales KL, et al. A new method of classifying prognostic comorbidity in longitudinal studies: Development and validation. J Chronic Dis. 1987;40:373–383. doi: 10.1016/0021-9681(87)90171-8. [DOI] [PubMed] [Google Scholar]
- 14.Klabunde CN, Potosky AL, Legler JM, et al. Development of a comorbidity index using physician claims data. J Clin Epidemiol. 2000;53:1258–1267. doi: 10.1016/s0895-4356(00)00256-0. [DOI] [PubMed] [Google Scholar]
- 15.Klabunde CN, Legler JM, Warren JL, et al. A refined comorbidity measurement algorithm for claims-based studies of breast, prostate, colorectal, and lung cancer patients. Ann Epidemiol. 2007;17:584–590. doi: 10.1016/j.annepidem.2007.03.011. [DOI] [PubMed] [Google Scholar]
- 16.Klabunde CN, Harlan LC, Warren JL. Data sources for measuring comorbidity: A comparison of hospital records and Medicare claims for cancer patients. Med Care. 2006;44:921–928. doi: 10.1097/01.mlr.0000223480.52713.b9. [DOI] [PubMed] [Google Scholar]
- 17.Centers for Medicare & Medicaid Services. Quarterly index levels in the CMS Medicare economic index using IHS Global Insight Inc (IGI) forecast assumptions, by expense category 1996-2021. http://www.cms.gov/Research-Statistics-Data-and-Systems/Statistics-Trends-and-Reports/MedicareProgramRatesStats/Downloads/mktbskt-summary.pdf.
- 18.Basu A, Rathouz PJ. Estimating marginal and incremental effects on health outcomes using flexible link and variance function models. Biostatistics. 2005;6:93–109. doi: 10.1093/biostatistics/kxh020. [DOI] [PubMed] [Google Scholar]
- 19.Gripp S, Doeker R, Glag M, et al. The role of CT simulation in whole-brain irradiation. Int J Radiat Oncol Biol Phys. 1999;45:1081–1088. doi: 10.1016/s0360-3016(99)00292-8. [DOI] [PubMed] [Google Scholar]
- 20.Haddad P, Cheung F, Pond G, et al. Computerized tomographic simulation compared with clinical mark-up in palliative radiotherapy: A prospective study. Int J Radiat Oncol Biol Phys. 2006;65:824–829. doi: 10.1016/j.ijrobp.2006.01.034. [DOI] [PubMed] [Google Scholar]
- 21.McJury M, Fisher PM, Pledge S, et al. The impact of virtual simulation in palliative radiotherapy for non-small-cell lung cancer. Radiother Oncol. 2001;59:311–318. doi: 10.1016/s0167-8140(01)00308-5. [DOI] [PubMed] [Google Scholar]
- 22.Pope K, Fitzpatrick D, Potter A, et al. Dosimetric and clinical impact of 3D vs. 2D planning in palliative radiotherapy for bone metastases. Support Care Cancer. 2013;21:2229–2235. doi: 10.1007/s00520-013-1777-8. [DOI] [PubMed] [Google Scholar]
- 23.Park HS, Chiang VL, Knisely JP, et al. Stereotactic radiosurgery with or without whole-brain radiotherapy for brain metastases: An update. Expert Rev Anticancer Ther. 2011;11:1731–1738. doi: 10.1586/era.11.165. [DOI] [PubMed] [Google Scholar]
- 24.Chawla S, Schell MC, Milano MT. Stereotactic body radiation for the spine: A review. Am J Clin Oncol. 2013;36:630–636. doi: 10.1097/COC.0b013e31822dfd71. [DOI] [PubMed] [Google Scholar]
- 25.Høyer M, Swaminath A, Bydder S, et al. Radiotherapy for liver metastases: A review of evidence. Int J Radiat Oncol Biol Phys. 2012;82:1047–1057. doi: 10.1016/j.ijrobp.2011.07.020. [DOI] [PubMed] [Google Scholar]
- 26.Dahele M, Senan S. The role of stereotactic ablative radiotherapy for early-stage and oligometastatic non-small cell lung cancer: Evidence for changing paradigms. Cancer Res Treat. 2011;43:75–82. doi: 10.4143/crt.2011.43.2.75. [DOI] [PMC free article] [PubMed] [Google Scholar]
- 27.Guadagnolo BA, Liao KP, Elting L, et al. Use of radiation therapy in the last 30 days of life among a large population-based cohort of elderly patients in the United States. J Clin Oncol. 2013;31:80–87. doi: 10.1200/JCO.2012.45.0585. [DOI] [PMC free article] [PubMed] [Google Scholar]
- 28.Yabroff KR, Lamont EB, Mariotto A, et al. Cost of care for elderly cancer patients in the United States. J Natl Cancer Inst. 2008;100:630–641. doi: 10.1093/jnci/djn103. [DOI] [PubMed] [Google Scholar]
- 29.Hartsell WF. Myth: We can tailor palliative care to match life expectancy. Reality: No we can't. Cancer. 2010;116:3078–3079. doi: 10.1002/cncr.25118. [DOI] [PubMed] [Google Scholar]
- 30.Hartsell WF, Desilvio M, Bruner DW, et al. Can physicians accurately predict survival time in patients with metastatic cancer? Analysis of RTOG 97-14. J Palliat Med. 2008;11:723–728. doi: 10.1089/jpm.2007.0259. [DOI] [PubMed] [Google Scholar]
- 31.Glare P, Virik K, Jones M, et al. A systematic review of physicians' survival predictions in terminally ill cancer patients. BMJ. 2003;327:195–198. doi: 10.1136/bmj.327.7408.195. [DOI] [PMC free article] [PubMed] [Google Scholar]
- 32.Earle CC, Neville BA, Landrum MB, et al. Trends in the aggressiveness of cancer care near the end of life. J Clin Oncol. 2004;22:315–321. doi: 10.1200/JCO.2004.08.136. [DOI] [PubMed] [Google Scholar]
- 33.Earle CC, Park ER, Lai B, et al. Identifying potential indicators of the quality of end-of-life cancer care from administrative data. J Clin Oncol. 2003;21:1133–1138. doi: 10.1200/JCO.2003.03.059. [DOI] [PubMed] [Google Scholar]
- 34.Kwok AC, Semel ME, Lipsitz SR, et al. The intensity and variation of surgical care at the end of life: A retrospective cohort study. Lancet. 2011;378:1408–1413. doi: 10.1016/S0140-6736(11)61268-3. [DOI] [PubMed] [Google Scholar]
Associated Data
This section collects any data citations, data availability statements, or supplementary materials included in this article.