Abstract
Purpose
In 2009, the National Institute for Clinical Excellence (NICE) published guidance on the treatment of ocular hypertension and glaucoma. The aim of the present study was to describe the impact this guidance had on glaucoma prescribing and to describe recent prescribing trends in England.
Method
Prescribing cost analysis data held by NHS Business Authority for the years 2000–2012 was analysed.
Results
The number of prescriptions dispensed increased by 67% from 4.76 million in 2000 to 7.96 million in 2012. Over the same time period, drug costs increased by 88% from £55.2 million to £103.7 million. Prescriptions for prostaglandin analogues increased fourfold, while there was a threefold decrease in the use of beta-blockers. The most commonly prescribed glaucoma medication was latanoprost. The introduction of generic latanoprost in 2012 more than halved the cost associated with this medication. NICE guidance appeared to have had no effect on the total number of prescriptions or the classes of medications prescribed.
Conclusion
The introduction of the NICE guidelines did not change glaucoma prescribing practice, although it is not clear whether this represents non-adherence to the guidelines or whether the guidelines embodied pre-existing practice.
Introduction
Glaucoma is the second largest cause of blindness in the United Kingdom, accounting for 15% of all blind registrations in England.1 It has an estimated prevalence of 3% in those aged over 65 years.2
In the 1980s and 1990s, a number of new topical treatments to lower intraocular pressure (IOP) became available. Studies in Ireland3 and Scotland4, 5 indicated that these medicines grew in usage during the 1990s and early 2000s.
Although there have been no new drug classes introduced in the past decade, there was a major change in practice in the form of the Ocular Hypertension (OHT) and Glaucoma Treatment Guidelines (2009) published by the National Institute for Clinical Excellence (NICE).6 The introduction of the guidance has not been without controversy, with unintended changes in the case finding and referral behaviour of community optometrists.7 It is unclear whether the additional referrals resulted in any increase in glaucoma detection8 or if the guidelines had an impact on prescribing practice. We wanted to examine the effect NICE guidance had upon prescribing practice in the United Kingdom. Furthermore, we aimed to evaluate the recent prescribing habits of eye-care practitioners.
We analysed prescribing trends over the past 12 years by reviewing prescribing cost analysis (PCA) data held by NHS Business Authority. PCA data are collected when community pharmacies apply for financial reimbursement of dispensed medicines and therefore give a unique and almost complete picture of glaucoma prescribing in England.
Materials and methods
We obtained all annual PCA reports produced by the NHS business authority for the years 2000–2012 from the websites of the NHS Business Authority9 and the online national archive for the Department of Health.10 The PCA reports contain the cost and the number of items dispensed for every item listed in the British National Formulary (BNF).11 We downloaded all available annual PCA reports from the year 2000 to the most current, as of April 2013. These data included all prescriptions reimbursed by the NHS business authority from 1 January 2000 to 31 December 2012.
In each PCA report, all data relating to drugs categorized under the BNF section name, ‘treatment of glaucoma', were extracted. The data for each glaucoma preparation was grouped by medicine name and drug class. We then analysed the annual number of items dispensed and the net ingredient cost.
To describe any recent changes to prescribing costs that occurred because of the expiration of the latanoprost patent, we analysed monthly PCA reports from January 2011 to 2013 from the same sources. All latanoprost preparations were identified from these reports and the monthly cost analysed over that time period.
Systemic acetazolamide was excluded from the analysis because it is commonly prescribed for conditions other than glaucoma.
Results
The most contemporary prescribing information can be obtained from the 2012 PCA report. Latanoprost was dispensed three times more commonly than any other glaucoma medication, with over two million latanoprost prescriptions dispensed in 2012. There was significant heterogeneity in the prescribing of other drugs, with a total of 40 preparations dispensed at rates >10 000 items per year. (Table 1).
Table 1. The 40 most commonly prescribed medicines in 2012.
| BNF preparation name | Prescriptions | Cost (in £) |
|---|---|---|
| Latanoprost_Eye Dps, 50 μg/ml | 2 090 110 | 23 887 530 |
| Azopt_Eye Dps, 10 mg/ml | 754 988 | 7 287 660 |
| Lumigan_Eye Dps, 300 μg/ml | 686 946 | 10 656 610 |
| Travatan_Eye Dps, 40 μg/ml | 579 624 | 8 592 190 |
| Ganfort_Eye Dps, 0.3 mg/5mg/ml | 436 200 | 8 810 930 |
| Xalatan_Eye Dps, 50 μg/ml | 387 300 | 6 897 090 |
| Dorzolamide/Timolol_Eye Dps, 2%/0.5% | 377 876 | 2 522 870 |
| Acetazolamide_Liq Spec, 125 mg/5 ml | 250 139 | 1 097 340 |
| Timolol Mal_Eye Dps, 0.25% | 231 030 | 458 121 |
| Cosopt_Ocumeter Plus Eye Dps, 2%/0.5% | 222 989 | 3 348 690 |
| Latanoprost/Timolol_Eye Dps, 50 μg/5 mg/ml | 221 012 | 4 388 260 |
| Lumigan_Eye Dps, 100 μg/ml | 209 645 | 3 643 620 |
| Timolol Mal_Eye Dps, 0.5% | 185 063 | 370 972 |
| Dorzolamide_Eye Dps, 2% | 177 740 | 1 195 170 |
| Azarga_Eye Dps 1%/0.5% | 167 603 | 2 565 090 |
| DuoTrav_Eye Dps, 0.004%/0.5% | 160 886 | 3 216 100 |
| Xalacom_Eye Dps, 50 μg/5 mg/ml | 153 472 | 3 220 490 |
| Saflutan_Eye Dps, 15 μg/ml 0.3 ml (Ud) | 105 357 | 2 163 530 |
| Combigan_Eye Dps, 0.5%/0.2% | 89 667 | 1 393 270 |
| Alphagan_Eye Dps, 0.2% | 87 130 | 847 153 |
| Timoptol_Eye Dps, 0.5% (w/v) | 70 036 | 336 691 |
| Trusopt_Ocumeter Plus Ophth Soln, 2% | 67 688 | 662 048 |
| Cosopt_Eye Dps, 0.2 ml (Ud P/F) | 64 992 | 2 168 320 |
| Betagan_Eye Dps, 0.5% | 48 449 | 767 463 |
| Teoptic_Eye Dps, 1% | 43 779 | 537 890 |
| Acetazolamide_Tab, 250 mg | 41 492 | 542 322 |
| Piloc HCl_Eye Dps, 2% | 40 468 | 123 552 |
| Timoptol_Eye Dps, 0.25% (w/v) | 29 388 | 149 467 |
| Timoptol-LA_Ophth Gel-Forming Soln, 0.5% | 27 803 | 131 056 |
| Betaxolol_Soln Eye Dps, 0.5% | 27 499 | 83 292 |
| Timoptol_Eye Dps, 0.5% (Ud P/F) | 25 644 | 133 670 |
| Levobunolol HCl_Eye Dps, 0.5% | 24 974 | 83 666 |
| Betoptic Susp_Ophth Susp, 0.25% | 18 098 | 78 661 |
| Acetazolamide_Cap, 250 mg (M/R) | 17 862 | 552 032 |
| Teoptic_Eye Dps, 2% | 17 166 | 238 568 |
| Betoptic_Ophth Soln, 0.5% | 15 304 | 45 900 |
| Piloc HCl_Eye Dps 4% | 13 630 | 58 610 |
| Betagan_Eye Dps, 0.5% 0.4 ml (Ud P/F) | 13 464 | 240 197 |
| Trusopt_Ocumeter Plus Ophth Soln, 2% | 11 233 | 312 521 |
| Piloc HCl_Eye Dps, 1% | 10 999 | 33 462 |
| Timoptol-LA_Ophth Gel-Forming Soln, 0.25% | 10 893 | 209 280 |
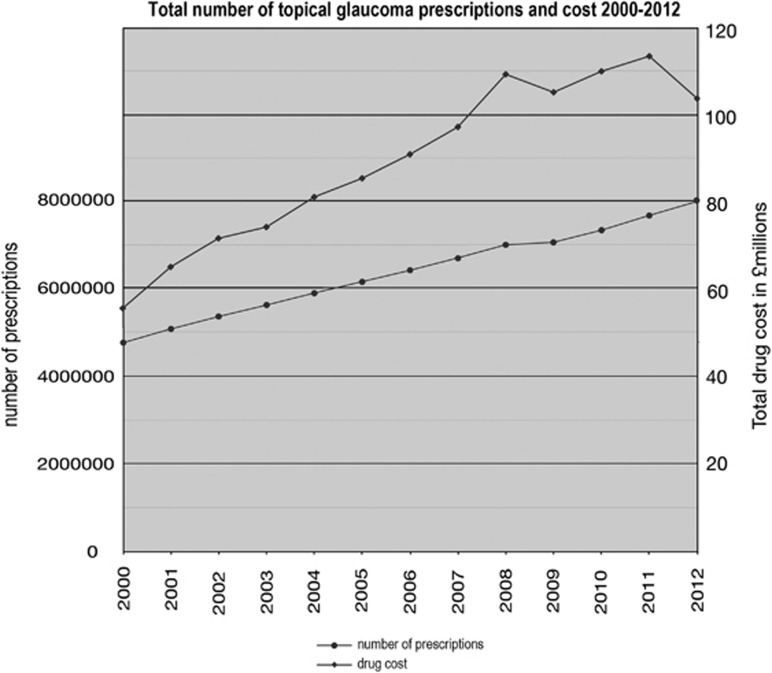
Over the 12 years studied, the number of prescriptions dispensed increased by 67% from 4.76 million in 2000 to 7.96 million in 2012 (Figure 1). Over the same time period, drug cost increased by 88% from £55.2 million to £103.7 million. Medicine cost peaked in 2011 at £113.5 million and was lower in 2012 as a result of the lower cost of latanoprost.
Figure 1.
Total number of topical glaucoma prescriptions and cost 2000–2012.
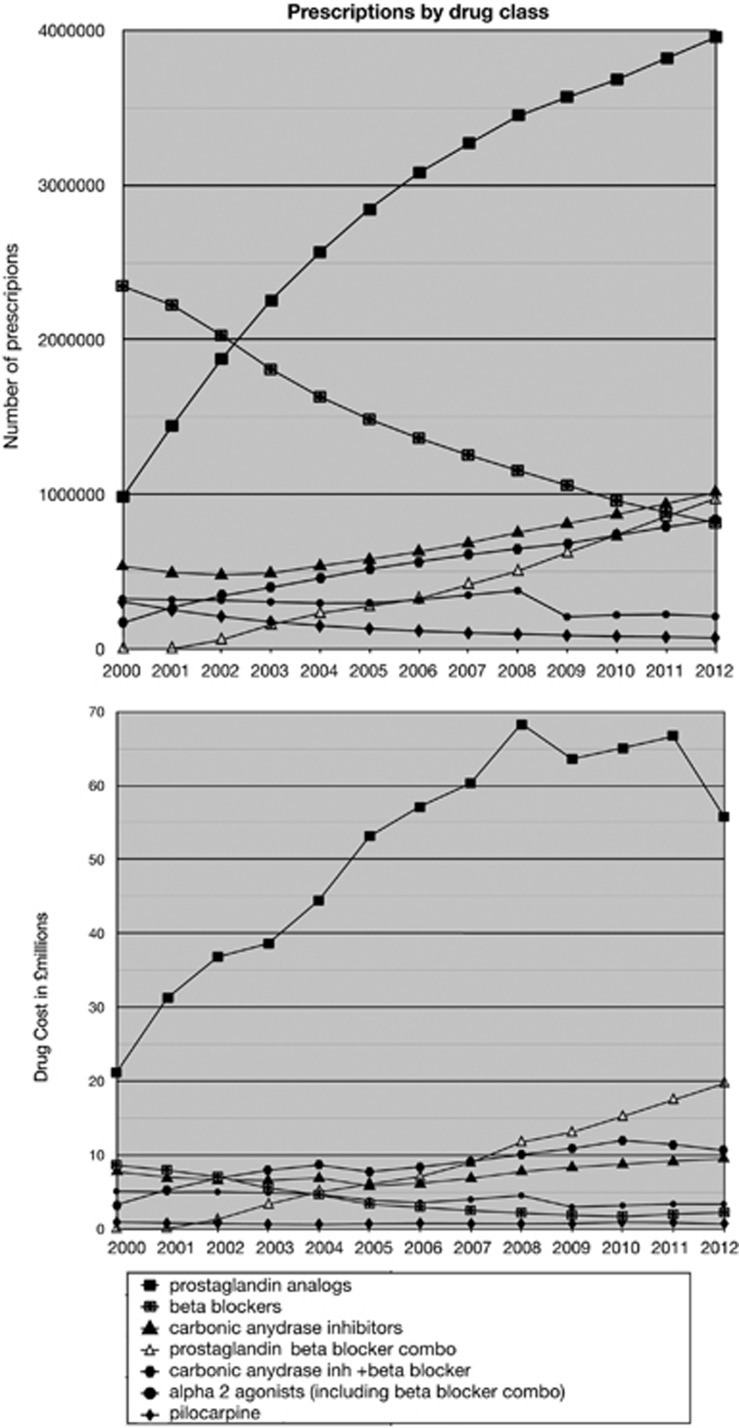
Between 2000 and 2012, there was a shift in the classes of treatments prescribed (Figure 2). The largest change was the increased use of prostaglandin analogues, prescriptions for which increased fourfold. Also observed was a threefold decrease in the use of beta-blockers. Beta-blocker/prostaglandin analogue combination medications increased, but overall the use of beta-blockers decreased over the time period.
Figure 2.
Prescriptions and cost by drug class 2000–2012.
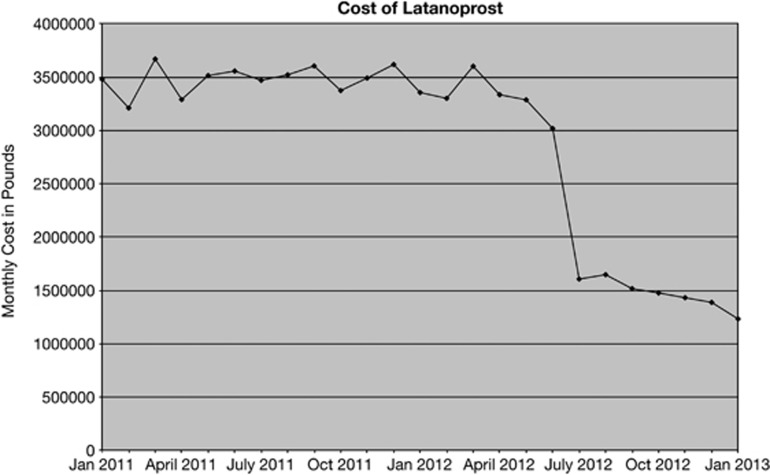
Changes in the total number of prescriptions as well as the class of medicine prescribed resulted in changing costs (Figure 2). The most striking change was the increase cost associated with increased prostaglandin use. The introduction of generic latanoprost in January 2012 was the cause of the decreased costs seen in 2012 (Figures 1 and 2). The decrease in costs associated with generic latanoprost was more evident in the analysis of the monthly PCA data (Figure 3). The introduction of generic latanoprost more than halved the cost of latanoprost.
Figure 3.
Cost of latanoprost January 2011–2013.
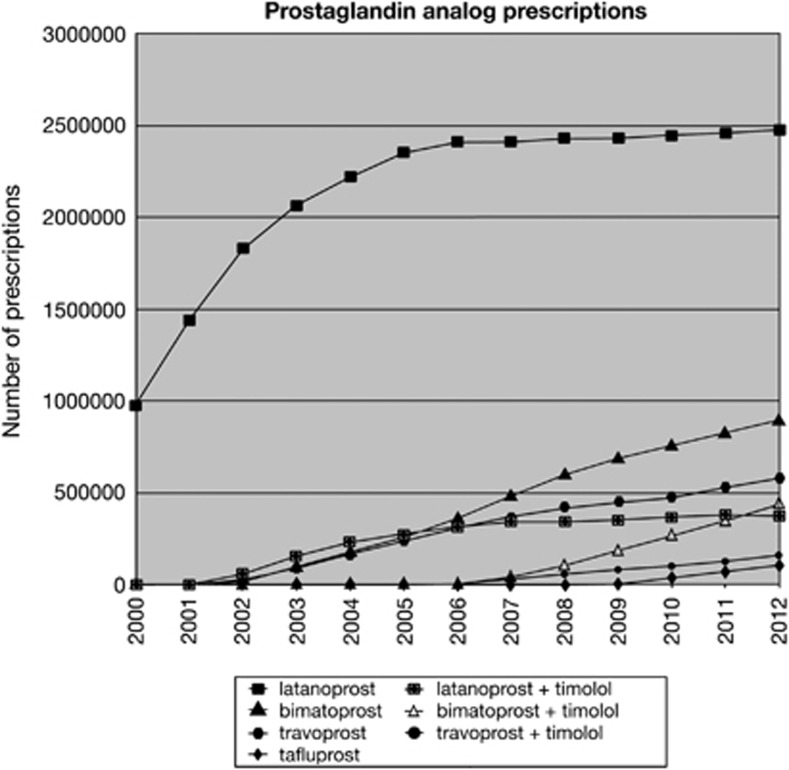
Latanoprost prescriptions increased from 2000 to 2006, but have remained relatively constant since 2006 (Figure 4). The fastest growing medicine in the prostaglandin analogue class since 2006 was bimatoprost.
Figure 4.
Prostaglandin analogue prescriptions 2000–2012.
Discussion
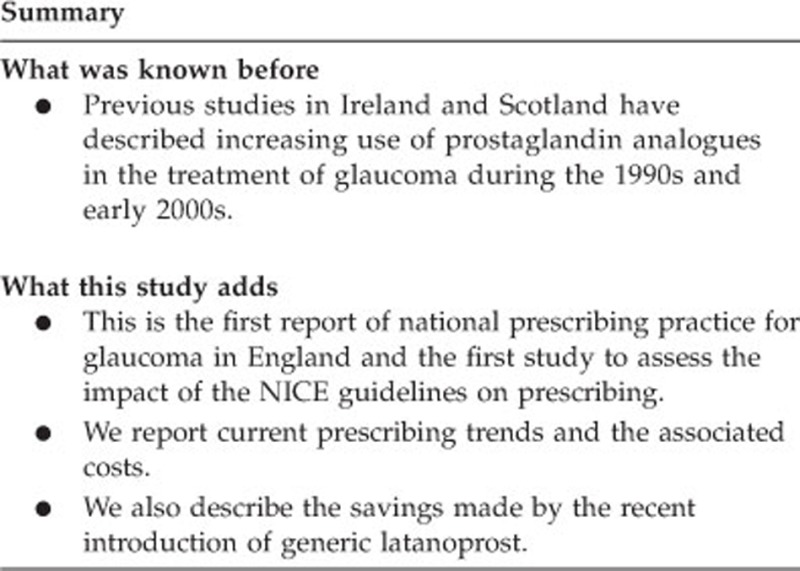
This is the first report of national prescribing practice for glaucoma in England and the first study to assess the impact of the NICE guidelines on prescribing. The prescribing data indicates gradually increasing number of prescriptions, as well as a drift away from beta-blocker medicines to prostaglandin analogues.
Impact of NICE guidance
In 2009, NICE produced guidance on the treatment of OHT and glaucoma.6 This was the first time that national guidance specified who, when, and with what patients should be treated. Surprisingly, the trend of a gradual year on year increase in prescriptions continued seemingly unaffected by NICE guidance.
Following the publication of NICE guidance, the College of Optometrists issued advice regarding referral from community optometrists to hospital eye services.12 They recommended onward referral for patients with OHT and an IOP >21 mm Hg (non-referral could be considered if age >65 years and IOP <25 mm Hg or age >80 years with IOP <26 mm Hg). The College of Optometrist guidance together with the widespread use of non-contact tonometry resulted in a marked rise in community optometrist referrals.7 The lack of any marked increase in prescribing during 2009 and 2010 suggests that the extra referrals generated as a response to the NICE guidelines were low-risk patients and did not require treatment. It should be noted that the UK national screening committee does not recommend systematic glaucoma screening13 and that it is not cost effective.14 No economic assessment has been conducted on whether or not opportunistic screening and referral using the NICE guidance derived IOP cutoffs represents good value for money.
NICE guidance recommended the use of prostaglandin analogues as the first-line medication for most patients, which was already in practice according to our data. There was one subgroup in which beta-blockers were recommended as first-line treatment (IOP 25–32 mm Hg, pachymetry 555–590, age <60 years). Interestingly, the prescribing data did not show any increase in beta-blocker prescribing following NICE guidance publication. This could imply that either beta-blockers were being used in this way before the introduction of NICE guidance, or that this aspect of the guidance was ignored. A possible explanation could be due to clinician scepticism of the cost-utility models NICE guidance is derived from. One of the values used in the cost-utility analysis was that a prescription of topical beta-blockers was assumed to cost £3.12 and a prostaglandin analogue prescription cost £11.70 (an average of latanoprost, travoprost, and bimatoprost prices found in the BNF at the time of publication). Prostaglandin analogues are more effective at lowering IOP; however, by balancing cost and benefit, beta-blockers were shown to be more cost effective for younger patients with normal corneal pachymetry and IOP 25–32 mm Hg. The poor uptake of the beta-blocker prescribing advice may relate to clinician distrust of the cost utility analysis or a disregard of drug cost altogether.
The recommendation by NICE on the use of beta-blockers may now be outdated given that assumptions made about the cost of prostaglandin analogue prescriptions have been rendered invalid by the introduction of generic latanoprost. The cost-utility model used by NICE needs to be updated in light of generic latanoprost cost. It may also be beneficial for the cost-utility model to analyse and make recommendations about specific drugs rather than classes of drugs given that there is a wide variation in cost of drugs within the same class of medication.
NICE also suggested that trabeculectomy surgery may be offered to people who present advanced disease or respond inadequately to two medications. Trabeculectomy rates peaked in the 1980s but declined in the 1990s owing to advances in topical medicines. During 2000–2010, trabeculectomy rates were stable at 10–11 per 100 000 per year.15 No data on surgery rates exist after 2010 and therefore it is difficult to comment whether NICE guidance has had any effect on surgery rates or prescribing.
Increasing prescriptions
While the NHS business authority data clearly show a gradual increase in prescription numbers, it is not possible to use these data to explain why this might have occurred. We believe that the causes could be broadly divided into three groups: increasing number of elderly patents, earlier detection of glaucoma, and/or more aggressive treatment, that is, aiming for lower IOPs than in the past.
Part of the increase in prescriptions may be explained by census population data. In England there were 7.8 million people over the age of 65 years in 2001, but this increased to 8.7 million by 2011.16, 17 If the estimated prevalence of 3% is applied to these figures, it would suggest an increase of 27 000 glaucoma cases over that period. As well as increasing the number of people in the 65 years and older categories, there are also increasing number of people in the over 80 years age groups, where the prevalence of glaucoma is even higher.
Any change in the threshold at which an ophthalmologist is likely to recommend treatment will have an effect on the number of prescriptions issued. In the past decade, a number of key studies have provided information about the importance of IOP lowering in OHT and glaucoma. In 2002, the OHT treatment study (OHTS)18 showed that treatment of OHT reduced the risk of developing glaucoma and provided detailed risk factors analysis. Also published in 2002 were the results from the Early Manifest Glaucoma Treatment trial, which showed that reduction of IOP reduced the risk of glaucoma progression.19 In 1998, the Collaborative Normal Tension Glaucoma Study showed that IOP reduction reduced the risk of progression in some patients with normal tension glaucoma.20 The Advanced Glaucoma Intervention Study, published in 2000, showed an IOP of <18 mm Hg was associated with no deterioration of visual field.21 In 2005, the Collaborative Initial Glaucoma Treatment Study showed that medication was equally effective as surgery in preventing progression of visual field defects.22 Using information from these key studies, The Royal College of Ophthalmologists and European Glaucoma Society published guidance on the principals of glaucoma management.23, 24 The gradual accumulation of evidence on the importance of IOP lowering and the dissemination of this information could partly explain the gradual increase in prescribing we observed during 2000–2012 (Figures 1 and 2).
The year-on-year increase of prescriptions remained constant over the time period we studied. Should this trend continue, we estimate that the number of prescriptions issued will exceed 10 million per year in England by 2020.
Changes in medicine class and associated costs
From 2000 to 2012, total glaucoma prescribing costs increased by 88%, outstripping the number of dispensed items, which increased by only a 68%. This can be explained by the declining use of cheaper, ‘out-of-patent' drugs and a switch to more expensive, ‘in-patent' drugs. The major trend observed is the move from beta-blocker medications to prostaglandin analogues, a change that likely represents the popularity of prostaglandin analogue as a first-line medication and as a second-line agent in anyone previously treated with beta-blockers.
The patent for the most commonly prescribed glaucoma medication, latanoprost, expired in January 2012. The expiration of latanoprost patent has more than halved monthly expenditure on latanoprost. Owing to the way in which the drug tariff is calculated and reimbursed, the cost savings associated with the introduction of generic latanoprost does not appear in the monthly PCA data until mid-2012. It is important to note that the full cost savings associated with generic latanoprost will not be seen in the annual PCA data until the 2013 report is released. The estimated saving for the year 2013 owing to the loss of the latanoprost patent is £28 million pounds (most recent 3 months PCA data prorated and compared with 2011 data).
The initial decrease in cost associated with generic introduction was due to prescriptions written using the non-proprietary name (previously dispensed as Xalatan) being dispensed generically. Prescriptions written using a proprietary name will continue to be dispensed as the branded drug. As awareness of the price differential grows among general practitioners and other prescribers, it is likely that further savings will be made as patients are switched to generic preparations.
Latanoprost remains the most commonly prescribed prostaglandin analogue, but growth in prescription numbers levelled off after 2006. The medication with most growth in the years after 2006 was bimatoprost. It is somewhat counter-intuitive that growth in latanoprost prescribing was not seen at a time when the drug patent was about to expire. This may be because of the lack of knowledge of prescription costs by clinicians or complete disregard for prescribing budgets. Pharmaceutical companies have little interest in promoting or marketing a drug that is about to come off patent, but it is beyond the scope of this article to examine how prescribing may be affected by marketing.
The future cost of glaucoma prescribing is more difficult to predict than the number of prescriptions. Total prescribing cost is based upon not only the number of prescriptions issued but also the price of the drugs used. If no new drugs become available, we would expect the total cost of drug spending to fall as existing drug patents expire. However, if the pattern of the past decade is repeated, we would see newer drugs being released and a shift of prescribing to these medications. A move to drugs that have valid patents would be associated with higher costs.
Since April 2012 there have been changes to how health care is funded. Hospital eye services are now commissioned by general practitioners through a tendering process led by clinical commissioning groups. Clinical commissioning groups, which are responsible for both prescribing budgets and commissioning secondary care, have the power to influence prescribing. Some clinical commissioning groups have started to make recommendations that the first-line treatment for glaucoma should be generic latanoprost.25 Should these arrangements be repeated nationwide, we may see a increase in latanoprost prescribing and a decline in total cost of glaucoma prescribing.
Limitations of this study
The NHS business authority PCA data captures most glaucoma prescribing because most long-term medications are dispensed from community pharmacies. There are, however, a few areas of prescribing not captured by the NHS business authority. These data do not include hospital prescriptions or private prescriptions where the patient meets the cost of the prescription. Prescribing that does occur through these routes will likely follow the same general trends as those seen in the PCA reports.
Conclusion
The past decade has seen significant growth in glaucoma prescribing and the cost of glaucoma prescribing. The increased cost observed was because of a shift away from beta-blockers to prostaglandin analogues. The introduction of generic latanoprost in 2012 resulted in a significant cost saving; however, there is the potential for further cost increases owing to the growing use of bimatoprost. If increasing costs are to be avoided, clinical commissioning groups and policy makers need to consider ways of increasing use of generics.
The introduction of the NICE guidelines in 2009 did not change glaucoma prescribing practice, although it is not clear whether this represents non-adherence to the guidelines or whether the guidelines embodied pre-existing practice.
The authors declare no conflict of interest.
References
- RNIB. Number of adults and children certified with sight impairment and severe sight impairment in England and Wales: April 2011–March 2012. Available at: http://www.rnib.org.uk/aboutus/Research/reports/o therresearch/Pages/sight_loss_statistics_report.aspx . Accessed 4 April 2013.
- Minassian DC, Reidy A, Coffey M, Minassian A. Utility of predictive equations for estimating the prevalence and incidence of primary open angle glaucoma in the UK. Br J Ophthalmol. 2000;84:1159–1161. doi: 10.1136/bjo.84.10.1159. [DOI] [PMC free article] [PubMed] [Google Scholar]
- Knox FA, Barry M, McGowan B, O'Brien C. The rising cost of glaucoma drugs in Ireland 1996–2003. Br J Ophthalmol. 2006;90:162–165. doi: 10.1136/bjo.2005.076117. [DOI] [PMC free article] [PubMed] [Google Scholar]
- Bateman DN, Clark R, Azuara-Blanco A, Bain M, Forrest J. The effect of new topical treatments on the management of glaucoma in Scotland; an examination of ophthalmological health care. Br J Ophthalmol. 2002;86:551–554. doi: 10.1136/bjo.86.5.551. [DOI] [PMC free article] [PubMed] [Google Scholar]
- Macleod SM, Clark R, Forrest J, Bain M, Bateman N, Azuara-Blanco A. A review of glaucoma treatment in Scotland 1994–2004. Eye. 2008;22:251–255. doi: 10.1038/sj.eye.6702593. [DOI] [PubMed] [Google Scholar]
- National institute for Clinical Excellence. Glaucoma; Diagnosis and management of chronic open angle glaucoma and ocular hypertension. NICE Clinical Guideline 85. Available at: http://www.nice.org.uk/cg85 . Accessed 4 April 2013.
- Sparrow J. How nice is NICE. Br J Ophthalmol. 2013;97:116–117. doi: 10.1136/bjophthalmol-2012-302634. [DOI] [PubMed] [Google Scholar]
- Shah S, Murdoch IE. NICE—impact on glaucoma case detection. Ophthalmic Physiol Opt. 2011;31 (4:339–342. doi: 10.1111/j.1475-1313.2011.00843.x. [DOI] [PubMed] [Google Scholar]
- NHSBA http://www.nhsbsa.nhs.uk/PrescriptionServices/3494.aspx . Accessed 4 April 2013.
- Department of Health http://webarchive.nationalarchives.gov.uk/2004011 7115633/http:/www.doh.gov.uk/prescriptionstatistics/index.htm . Accessed 4 April 2013.
- Joint Formulary Committee British National Formulary65th edBMJ Group and Pharmaceutical Press: London, UK; 2013 [Google Scholar]
- The College of Optometrists and The Royal College of Ophthalmologists, Guidance on the referral of Glaucoma suspects by community optometrists, 17 December 2009. Available at: www.aop.org.uk/practitioner-advice/enhanced-services/glaucoma-nice-guidelines/glaucoma-referral-guidance . Accessed 6 January 2014.
- Spry PGD, Sparrow J.An Evaluation of Open Angle Glaucoma against the NSC Criteria for Screening Viability, Effectiveness and Appropriateness. UK National screening committee. July 2006. Available at: http://www.screening.nhs.uk/glaucoma . Accessed 6 January 2014.
- Burr JM, Mowatt G, Hernandez R, Siddiqui MA, Cook J, Lourenco T, et al. The clinical effectiveness and cost-effectiveness of screening for open angle glaucoma: a systematic review and economic evaluation Health Technol Assess 200711(41)iii–iv, ix–x1–190. [DOI] [PubMed] [Google Scholar]
- Keenan TDL, Wotton CJ, Goldacre MJ. Recent trends in the rate of trabeculectomy in England. Eye (Lond) 2011;25:1243–1245. doi: 10.1038/eye.2011.138. [DOI] [PMC free article] [PubMed] [Google Scholar]
- 2011 Census: Population Estimates by five-year age bands, and Household Estimates, for Local Authorities in the United Kingdom Office for national statistics. Available at: www.ons.gov.uk/census . Accessed 4 April 2013.
- Census 2001 Key Statistics for local authorities in England and Wales Office for National Statistics. ISBN 0 11 621643 3. Available at: http://www.ons.gov.uk/ons/rel/census/census-2001-key-statistics/local-authorities-in-england-and-wales/index.html . Accessed 4 April 2013.
- Kass MA, Heuer DK, HIgginbotham EJ, Johnson CA, Keltner JL, Miller JP, et al. The Ocular Hypertension Treatment Study: a randomized trial determines that topical ocular hypotensive medication delays or prevents the onset of primary open-angle glaucoma. Arch Ophthalmol. 2002;120 (6:701–713. doi: 10.1001/archopht.120.6.701. [DOI] [PubMed] [Google Scholar]
- Heijl A, Leske MC, Bengtsson B, Hyman L, Bengtsson B, Hussein M, et al. Reduction of intraocular pressure and glaucoma progression: results from the Early Manifest Glaucoma Trial. Arch Ophthalmol. 2002;120 (10:1268–1279. doi: 10.1001/archopht.120.10.1268. [DOI] [PubMed] [Google Scholar]
- Collaborative Normal Tension Glaucoma Study Group. The effectiveness of intraocular pressure reduction in the treatment of normal tension glaucoma Am J Ophthalmol 1998126298–505. [DOI] [PubMed] [Google Scholar]
- The AGIS investigators: The advanced Glaucoma Intervention Study (AGIS) 7. The relationship between control of intraocular pressure and visual field deterioration Am J Ophthalmol 2000130429–440. [DOI] [PubMed] [Google Scholar]
- Wahl J. Results of the Collaborative Initial Glaucoma Treatment Study (CIGTS) Ophthalmologe. 2005;102 (3:222–226. doi: 10.1007/s00347-005-1173-y. [DOI] [PubMed] [Google Scholar]
- Royal College of Ophthalmologists Guidelines for the Management Of Open Angle Glaucoma And Ocular HypertensionRoyal College of Ophthalmologists: London, UK; 2004 [Google Scholar]
- European Glaucoma Society Terminology and Guidelines For Glaucoma3rd edISBN: 978-88-87434-28-6. Available at: http://www.eugs.org/eng/EGS_guidelines.asp . Accessed 14 January 2014.
- The College of Optometrists and Royal College of Ophthalmologists. Commissioning Better Eye Care: Glaucoma. March 2013. Available at: http://www.rcophth.ac.uk/page.asp?section=633§ionTitle=Current+issues+and+opportunities+%2D+Glaucoma+and+Ocular+Hypertension . Accessed 16 January 2014.


