Abstract
Light-activated inhibition of cathepsin activity was demonstrated with in a cell-based assay. Inhibitors of cathepsin K, Cbz-Leu-NHCH2CN (2) and Cbz-Leu-Ser(OBn)-CN (3), were caged within the complexes cis-[Ru(bpy)2(2)2]Cl2 (4) and cis-[Ru(bpy)2(3)2](BF4)2 (5), where bpy = 2,2′-bipyridine, as 1:1 mixtures of Δ- and Λ stereoisomers. Complexes 4 and 5 were characterized by 1H NMR, IR and UV-vis spectroscopies and electrospray mass spectrometry. Photochemical experiments confirm that 4 releases two molecules of 2 upon exposure to visible light for 15 min, whereas release of 3 by 5 requires longer irradiation times. IC50 determinations against purified cathepsin K under light and dark conditions with 4 and 5 confirm that inhibition is enhanced from 35 to 88-fold, respectively, upon irradiation with visible light. No apparent toxicity was observed for 4 in the absence or presence of irradiation in bone marrow macrophage (BMM) or PC-3 cells, as judged by the MTT assay, at concentrations up to 10 μM. Compound 5 is well tolerated at lower concentrations (<1 μM) but does show growth inhibitory effects at higher concentrations. Confocal microscopy experiments show that 4 reduces intracellular cathepsin activity in osteoclasts with light activation. These results support further development of caged nitrile-based inhibitors as chemical tools for investigating spatial aspects of proteolysis within living systems.
Keywords: cathepsin, enzymes, inhibitors, photochemistry, ruthenium
Introduction
Caging bioactive compounds with photolabile protecting groups, also known as photocaging, has revolutionized our ability to manipulate biological activity with spatiotemporal control.[1] Photocaged compounds have proven indispensible in basic research applications for studying spatial aspects of activity in biological systems. Caged bioactive molecules also have great potential to act as localized, specific therapeutics.[2] By controlling where drugs become activated with light, therapeutic effects may be achieved in desired locations such as tumors, while at the same time preventing undesired effects in surrounding tissues.
Organic and inorganic protecting groups have been used successfully as photocages. The most widely used inorganic cage for bioactive molecules has been the Ru(bpy)2 (bpy = 2,2′-bipyridine) fragment. Pioneering work demonstrated that Ru(bpy)2-caged neurotransmitters could be used to achieve high spatial and temporal control over receptor activity in live neuronal cells, with later data showing efficacy in animals.[3] Importantly, no toxic effects were observed from the caged neurotransmitters, or their Ru-based byproducts. Related work from our laboratories proved that spatial control can be achieved with light over cysteine protease activity.[4] This method is based on neutralizing nitrile-based “warheads” of inhibitors through direct binding to the metal-containing fragment Ru(bpy)2. Fast release and activation of cysteine protease inhibitors is accomplished upon irradiation with visible light.[5]
We were motivated to develop protease inhibitors with spatial control because localized aberrant proteolysis is a hallmark of many human disease states, including cancer.[6] Recent evidence has shown that the cysteine protease cathepsin K is a critical player in metastatic bone disease.[7] In general, osteoclasts, bone marrow macrophages and stromal cells in the bone tumor microenvironment[8] express high levels of cysteine proteases, specifically cathepsins K, B, and S. These enzymes are critically involved in osteoclastic bone resorption[7, 8b, 9] and macrophage invasion and tumor growth.[10] Cathepsin K is abundantly expressed in osteoclasts and macrophages and its levels are higher in bone metastases than in the corresponding primary tumors and soft tissues from the same patient,[11] suggesting that targeting cathepsin K activity within bone tumors could be a promising strategy. In support of these findings, growth and progression of PC3 prostate carcinoma cells intratibially implanted into cathepsin K knockout mice were shown to be significantly reduced as compared to tumors implanted into wild type mice, a result indicative of the critical involvement of this potent collagenase in tumor progression in bone.[12] Unfortunately, small molecule inhibitors, often delivered orally, in general lack the ability to achieve location-specific inhibition, which can lead to poor therapeutic efficacy, the need for dose escalation and failures in clinical trials due to side effects.[6b, 13]
Towards the goal of localized protease inhibition, we describe herein the exciting observation that proteolysis can be inhibited in living cells using our photoactivation strategy. A new photoactivated cathepsin K inhibitor is reported that blocks proteolysis in osteclasts, which are a major source of aberrant cathepsin activity with the tumor microenvironment of prostate cancer metastases.[8b] In addition we provide convincing evidence that our caged inhibitors are non-toxic, which supports their further development as chemical tools for investigating the role of a wide range of proteases within living systems, including animal models of human diseases states.
Experimental Section
General Considerations
All reagents were purchased from commercial suppliers and used as received. Compounds 2[14] and 3[15] were prepared by literature procedures from enantioenriched (> 98 %ee) Cbz-Leu-OH and Boc-Ser(OBn)-OH, respectively. NMR spectra were recorded on a Varian FT-NMR Mercury-400 Spectrometer. Mass spectra were recorded on a Waters ZQ2000 single quadrupole mass spectrometer using an electrospray ionization source. IR spectra were recorded on a Perkin Elmer Spectrum 2000 FT-IR Spectrometer. Enzymatic assays were conducted on a Tecan Infinite M200 or Tecan SPECTRAFluor Plus microplate reader. UV-vis spectra were recorded on a Varian Cary 50 spectrophotometer. The photolysis experiments were conducted using a 250 W Tungsten Halogen lamp (Osram Xenophot HLX) powered by a 24 V power source. The irradiation wavelength was selected by placing either a 395 nm long-pass filter (for white light experiments) or a 400 nm bandpass filter with a 345 nm long-pass filter (for quantum yield measurements) between the lamp and the sample, along with a 10 cm water cell to absorb infrared light. All reactions were performed under ambient atmosphere unless otherwise noted. Anaerobic reactions were performed by purging the reaction solutions with Ar or N2.
Synthesis of the diastereomeric mixture cis-[Ru(bpy)2(2)2]Cl2 (4)
In the glove box, a sealable tube was charged with cis-[Ru(bpy)2Cl2] (48 mg, 0.10 mmol), AgBF4 (78 mg, 0.40 mmol), compound 2 (91 mg, 0.60 mmol) and 20 mL of freshly distilled EtOH. The resulting solution was wrapped in aluminum foil and heated to 80°C for 5 h during which it turned from dark violet to bright orange. After cooling the crude solution to RT, it was placed in the freezer at −20°C for 16 h. The precipitated silver salts were filtered off using celite and the filter cake was washed with cold EtOH. The solvents were removed under reduced pressure and the crude mixture was analyzed by 1H NMR spectroscopy. The resulting yellow solid was dissolved in acetone (2 mL) and layered with Et2O (10 mL) and placed in the freezer at −20°C for 16 h. The reaction mixture was filtered and the filter cake washed with cold Et2O. The resulting solid was dissolved in EtOAc (15 mL) and extracted 3 times with H2O (15 mL). The organic layer was then precipitated (oily residue) with sat. n-Bu4NCl in EtOAc (0.1 mL) at −20°C. The oily residue was isolated by centrifugation, the mixture was decanted and the residue was washed with cold EtOAc (3 × 5 mL), and then cold toluene (3 × 5 mL). The residue was dissolved in a minimum amount of acetone and layered with Et2O. The resulting solid was washed with Et2O. Layering and washing were repeated four times to give the title compound as an orange solid in analytically pure form as a hydrate salt (21.0 mg, 19%). 1H NMR (400 MHz CD2Cl2 δ) 9.93 (s, br, 2H), 9.54 (d, J = 4.9 Hz, 1H), 9.51 (d, J = 4.9 Hz, 1H), 8.53 (d, J = 8.1 Hz, 1H), 8.45 (d, J = 8.1 Hz, 2H), 8.36 (d, J = 8.1 Hz, 1H), 8.15 (m, 2H), 8.02 (m, 2H), 7.93 (m, 2H), 7.54 (d, J = 5.9 Hz, 2H), 7.32 (m, 8H), 7.25 (m, 2H), 6.86 (d, J = 9.7 Hz, 1H, NH), 6.74 (d, J = 8.1 Hz, 1H, NH), 5.04 (m, 3H), 4.16 (d, J = 12.2, 1H), 4.28 (m, 6H), 1.08 (under the H2O peak, m, 4H), 0.91 (m, 12H); IR (KBr) νmax (cm−1): 3419, 3029, 2957, 2870, 2347, 2274, 1714, 1676, 1604, 1523, 1466, 1446, 1424, 1386, 1337, 1246, 1170, 1122, 1047, 917, 771, 731, 698, 670; LRMS (ESMS) calculated for C52H58N10O6Ru [M+Cl]+: 1055, found: 1055; Anal. Calcd for C52H65Cl2N10O9.5Ru (4·3.5H2O): C, 54.12; H, 5.68; N, 12.14. Found: C, 54.16; H, 5.46; N, 12.13.
Synthesis of the diastereomeric mixture cis-[Ru(bpy)2(3)2](BF4)2 (5)
In the glove box, a sealable tube was charged with cis-[Ru(bpy)2Cl2] (60 mg, 0.12 mmol), compound 3 (315 mg, 0.740 mmol), AgBF4 (97 mg, 0.50 mmol) and dry EtOH (28 mL) under inert atmosphere in a glove box. The resulting solution was wrapped in aluminum foil and heated to 80°C for 6 h during which it turned from dark violet to bright orange. After cooling the crude solution to RT, it was placed in the freezer at −20°C for 16 h. The precipitated silver salts were filtered off using celite and the filter cake was washed with cold EtOH. The solvents were removed under reduced pressure and the crude mixture was analyzed by 1H NMR spectroscopy. The reaction mixture was concentrated and the orange solid was stirred with Et2O (3 × 20 mL) to remove excess 3. The orange solid was purified using silica gel (acetone). Fractions were concentrated and the yellow solid was stirred with Et2O (2 × 20 mL), filtered and dried under reduced pressure to get the caged complex as pale orange solid in analytically pure form (64 mg, 51%): mp = 206°C (decomp); 1H NMR (400 MHz C3D6O) δ 9.53 (d, 1H, J = 5.2 Hz), δ 9.49 (d, 1H, J = 5.2 Hz), δ 8.78 – 8.75 (m, 2H), δ 8.65 (t, 2H, J = 8.8 Hz), δ 8.36 (t, 2H, J = 7.6 Hz), δ 8.23 (t, 1H, J = 7.2 Hz, NH), δ 8.13 – 8.08 (m, 2H), δ 7.86 (t, 2H, J = 6 Hz), δ 7.81 (t, 1H, J = 6.4 Hz, NH), δ 7.46 – 7.22 (m, 14H, J = 5.2 Hz), δ 6.72 (d, 1H, J = 7.6 Hz, NH), δ 6.67 (d, 1H, J = 7.6 Hz), δ 9.53 (d, 1H, J = 5.2 Hz), δ 5.24 – 5.00 (m, 6H), δ 4.53 – 4.44 (m, 4H), δ 4.28 – 4.16 (m, 2H), δ 3.87 – 3.74 (m, 4H), δ 1.75 – 1.45 (m, 8H), δ 0.97 – 0.85 (m, 12H); IR (KBr) νmax (cm−1) 3360, 3117, 3087, 3064, 3034, 2957, 2871, 2269, 1719, 1687, 1605, 1524, 1468, 1449, 1389, 1366, 1316, 1246, 1057, 769, 743, 732, 698; ESMS calcd for C68H74 F4N10O8BRu (M+1) 1348, found 1348; UV-vis λmax = 284 nm (ε = 50600 M−1cm−1) and 418 nm (ε = 9810 M−1cm−1); Anal. Calcd for C68H74F8N10O12B2Ru (5·4 H2O): C, 54.23; H, 5.49; N, 9.30. Found: C, 54.39; H, 5.22; N, 9.20.
Stability of 4 and 5 in Buffer
Solutions of 4 or 5 in 0.1M pH 6.5 phosphate buffer (1.0% DMSO) were monitored by UV-Vis spectroscopy (300–800 nm) for 24 h. Ln A at specific λmax values were plotted vs. time and lines were fit to give a first order reaction rate constants kobs = 1.0 × 10⁻⁶ s−1, corresponding to a half-life > 8.0 days (t1/2 = −0.693/kobs) for 4 and kobs = 5.0 × 10⁻⁹ s−1 (t1/2 > 1800 days) for 5.
Photochemical Quantum Yields
Photosubstitution quantum yields were determined using ferrioxalate actinometry as previously described in detail.[16] A 150 W Xe lamp housed in a Milliarc compact arc lamp housing (PTI) and powered by a PTI model LPS-220 power supply was used in the steady-state photolysis experiments; the wavelength of the light reaching the sample was controlled with colored glass long-pass and band-pass filters (Newport). Representative data for determination of the quantum yield for 5 are given in Supporting Information (Figure S9).
Cathepsin K inhibition studies
Cathepsin enzyme activity was determined from kinetic measurements performed by fluorimetric detection of the hydrolysis product AMC at 37°C every 2 min for 14 min (8 measurements). The excitation and emission wavelengths were 360 and 485 nm respectively. The selective fluorescent substrate Z-Gly-Pro-Arg-AMC was used at a final concentration of 100 μM (obtained from Bachem, Torrance, CA). Enzyme activities are expressed as a percentage, with 100% equal to activity in the absence of inhibitor.
Recombinant cathepsin K (human) was obtained from Enzo Life Sciences (Farmingdale, NY). An 880 nM stock solution was prepared in 50 mM sodium acetate, pH 5.5, 50 mM NaCl, 0.5 mM EDTA and 5 mM DTT and kept at −80 °C. For each experiment the stock solution was diluted 110 times and activated for 15 min at 37°C with a 400 mM sodium acetate, pH 5.5, 4 mM EDTA, 8 mM DTT assay buffer solution. The inhibitor was prepared as a 1% DMSO solution in the buffer solution (400 mM sodium acetate, pH 5.5, 4 mM EDTA, 0.01 % Triton X -100) and plated (Corning® 96 Well Flat Clear Bottom Black Polystyrene TC-Treated Microplates, 50 μL/well). Three experiments in triplicates (2-5, light or dark) were carried out on 96 well plates, with “dark” and “light” experiments on separate plates. The plate containing “dark” was carefully wrapped in aluminum foil and the other plate was exposed to visible light for the same time period. The photolysis was conducted for 15 min (2 and 4) or 40 min (3 and 5) (with gentle shaking of the plate every 2–3 min) using a 250W tungsten halogen lamp (Osram Xenophot HLX) powered by a 24V power supply. The irradiation wavelength was selected by placing a 395 long-pass filter between the lamp and the sample, along with a 10 cm water cell to absorb infrared light. After photolysis, the reaction was initiated by addition of 50 μL of 200 μM Z-Gly-Pro-Arg-AMC solution in the assay buffer (final volume 100 μL, final enzyme concentration 2 nM). Cathepsin enzyme activity was determined from kinetic measurements performed by fluorimetric detection of the hydrolysis product AMC at 37°C every 2 min for 14 min (8 measurements) and MAX RFU slope values used for plotting. IC50 values were determined by plotting % activity vs. log concentration of inhibitor. Data were fit in the program Igor Pro using the Sigmoid fit function.
Cell Viability Determinations
The cell viability of bone marrow macrophages (BMMs) and PC3 prostate carcinoma cells in the presence of 4, 5 and the control compound cis-[Ru(bpy)2(MeCN)2](PF6)2[5b] were measured using the MTT assay according to the manufacturer’s instructions (Invitrogen, Grand Island, NY). Briefly, BMMs were derived from FVBN mice as previously described and cultured on sterile petri dishes in MEMα media (Sigma) containing 20% fetal bovine serum (FBS) and 30% L929-conditioned media[12] as the source of macrophage colony stimulating factor (M-CSF) for 96 h. For MTT measurements, differentiated BMMs were seeded in a 96 well plate at the density of 1 × 10⁴ cells per well in MEMα media (containing 10% FBS and 30% L929). PC3 cells were seeded at the density of 5 × 10³ cells/well in DMEM media containing 10% FBS. After 48 h of culture, both cell types were treated with 50 μL solutions of 4, 5 or cis-[Ru(bpy)2(MeCN)2](PF6)2 in the appropriate culture media and incubated for 30 min at 37°C. For each cell type, all control and inhibitor treatments were performed in the same plate. Separate plates were used for “dark” and “light” conditions. The “dark” plate was wrapped in aluminum foil while the “light” plate was exposed to visible light. The photolysis of 4 and 5 was conducted for 15 min and 40 min respectively (with gentle shaking of the plate every 2–3 min) using a 250W tungsten halogen lamp (Osram Xenophot HLX) powered by a 24V power supply, with bandpass and water filters, as described previously. Following the photolysis cells were incubated for 24 h in the dark under a 5% CO2 atmosphere and 37°C. After the incubation time, the media was removed and 100 μL of new media was added. 10 μL of a 12 mM MTT stock solution (5 mg of MTT dissolved in 1.0 mL of sterile PBS) was then added to each well. The cells were covered and incubated for 4 h. A negative control consisting of 10 μL of stock MTT solution added to 100 μL media in empty wells was also prepared. 85 μL was then removed from each well and was replaced by 50 μL of DMSO, and thoroughly mixed. Absorbance measurements at 540 nM were collected on a microplate reader for 6 biological replicates. Cell viabilities were expressed as a percentage, with 100% equal to activity in the absence of 4, 5 and the control compound cis-[Ru(bpy)2(MeCN)2](PF6)2. The known, cytotoxic agent Docetaxel was used as a positive control (Figure S10).
Inhibition of Cathepsin Activity in Cells
The live cell cathepsin K activity staining assays were performed following a method described previously.[17] Differentiated BMMs, were washed with PBS (phosphate buffered saline), and gently scraped using osteoclast media (MEMα media containing 10% FBS, 10 ng/mL M-CSF (R&D Systems), and 10 ng/mL RANKL (R&D Systems)). Roughly 5×10⁵ cells were plated per well into 24-well plates (Corning Costar) on acid-washed glass coverslips (Electron Microscope Sciences) re-treated after 48 h, and cultured for additional 48 h until visible osteoclasts are formed. For cathepsin inhibition assays, cells were incubated for 30 min at 37°C with 200 μL of reaction buffer (0.2 M sodium acetate, pH 6.0, 0.1 mM EDTA and 0.125 mM BME) containing 2, 4, or cis-[Ru(bpy)2(MeCN)2](PF6)2 control complex (1–1000 nM, +/− 1μM CA074-Me, a cathepsin B inhibitor) in 2% DMSO (vehicle). Cells were then treated with 100 μL of substrate solution in reaction buffer (0.2 M sodium acetate, pH 6.0, 0.1 mM EDTA, 5% DMSO) containing either 1.0 mM Z-Gly-Pro-Arg-4MβNA or 0.25 mM Z-Leu-Arg-4MβNA (cathepsin K substrates), and 100 μL of the precipitating agent, 1.0 mM nitrosalicylaldehyde, in reaction buffer. The reaction was allowed to occur for 30 min at 37°C in the dark. Controls were incubated in the same manner but without substrate (with or without 1.0 μM CA074-Me). For assays involving photolysis of 4 or cis-[Ru(bpy)2(MeCN)2](PF6)2 control complex, prior to substrate addition, plates were wrapped in aluminum foil (“dark”) or exposed to visible light (“light) for 15 min (with gentle shaking of the plate every 2–3 min). Photolysis was conducted with a 250W tungsten halogen lamp (Osram Xenophot HLX) powered by a 24V power supply, using bandpass and water filters, as described previously.[4] Following reaction with substrate and precipitating agent, cells were washed with PBS, fixed with 1% formaldehyde for 20 min minutes at RT, washed again, and air-dried. Coverslips were mounted on microscope slides and viewed with a confocal laser-scanning microscope (Zeiss LSM 780) using a 40x oil immersion lens. Each image captured featured a mature osteoclast (minimum of 6 images/treatment). Intensity of green fluorescence per osteoclast area (indicative of the amount of hydrolyzed substrate) was analyzed using ImageJ software (NIH).
Results
Synthesis and Characterization
In order to translate our light-activated method to living cells, we sought more potent nitrile-based inhibitors for cathepsin K than compound 1, which was caged in our initial study (Figure 1).[4] Literature data confirmed that subtle modifications of the dipeptidyl inhibitor structure of 1 can lead to significant enhancements for inhibition of cathepsin K.[14] Compounds 2[14] and 3[15] were chosen for caging, with IC50 values against purified cathepsin K of 35 and 9 nM respectively, roughly three orders of magnitude lower than that of 1 (IC50 = 7.5 μM).[14] Compound 2 was attractive because it was shown to inhibit cathepsin K activity in live cell assays[18] and is also cell permeable.[19] Compound 3 was chosen because of its better drug-like properties, showing longer plasma stability and roughly 10 times longer half-life in vivo than 2.[15] Compound 3, derived from serine, also contains a substituent alpha to the nitrile, which could be used to determine the scope of our caging method.
Figure 1.
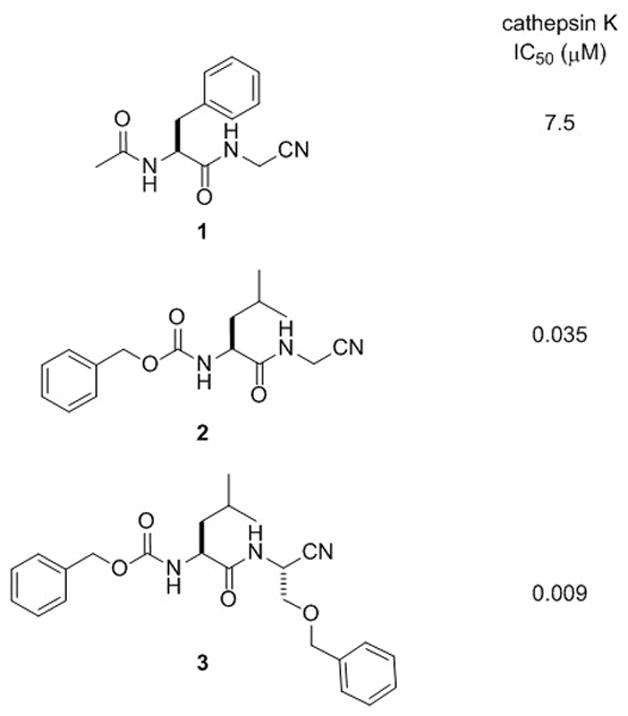
Nitrile-based cathepsin K inhibitors from the literature with reported IC50 values
Synthesis of the caged inhibitors cis-[Ru(bpy)2(2)2]Cl2 (4) and cis-[Ru(bpy)2(3)2](BF4)2 (5) proceeded smoothly (Scheme 1). Treating cis-[Ru(bpy)2Cl2] with 2 (6.0 equiv) and AgBF4 (4.0 equiv) in EtOH at 80 °C for 5 h resulted in a color change from violet to orange. After cooling the reaction mixture to −20 °C, filtering and concentrating, analysis of the crude mixture by 1H NMR spectroscopy confirmed that 2 was bound to ruthenium with high conversion, as there were no ruthenium byproducts evident. In order to remove excess 2 and purify the complex 4, the crude solid was dissolved in EtOAc and treated with n-Bu4NCl. Upon cooling to −20 °C, an orange oily residue formed that was washed with EtOAc and toluene. Subsequent precipitation from acetone and Et2O for multiple cycles, followed by drying in vacuo, supplied the caged inhibitor 4 in analytically pure form. A similar method was used to prepare 5, however purification of the tetrafluroborate salt was carried out by silica gel chromatography, giving a direct route to the pure caged complex 5 without the need for anion metathesis.
Scheme 1.
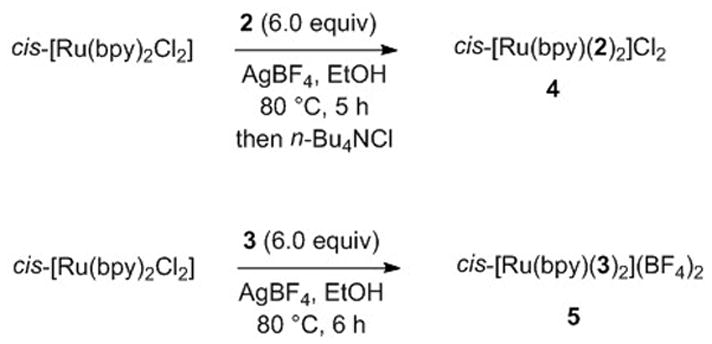
Synthesis of caged inhibitors 4 and 5
Complexes 4 and 5 were characterized by 1H NMR, IR and UV-vis spectroscopies, mass spectrometry and elemental analysis. As expected, 4 and 5 were isolated as 1:1 mixtures of Λ and Δ isomers, because cis-[Ru(bpy)2Cl2], 2 and 3 are chiral. Shifts between 9.93 and 0.91 ppm were observed in the 1H NMR spectrum of 4, with splitting of select resonances due to the presence of diastereoisomeric complexes. Resonances indicative of diasteromeric complexes include amide protons at 6.86 and 6.74 ppm for 4 and 6.73 and 6.68 ppm for 5 (Figures S2, S6). The IR spectra of 4 and 5 show νCN stretches at 2274 cm−1 and 2270 cm−1 respectively, which is shifted by ~20 cm−1 relative to their parent inhibitors 2 (νCN = 2258 cm−1) and 3 (νCN = 2257 cm−1). These data are consistent with data for other nitriles bound to the ruthenium center of Ru(bpy)2 (Figure S3, S7).[20] The electrospray ionization mass spectra of 4 and 5 in H2O shows prominent peaks at m/z = 1055 and 1348 respectively, along with a suitable isotope patterns, consistent with monocations of the formula [Ru(bpy)2(2)2](Cl)+ and [Ru(bpy)2(3)2](BF4)+ (Figure S5, S8). The electronic absorption spectrum of 4 in water containing 1% DMSO (Figure 2, reactant trace) exhibits maxima at 281 nm (ε = 55,600 M−1 cm−1) associated with the ligand-centered bpy 1ππ* transitions and at 412 nm (ε = 9,600 M−1 cm−1) nm assigned as arising from Ru→bpy metal-to-ligand charge transfer (1MLCT) transitions. Likewise, 5 exhibits two maxima at 284 nm (ε = 50,600 M−1 cm−1) and at 418 nm (ε = 9,810 M−1 cm−1). These peak positions are in good agreement with those of related nitrile-bound ruthenium complexes, including cis-[Ru(bpy)2(1)2](PF6)2,[4] cis-[Ru(bpy)2(MeCN)2](PF6)2,[5b] and cis-[Ru(bpy)2(5-cyanouracil)2]Cl2.[5a] Irradiation into the 1MLCT band in these complexes results in ligand exchange in coordinating solvents.[5a]
Figure 2.
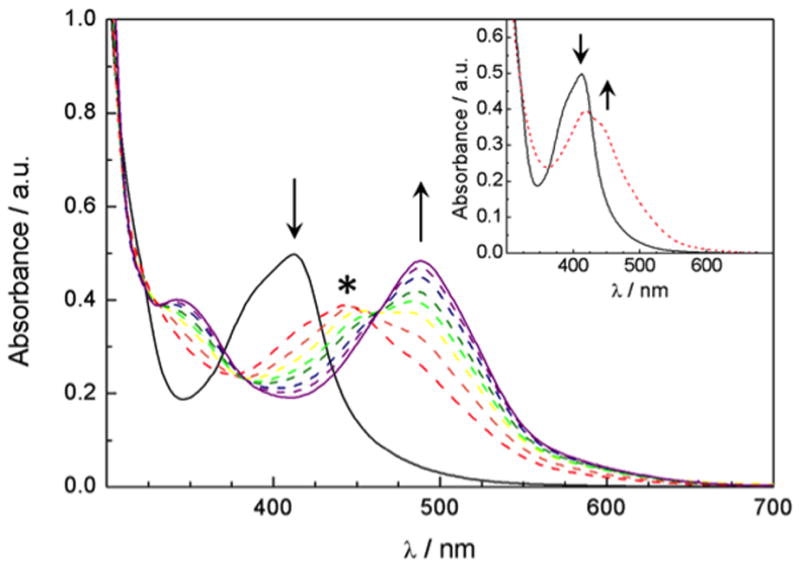
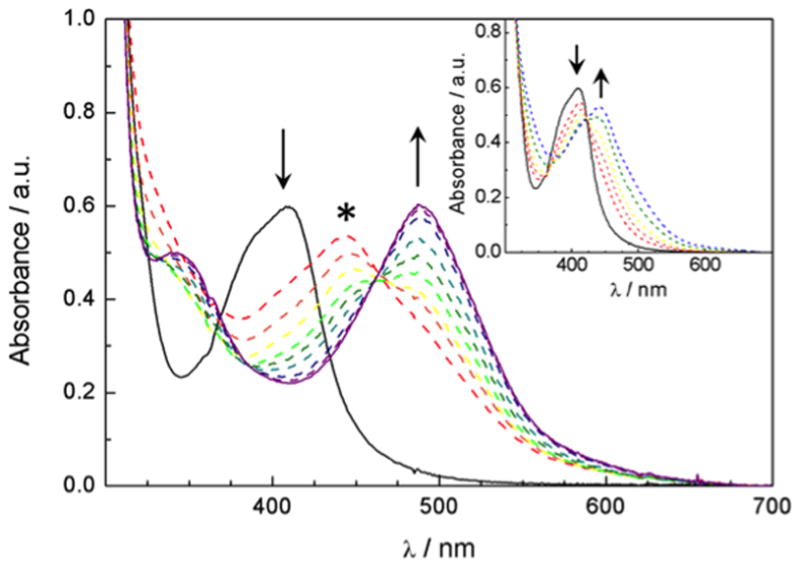
Changes to the electronic absorption of A) 52 μM of 4 in a 1% DMSO aqueous solution at irradiation times of 0, 2, 3, 4, 5, 6, 7, 8, 10, and 15 min (λirr ≥ 395 nm); inset: 0, and 1 min; and B) 51 μM of 5 in a 2 % acetone aqueous solution at irradiation times of 0, 10, 13, 16, 20, 25, 30, 40, 50 and 60 min (λirr ≥ 395 nm); inset: 0, 1, 2, 3, 5, and 7 min. * denotes the absorption maximum of the intermediate.
Complex 4 shows properties ideal for acting as a biological tool, including high stability in buffer in the dark and efficient release of inhibitor 2 upon irradiation with visible light. The half-life for 4 in the dark was determined spectrophotometrically in phosphate (PBS) buffer (pH 6.5) to be ~ 8.0 days at 293 ± 2K, as determined using the rate constant for decomposition of 4 obtained from the slope of a lnA vs t graph (kobs = 1.0 × 10⁻⁶ s−1). Similar stability in the dark was recorded in pure water and in solutions containing 1% DMSO, which resemble the conditions used in the biological assays. Complex 5 proved to be even more stable, giving kobs = 5.0 × 10⁻⁹ s−1 in PBS buffer, corresponding to a half-life of over 1800 days. Photolysis of 4 in water (1% DMSO) results in the sequential exchange of the two monodentate ligands for solvent molecules, generating cis-[Ru(bpy)2(H2O)2]2+. The changes in the electronic absorption spectrum of 4 (52 μM) as a function of irradiation time (λirr ≥ 395 nm) show the decrease of the reactant peak at 412 nm and the formation of an intermediate species in tirr = 0 – 3 min with maximum at ~450 nm (Figure 2A, inset). During this time, two isosbestic points at 322 and 364 nm are apparent, as well as a pseudo-isosbestic point at 427 nm. The intermediate at tirr = 2–3 min has been shown to correspond to the product formed after the exchange of one CH3CN ligand for a H2O molecule in the CH3CN complex, cis-[Ru(bpy)2(2)(H2O)]2+, which is similar to the related intermediate cis-[Ru(bpy)2(CH3CN)(H2O)]2+, and is denoted by * in Figure 2.[4, 5b] Further irradiation of 4 from 3 min to 15 min leads to the formation of the final product, cis-[Ru(bpy)2(H2O)2]2+, with the known absorption maxima at 340 nm and 486.[21] Three isosbestic points at 332, 384, and 463 nm are evident in Figure 2 during the second step of the photolysis (tirr = 3 – 15 min).
Although complex 5 shows excellent stability in a range of solvents in the dark, photochemical release of the nitrile-based inhibitor is much less efficient than with 4. Photolysis of 5 in water (2 % acetone) results in a similar sequential exchange of the two nitrile-based ligands, 3, with H2O although the reaction requires significantly longer irradiation times than that of 4. A decrease in the absorption peak at 412 nm and an increase in the band at 440 nm corresponding to formation of the intermediate cis-[Ru(bpy)2(3)(H2O)]2+ occurs with irradiation (λirr ≥ 395 nm) up to 10 min. The isosbestic point at 424 nm is quite similar to that observed for the first ligand dissociation in 4. The second dissociation of 3 to generate cis-[Ru(bpy)2(H2O)2]2+ occurs much on longer irradiation times, between 13 and 60 min. During this time range, the absorption maximum of the intermediate decreases in intensity and a new peak at 486 nm appears corresponding to cis-[Ru(bpy)2(H2O)2]2+ with an isosbestic point at 462 nm.
The quantum yield for the conversion of the reactant (R) 3 to the intermediate (I) cis-[Ru(bpy)2(2)(H2O)]2+ (ΦR→I) and to the product (P) cis-[Ru(bpy)2(H2O)2]2+ (ΦR→P) were determined, as previously described for cis-[Ru(bpy)2(1)2](PF6)2,[4] to be 0.050(6) and 0.0067(4), respectively (λirr = 400 nm). The corresponding ΦR→I and ΦR→P values for the photoaquation of 5 were measured as 0.021(2) and 0.0045(6), respectively.
Light-Activated Inhibition of Cathepsin K
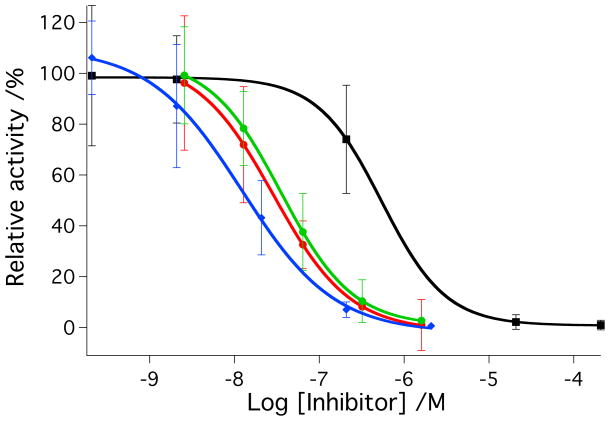
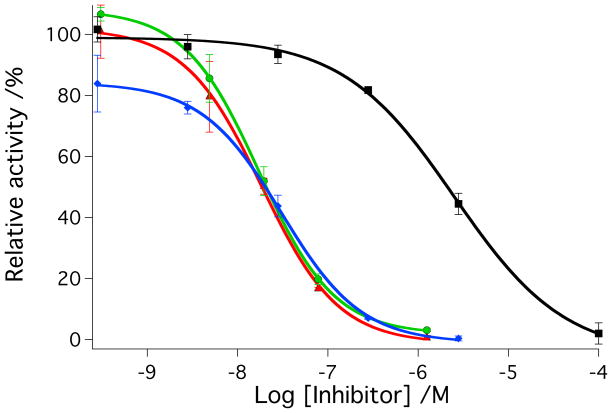
IC50 values were determined for parent inhibitors 2-3 and caged complexes 4-5 against purified human cathepsin K under light and dark conditions (Figure 3). Solutions of cathepsin K (2 nM) in assay buffer solutions (400 mM sodium acetate, pH 6.0, 4 mM EDTA, 8 mM DTT, 0.01% Triton X-100) were treated with varying amounts of 2-5. Solutions were left in the dark or irradiated with a tungsten halogen lamp (250 W, λirr > 395 nm, H2O filter). Irradiation times were shorter for 2 and 4 (tirr = 15 min) than 3 and 5 (tirr = 40 min) based on timescales of photochemical experiments described above. Enzyme activities were determined following addition of the fluorogenic substrate Z-Gly-Pro-Arg-AMC. Data indicate that 2 and 3 block enzyme activity in the low nanomolar range under these conditions, giving IC50 values of 36 nM and 28 nM, respectively. Data were identical within error under light vs. dark conditions for both of the parent inhibitors. In contrast, significant enhancements in cathepsin K inhibition were observed with 4 and 5 upon irradiation. IC50 values for 4 under light vs. dark conditions were 16 nM and 560 nM respectively corresponding to a dark to light IC50 ratio of 35:1. Likewise, IC50 values for 5 under light vs. dark conditions were 25 nM and 2.2 μM, respectively, corresponding to a dark to light IC50 ratio of 88:1. As expected, under light conditions 4 is more potent than the parent inhibitor 2, because it carries 2 equiv of inhibitor molecule per ruthenium complex, and both are released upon irradiation. Enzyme inhibition data for 5 are consistent with results from the photochemical experiments, where release of the second inhibitor molecule 3 from 5 is slow, giving the same potency for 3 as for 5 under light conditions. Nonetheless, both compounds 4 and 5 show a considerable improvement over light-activated inhibition by our previous compound cis-[Ru(bpy)2(1)2](PF6)2, whose IC50 value was only 5.4 μM under light conditions.[4]
Figure 3.
A) IC50 curves for inhibitor 2 (red, dark; green, light) and cis-[Ru(bpy)2(2)2]Cl2 (4) (black, dark; blue, light) with cathepsin K. B) IC50 curves for inhibitor 3 (red, dark; green, light) and cis-[Ru(bpy)2(3)2](BF4)2 (5) (black, dark; blue, light) with cathepsin K. Enzyme activity was determined with the fluorogenic substrate Z-Gly-Pro-Arg-AMC and is expressed as a percentage, with 100% equal to the cathepsin K activity in the absence of inhibitor. Data points represent the average of triplicate wells, and error bars are standard deviations of the mean. Data are representative of three independent experiments. Conditions: 400 mM sodium acetate, pH 6.0, 4 mM EDTA, 8 mM DTT, 1% DMSO, [cathepsin K] = 2 nM, [Z-Gly-Pro-Arg-AMC] = 100 μM, 0.01% Triton X-100, 15 min irradiation for 2 and 4, 45 min irradiation for 3 and 5 with a tungsten halogen lamp (>395 nm and H2O filter, 250 W). See Experimental Section for more details.
Determination of Toxicity
In order to gain insight into the biological behavior of the caged inhibitor 4 and 5, effects of the complexes and their photochemical byproducts on cell viability in murine BMM and human PC-3 cells were determined under light and dark conditions. The osteoclast cells could not be utilized for determination of viability because of their terminal nature. BMM or PC-3 cells were treated with either 4, 5 or cis-[Ru(bpy)2(MeCN)2](PF6)2 as a control (1 nM–100 μM), incubated for 30 min, left in the dark or irradiated with a tungsten halogen lamp for 15 min for complexes 4 and cis-[Ru(bpy)2(MeCN)2](PF6)2] or 40 min for complex 5. After 24 h viabilities were determined using the MTT assay (Figure 4). Compounds 4 and cis-[Ru(bpy)2(MeCN)2](PF6)2, which both release cis-[Ru(bpy)2(H2O)2]2+ upon irradiation, showed no effects on viability within error up to 10 μM. At 100 μM 4 showed a slight reduction of viability in PC-3 cells. Compound 5 showed no effects at lower concentrations, but did start to affect cell viability at concentrations of 10 μM and higher. Given the facts that 4 showed a lower IC50 under light conditions than 5, required a shorter irradiation time and demonstrated minimal effects on cell viability, compound 4 was chosen as the lead compound to evaluate in cell-based assays for light-activated inhibition of cathepsin activity.
Figure 4.
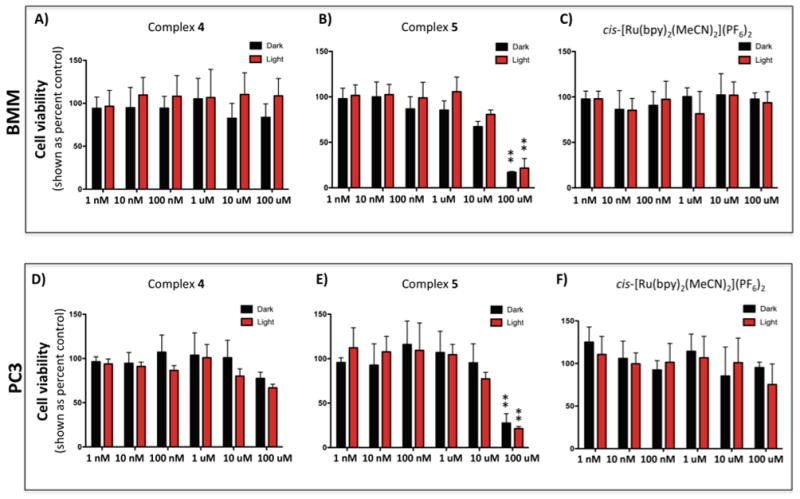
Cytotoxicity of cis-[Ru(bpy)2(2)2]Cl2 (4), cis-[Ru(bpy)2(3)2](BF4)2 (5) and the control compound cis-[Ru(bpy)2(MeCN)2](PF6)2 on BMM cells (A–C) and prostate cancer PC3 cells (D–F). Cells were incubated in the presence of 4, 5 or cis-[Ru(bpy)2(MeCN)2](PF6)2 (1 nM-100 μM) for 30 min, left in the dark (black) or irradiated (red) for 15 min (complex 4, and cis-[Ru(bpy)2(MeCN)2](PF6)2) or 40 min (complex 5) with a tungsten halogen lamp (250 W, λirr > 395 nm, H2O filter) and washed. For comparison, PC3 cells were exposed to increasing concentrations (10 nM – 200 nM) of know cytotoxic agent, Docetaxel (Figure S10). Cell viability was determined using the MTT assay after 24 h, and is reported relative to control with only buffer added. Error bars represent the standard deviations of triplicate wells, and data are representative of three independent experiments. ** indicates p<0.001.
Light-Activated Inhibition of Cathepsin Activity in Cells
To extend our method to a live cell system, inhibition of cathepsin K was examined in murine BMM and BMM-derived osteoclast cells. Both cell types are a significant source of cathepsins K and B, but as demonstrated by western blot analyses, levels of cathepsin K are significantly higher in osteoclasts than in BMM cells (Figure 5). Accordingly, although cathepsin K inhibition is achievable in BMM cells, the enzyme activity is near baseline and difficult to distinguish from noise in the presence of cathepsin B inhibitor CA074Me (data not shown).
Figure 5.
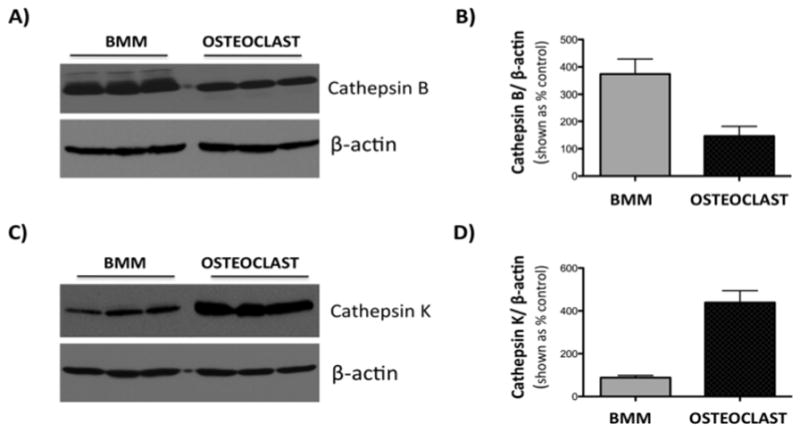
Expression of cathepsins B and K in BMM and BMM-derived osteoclast cells. Western blot analysis of expression of cathepsin B (A, top panel) and cathepsin K (C, top panel). Equal loading is shown by β-actin expression (A,C, bottom panels). Densitometric analysis of cathepsin B (B) and cathepsin K (D) bands was performed using Fuji Multimodal Imager and normalized to density of β-actin bands. Results are shown as a % density of actin bands +/− SD. Cathepsin K expression is several-fold higher in osteoclasts than in BMM cells.
Based on cathepsin K expression pattern, osteoclasts were chosen as the cell line to examine the light-activated inhibition of cathepsin activity in live cells in all subsequent experiments. First, the parent inhibitor 2 was interrogated for its ability to block proteolysis of two fluorescent cathepsin K substrates, Z-Gly-Pro-Arg-4-methoxy-β-naphthylamide (Z-GPR-4MβNA)[17] and Z-Leu-Arg-4-methoxy-β-naphthylamide (Z-LR-4MβNA).[22] In both cases hydrolysis of the substrate generates 4-methoxy-β-naphthylamine, which forms a precipitate with nitrosalicylaldehyde that can be detected and quantified by fluorescence measurements. Following a method from the literature, [15] cells were preincubated with inhibitor 2 (10 nM to 1000 nM), in the presence of the epoxide-based inhibitor CA074Me (1 μM) to knockdown cathepsin B activity, which is known to compete with cathepsin K for cleavage of these substrates.[23] Enzyme activity was visualized by confocal microscopy and intensities of green fluorescence were integrated and averaged over 3 data sets in order to make a quantitative assessment of cathepsin inhibition. Results showed that hydrolysis of Z-LR-4MβNA was reduced up to 50% with 2 (10–1000 nM) in a dose dependent fashion (Figure 6). However, higher concentrations showed no further reduction in substrate hydrolysis, suggesting another protease, not inhibited by 2, might be cleaving the same substrate (vide infra). Although hydrolysis of Z-GPR-4MβNA was also inhibited by 2, results were less pronounced and consistent between independent experiments. Therefore, the substrate Z-LR-4MβNA was used in following rounds of experiments.
Figure 6.
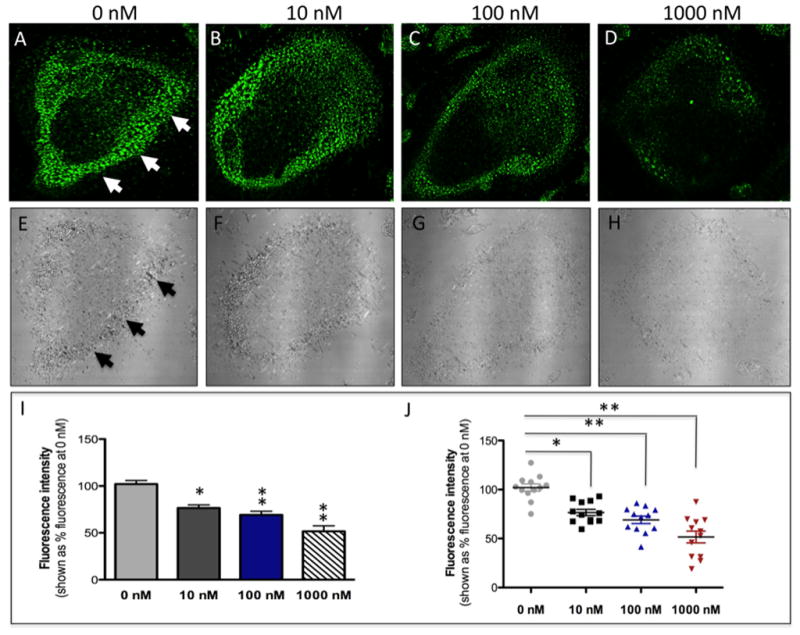
Confocal microscopy images of mouse osteoclast cells treated with the nitrile-based inhibitor 2. Cells were preincubated with 2 (10–1000 nM) for 30 min at 37 °C in the presence of cathepsin B inhibitor CA074Me (1 μM). Cells were treated with of 0.25 mM cathepsin K substrate Z-LR-4MβNA and 1.0 mM nitrosalicylaldehyde (precipitating agent), leading to the release of 4MβNA (green fluorescent precipitate indicative of cathepsin activity, arrows). Cells were fixed and imaged with a confocal laser scanning microscope (Zeiss LSM 780) using a 40x oil immersion lens. For each of the conditions at least 6 images of individual osteoclast cells were acquired and fluorescence intensity per osteoclast area was measured and quantified using ImageJ software (NIH). The intensity of green fluorescence is a direct measure of the quantity of hydrolyzed and precipitated substrate (A–D) also visible on DIC images (E–H). The quantified data are shown as column (I) and dot (J) plots. * indicates p<0.05 and ** indicates p<0.001. Results are representative of at least 3 experiments.
Having established that parent inhibitor 2 was able to block hydrolysis of the substrate Z-LR-4MβNA, experiments with caged inhibitor 4 were carried out in the absence and presence of light (see Figure 7 for details). Osteoclasts were treated with two concentrations of 4 over the same concentration range where 2 was active. Vehicle (1% DMSO) and cis-[Ru(bpy)2(MeCN)2](PF6)2 were used as controls. Results show that 4 is able to produce the same response as 2 in the presence of light, but does not show inhibition in the dark, consistent with data against purified cathepsin K (Figure 7). Importantly, 4 was able to produce a strong, light-activated response at 1000 nM, but also showed a 25% reduction in activity at 100 nM. No differences of inhibition were observed with 4 if cells were washed between preincubation and irradiation, consistent with 4 being either cell permeable or cell associated (data not shown). Vehicle and cis-[Ru(bpy)2(MeCN)2](PF6)2 showed no difference in inhibition between light and dark experiments. A slight reduction in Z-LR-4MβNA hydrolysis was noted with cis-[Ru(bpy)2(MeCN)2](PF6)2 at high concentrations (1000 nM). However, these data were well outside the range of error for inhibition by 4 using light conditions, consistent with release of 2 from the caged inhibitor 4 being responsible for the observed inhibition.
Figure 7.
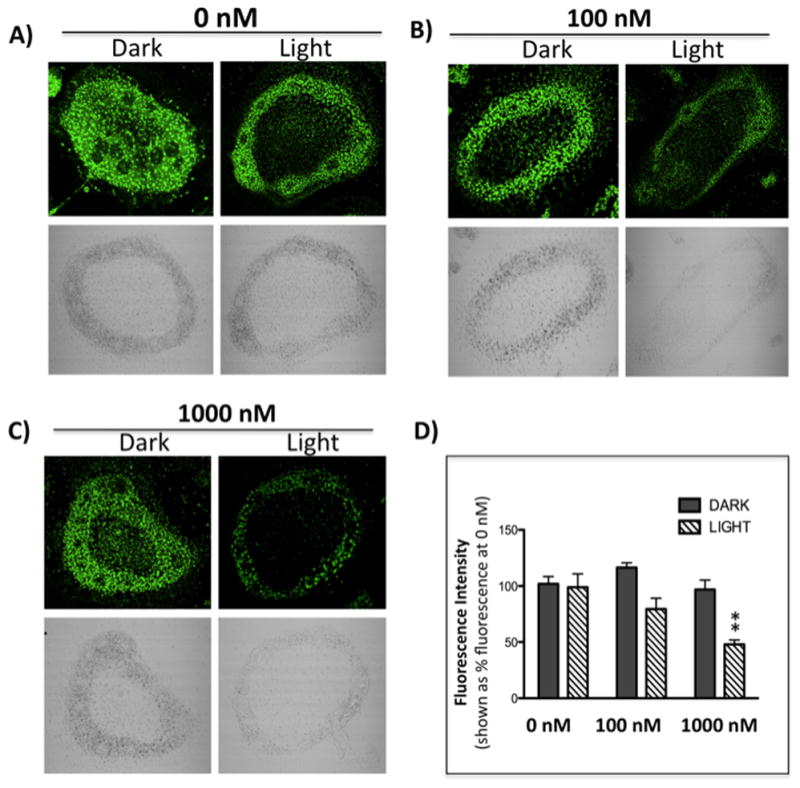
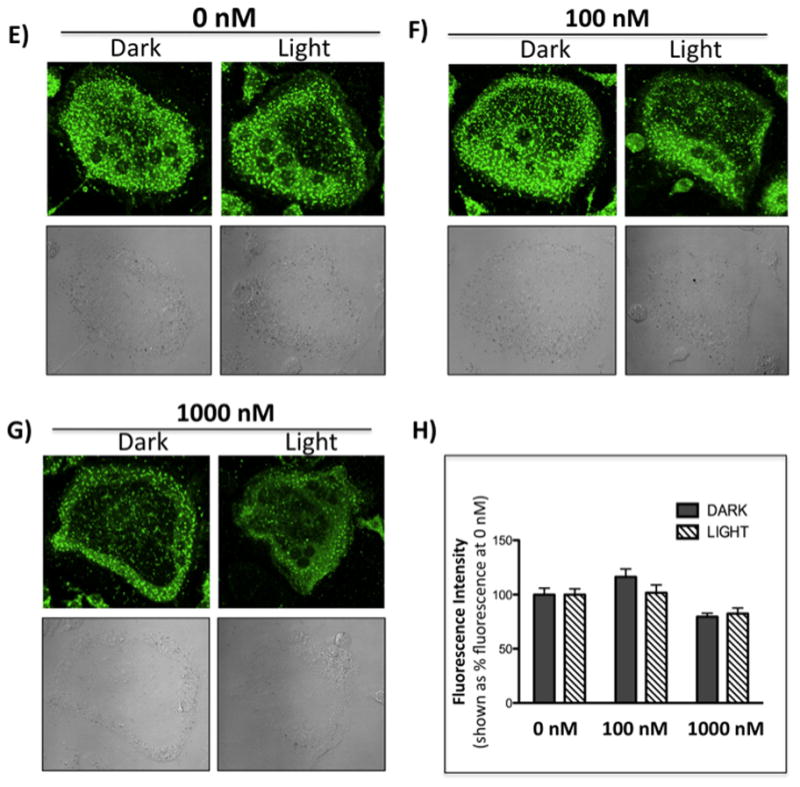
Confocal microscopy images of mouse osteoclast cells treated with the ruthenium-caged inhibitor 4(A–D) or cis-[Ru(bpy)2(MeCN)2](PF6)2 (E–H). Cells were preincubated with either complex (0–1000 nM) for 30 min at 37 °C in the presence of cathepsin B inhibitor CA074Me (1 μM), then exposed to dark (no irradiation) or light (irradiation; 250W, 395–750 nm) conditions for 15 min. Cells were treated with of 0.25 mM cathepsin K substrate Z-LR-4MβNA and 1.0 mM nitrosalicylaldehyde (precipitating agent), leading to the release of 4MβNA (green fluorescent precipitate indicative of cathepsin activity). Cells were fixed and imaged with a confocal laser-scanning microscope (Zeiss LSM 780) using a 40x oil immersion lens. For each of the conditions at least 6 images of individual osteoclast cells were acquired and fluorescence intensity per osteoclast area was measured and quantified using ImageJ (NIH) software as described for Figure 6 above. ** indicates p<0.001. Results are representative of at least 3 experiments.
Discussion
In this manuscript, compound 4, a light-activated enzyme inhibitor, was able to control cathepsin activity in a cell-based assay. This approach was validated against cathepsin K in osteoclast cells, one of the key sources of this proteolytic enzyme in the bone tumor microenvironment.[12] Given the wealth of potent and selective nitrile-based inhibitors developed for a range of cathepsin and caspase targets,[14–15, 24] our method has great potential to control spatial aspects of many biological processes in cells, including apoptosis, inflammation and cell signaling.
Compounds 4 and 5 showed a notable difference in photochemical behavior. The quantum yields for 4 are significantly lower than those reported for the photoaquation of the related complex [Ru(bpy)2(CH3CN)2]2+,[5b] but are similar to those measured for cis-[Ru(bpy)2(1)2](PF6)2.[4] The quantum yields for 5 are significantly lower than both of these complexes. Because these steady-state measurements determine the overall yield of the reaction, it is possible that the initial dissociation of the ligand is relatively efficient, but that it quickly recombines with the metal before a water molecule is able to access the open coordination site. The steric bulk of the peptide-containing ligands may prevent water from quickly reaching the metal. Alternatively, the peptides may not be as water soluble as acetonitrile, such that solvation of the uncaged product may have a detrimental effect on the overall separation of the photoproducts and therefore decrease the overall reactivity. The significant decrease in efficiency for the photorelease of 3 from 5 may be due to the larger size and lower polarity of 3 compared to 1 and 2. These points are currently under investigation.
One strength of this study is the lack of observed toxicity for 4. Neither 4, nor the control compound cis-[Ru(bpy)2(MeCN)2](PF6)2 caused growth inhibitory effects in BMM or PC-3 cells under our experimental conditions, as judged by the MTT assay, with the exception of PC-3 cells at high concentration (100 μM). Compound 5, however, did cause growth inhibitory effects at concentrations above 1 μM, confirming that the biological behavior of these ruthenium-caged compounds is not just dependent on the nature of the caging group, but on the overall structure of the complex. The caging fragment Ru(bpy)2 has been used successfully without causing deleterious side effects, as mentioned previously by others.[3g, 3i, 25] It is important to note that effective concentrations for light-activated inhibitors are dictated by the concentration of the target enzyme, as well as inhibitor potency, selectivity and cell permeability. Thus, toxicity may be avoided, because protease inhibitors are often effective in culture at low concentrations, typically below 5 μM,[8b, 18, 26] where 4 caused no growth inhibitory effects. Taken together, 4 must be categorized as a caged nitrile-based inhibitor that, at the concentrations required for inhibition, employs a non-toxic metal center, rather than a bioactive ruthenium complex.
Our data confirm that the caged inhibitor complex 4 was able to produce the same results as the parent inhibitor 2 under light conditions, whereas in the dark 4 caused no inhibition. Thus spatial control over inhibition in a cell-based assay was realized, which was the goal of this study. Despite this achievement, neither compound 2 nor 4 were able to fully suppress hydrolysis of the substrate Z-LR-4MβNA in osteoclast cells, where a maximum inhibition of 50% was achieved. Given the nanomolar potencies measured against cathepsin K in purified enzyme assays, these data suggest that cathepsin K was fully inhibited and that another enzyme, not inhibited by 2, was responsible for the remainder of Z-LR-4MβNA hydrolysis. Indeed, there are limitations with fluorescent substrates in detecting specific cathepsin activities.[26] In addition to cathepsin K,[22] Z-LR-4MβNA is a substrate for other cathepsins, namely S and V. Although greater levels of inhibition were observed with Z-GPR-4MβNA, a substrate described to be selective for cathepsin K,[18] data were not as consistent between independent experiments. Another factor to consider it that nitrile-based inhibitors are less potent and selective against mouse cathepsins than human cathepsins, which provides an extra level of complexity in correlating pharmacological data from animal cells with human enzymes.[27] Unfortunately, human osteoclasts were not available for this study.
Confocal microscopy experiments indicated that intracellular inhibition was achieved with 4. Previous studies have established that inhibitor 2 is highly cell permeable.[19] Washing cells after preincubation had no effect on the level of inhibition observed with 4, suggesting 4 is either cell permeable or membrane associated. Due to the fact that 4 is not luminescent,[28] we are not currently able to differentiate between membrane-associated 4 releasing 2 upon irradiation vs. 4 permeating the cell membrane and releasing inhibitor upon irradiation. Further studies will be needed to determine the exact mode of inhibitor uptake.
Conclusions
In conclusion, we demonstrate for the first time that intracellular light-activated enzyme inhibition is possible using the ruthenium caging approach. New photoactivated inhibitors of cathepsin K were reported that release inhibitors with potencies in the nanomolar range. Importantly, our studies confirm that the ruthenium caging approach can be carried out with no apparent toxicity. These data strongly support the translation of this technology to other enzyme targets and live cell systems. In addition to approaching other enzyme targets, future efforts will be directed towards tuning the ruthenium-based caging group. Shifting the wavelength of inhibitor release into the photodynamic therapy (PDT) window would facilitate tissue penetration by light, and extend the scope of our method into live animal studies.
Supplementary Material
Acknowledgments
We gratefully acknowledge the National Institutes of Health (EB 016072) and Wayne State University for their generous support of this research. C.T. thanks the National Science Foundation (CHE 0911354) for partial funding of this work.
Footnotes
Supporting Information Available
1H NMR, IR and MS spectral data for 4 and 5, quantum yield determination data for 5, positive control for cell viability determinations
References
- 1.a) Klan P, Solomek T, Bochet CG, Blanc A, Givens R, Rubina M, Popik V, Kostikov A, Wirz J. Chem Rev. 2013;113(1):119–191. doi: 10.1021/cr300177k. [DOI] [PMC free article] [PubMed] [Google Scholar]; b) Brieke C, Rohrbach F, Gottschalk A, Mayer G, Heckel A. Angew Chem. 2012;124:8572–8604. doi: 10.1002/anie.201202134. [DOI] [PubMed] [Google Scholar]; Angew Chem, Int Ed. 2012;51(34):8446–8476. doi: 10.1002/anie.201202134. [DOI] [PubMed] [Google Scholar]; c) Deiters A. Chem Bio Chem. 2010;11(1):47–53. doi: 10.1002/cbic.200900529. [DOI] [PMC free article] [PubMed] [Google Scholar]; d) Lee HM, Larson DR, Lawrence DS. ACS Chem Biol. 2009;4(6):409–427. doi: 10.1021/cb900036s. [DOI] [PMC free article] [PubMed] [Google Scholar]
- 2.Sgambellone MA, David A, Garner RN, Dunbar KR, Turro C. J Am Chem Soc. 2013;135(30):11274–11282. doi: 10.1021/ja4045604. [DOI] [PubMed] [Google Scholar]
- 3.a) Araya R, Andino-Pavlovsky V, Yuste R, Etchenique R. ACS Chem Neurosci. 2013 doi: 10.1021/cn4000692. Ahead of Print. [DOI] [PMC free article] [PubMed] [Google Scholar]; b) Filevich O, Etchenique R. Ruthenium: Properties, Production and Applications. 2011:269–291. [Google Scholar]; c) Salierno M, Marceca E, Peterka DS, Yuste R, Etchenique R. J Inorg Biochem. 2010;104(4):418–422. doi: 10.1016/j.jinorgbio.2009.12.004. [DOI] [PMC free article] [PubMed] [Google Scholar]; d) Filevich O, Salierno M, Etchenique R. J Inorg Biochem. 2010;104(12):1248–1251. doi: 10.1016/j.jinorgbio.2010.08.003. [DOI] [PubMed] [Google Scholar]; e) Fino E, Araya R, Peterka DS, Salierno M, Etchenique R, Yuste R. Front Neural Circuits. 2009 May;3:1–9. doi: 10.3389/neuro.04.002.2009. [DOI] [PMC free article] [PubMed] [Google Scholar]; f) Salierno M, Fameli C, Etchenique R. Eur J Inorg Chem. 2008;(7):1125–1128. [Google Scholar]; g) Zayat L, Noval MG, Campi J, Calero CI, Calvo DJ, Etchenique R. Chem Bio Chem. 2007;8(17):2035–2038. doi: 10.1002/cbic.200700354. [DOI] [PubMed] [Google Scholar]; h) Zayat L, Baraldo L, Etchenique R. Imaging in Neuroscience and Development. 2005:391–394. [Google Scholar]; i) Zayat L, Calero C, Albores P, Baraldo L, Etchenique R. J Am Chem Soc. 2003;125(4):882–883. doi: 10.1021/ja0278943. [DOI] [PubMed] [Google Scholar]
- 4.Respondek T, Garner RN, Herroon MK, Podgorski I, Turro C, Kodanko JJ. J Am Chem Soc. 2011;133(43):17164–17167. doi: 10.1021/ja208084s. [DOI] [PMC free article] [PubMed] [Google Scholar]
- 5.a) Garner RN, Gallucci JC, Dunbar KR, Turro C. Inorg Chem. 2011;50(19):9213–9215. doi: 10.1021/ic201615u. [DOI] [PMC free article] [PubMed] [Google Scholar]; b) Liu Y, Turner DB, Singh TN, Angeles-Boza AM, Chouai A, Dunbar KR, Turro C. J Am Chem Soc. 2009;131(1):26–27. doi: 10.1021/ja806860w. [DOI] [PubMed] [Google Scholar]
- 6.a) Palermo C, Joyce JA. Trends in Pharmacol Sci. 2008;29(1):22–28. doi: 10.1016/j.tips.2007.10.011. [DOI] [PubMed] [Google Scholar]; b) Blum G, von Degenfeld G, Merchant MJ, Blau HM, Bogyo M. Nat Chem Biol. 2007;3(10):668–677. doi: 10.1038/nchembio.2007.26. [DOI] [PubMed] [Google Scholar]; Mohamed MM, Sloane BF. Nat Rev Cancer. 2006;6(10):764–775. doi: 10.1038/nrc1949. [DOI] [PubMed] [Google Scholar]
- 7.Podgorski I. Future Medicinal Chemistry. 2009;1(1):21–34. doi: 10.4155/fmc.09.4. [DOI] [PMC free article] [PubMed] [Google Scholar]
- 8.a) Lynch CC. Bone. 2011;48(1):44–53. doi: 10.1016/j.bone.2010.06.007. [DOI] [PubMed] [Google Scholar]; b) Podgorski I, Linebaugh BE, Koblinski JE, Rudy DL, Herroon MK, Olive MB, Sloane BF. Am J Pathol. 2009;175(3):1255–1269. doi: 10.2353/ajpath.2009.080906. [DOI] [PMC free article] [PubMed] [Google Scholar]; c) Wilson TJ, Singh RK. Biochim Biophys Acta. 2008;1785(2):85–95. doi: 10.1016/j.bbcan.2007.11.001. [DOI] [PMC free article] [PubMed] [Google Scholar]
- 9.Bromme D, Lecaille F. Expert Opin Invest Drugs. 2009;18(5):585–600. doi: 10.1517/13543780902832661. [DOI] [PMC free article] [PubMed] [Google Scholar]
- 10.a) Pollard JW. Nat Rev Immunol. 2009;9(4):259–270. doi: 10.1038/nri2528. [DOI] [PMC free article] [PubMed] [Google Scholar]; b) Gocheva V, Joyce JA. Cell Cycle. 2007;6(1):60–64. doi: 10.4161/cc.6.1.3669. [DOI] [PubMed] [Google Scholar]; c) Pollard JW. Nat Rev Cancer. 2004;4(1):71–78. doi: 10.1038/nrc1256. [DOI] [PubMed] [Google Scholar]
- 11.Brubaker KD, Brown LG, Vessella RL, Corey E. BMC Cancer. 2006;6:15. doi: 10.1186/1471-2407-6-15. [DOI] [PMC free article] [PubMed] [Google Scholar]
- 12.Herroon MK, Rajagurubandara E, Rudy DL, Chalasani A, Hardaway AL, Podgorski I. Oncogene. 2013;32(12):1580–1593. doi: 10.1038/onc.2012.166. [DOI] [PMC free article] [PubMed] [Google Scholar]
- 13.Turk B. Nat Rev Drug Discov. 2006;5(9):785–799. doi: 10.1038/nrd2092. [DOI] [PubMed] [Google Scholar]
- 14.Loeser R, Schilling K, Dimmig E, Guetschow M. J Med Chem. 2005;48(24):7688–7707. doi: 10.1021/jm050686b. [DOI] [PubMed] [Google Scholar]
- 15.Altmann E, Aichholz R, Betschart C, Buhl T, Green J, Lattmann R, Missbach M. Bioorg Med Chem Lett. 2006;16(9):2549–2554. doi: 10.1016/j.bmcl.2006.01.104. [DOI] [PubMed] [Google Scholar]
- 16.Montalti M, Credi A, Prodi L, Gandolfi MT. Handbook of Photochemistry. CRC Press; Boca Raton, FL: 2006. [Google Scholar]
- 17.Tepel C, Bromme D, Herzog V, Brix K. J Cell Sci. 2000;113(24):4487–4498. doi: 10.1242/jcs.113.24.4487. [DOI] [PubMed] [Google Scholar]
- 18.Ruettger A, Mollenhauer J, Loeser R, Guetschow M, Wiederanders B. Bio Techniques. 2006;41(4):469–473. doi: 10.2144/000112259. [DOI] [PubMed] [Google Scholar]
- 19.Rafi SB, Hearn BR, Vedantham P, Jacobson MP, Renslo AR. J Med Chem. 2012;55(7):3163–3169. doi: 10.1021/jm201634q. [DOI] [PMC free article] [PubMed] [Google Scholar]
- 20.Cruz AJ, Kirgan R, Siam K, Heiland P, Rillema DP. Inorg Chim Acta. 2010;363(11):2496–2505. [Google Scholar]
- 21.Durham B, Wilson SR, Hodgson DJ, Meyer TJ. J Am Chem Soc. 1980;102(2):600–607. [Google Scholar]
- 22.Kamiya T, Kobayashi Y, Kanaoka K, Nakashima T, Kato Y, Mizuno A, Sakai H. J Biochem. 1998;123(4):752–759. doi: 10.1093/oxfordjournals.jbchem.a022001. [DOI] [PubMed] [Google Scholar]
- 23.a) Gocheva V, Zeng W, Ke D, Klimstra D, Reinheckel T, Peters C, Hanahan D, Joyce JA. Genes Dev. 2006;20(5):543–556. doi: 10.1101/gad.1407406. [DOI] [PMC free article] [PubMed] [Google Scholar]; b) Xia L, Kilb J, Wex H, Li Z, Lipyansky A, Breuil V, Stein L, Palmer JT, Dempster DW, Bromme D. Biol Chem. 1999;380(6):679–687. doi: 10.1515/BC.1999.084. [DOI] [PubMed] [Google Scholar]
- 24.a) Frizler M, Stirnberg M, Sisay MT, Guetschow M. Curr Top Med Chem. 2010;10(3):294–322. doi: 10.2174/156802610790725452. [DOI] [PubMed] [Google Scholar]; b) Boxer MB, Quinn AM, Shen M, Jadhav A, Leister W, Simeonov A, Auld DS, Thomas CJ. Chem Med Chem. 2010;5(5):730–738. doi: 10.1002/cmdc.200900531. [DOI] [PMC free article] [PubMed] [Google Scholar]; c) Greenspan PD, Clark KL, Tommasi RA, Cowen SD, McQuire LW, Farley DL, van Duzer JH, Goldberg RL, Zhou H, Du Z, Fitt JJ, Coppa DE, Fang Z, Macchia W, Zhu L, Capparelli MP, Goldstein R, Wigg AM, Doughty JR, Bohacek RS, Knap AK. J Med Chem. 2001;44(26):4524–4534. doi: 10.1021/jm010206q. [DOI] [PubMed] [Google Scholar]
- 25.Salassa L, Ruiu T, Garino C, Pizarro AM, Bardelli F, Gianolio D, Westendorf A, Bednarski PJ, Lamberti C, Gobetto R, Sadler PJ. Organometallics. 2010;29(24):6703–6710. [Google Scholar]
- 26.Falgueyret JP, Black WC, Cromlish W, Desmarais S, Lamontagne S, Mellon C, Riendeau D, Rodan S, Tawa P, Wesolowski G, Bass KE, Venkatraman S, Percival MD. Anal Biochem. 2004;335(2):218–227. doi: 10.1016/j.ab.2004.09.005. [DOI] [PubMed] [Google Scholar]
- 27.Desmarais S, Black WC, Oballa R, Lamontagne S, Riendeau D, Tawa P, Duong LT, Pickarski M, Percival MD. Mol Pharmacol. 2008;73(1):147–156. doi: 10.1124/mol.107.039511. [DOI] [PubMed] [Google Scholar]
- 28.Puckett CA, Ernst RJ, Barton JK. Dalton Trans. 2010;39(5):1159–1170. doi: 10.1039/b922209j. [DOI] [PMC free article] [PubMed] [Google Scholar]
Associated Data
This section collects any data citations, data availability statements, or supplementary materials included in this article.


