Abstract
Streptolysin O (SLO) is a protein cytotoxin derived from Group A beta-hemolytic streptococci that associates with membranes and permeabilizes cells. Oxidation inactivates SLO, eliminating the characteristic hemolytic and cytotoxic activities. However, oxidized SLO produces beneficial therapeutic effects in vivo on scleroderma, scar formation and wound healing. Here we report that oxidized SLO also significantly inhibited invasion by human metastatic breast cancer MDA-MB-231 cells through Matrigel in an in vitro model of metastatic disease. This dose-dependent response corresponded to selective SLO activation of epidermal growth factor receptor (EGFR) ErbB1. SLO and EGF were equally selective in activation of EGFR, but EGF elicited larger relative increases in phosphorylation at various sites, especially pronounced for Tyr845. Addition of SLO did not affect either ERK1/2 or Akt kinases and altered the expression of only 10 of 84 metastasis-related genes in MDA-MB-231 cells. Neither SLO nor EGF promoted growth of several human breast cancer cell lines. Knockdown of EGFR by siRNA ablated the inhibitory effect of SLO on cancer cell invasion, showing SLO selectively activated ErbB1 kinase to reduce invasion without increasing cell growth. The results suggest SLO might have promise as a new therapy to inhibit metastasis.
INTRODUCTION
Streptolysin O has been used widely as an analytical reagent for permeabilizing cells [1], taking advantage of the property that it binds to cholesterol in its reduced state and oligomerizes to create relatively large pores in the plasma membrane of cells [2, 3]. However, oxidized Streptolysin O (SLO) is inactive as a toxin and instead has been investigated as a therapeutic agent in pre-clinical in vivo animal models [4]. Interesting evidence for the effectiveness of SLO in resolution of scar tissue suggests SLO has effects on remodeling of the extracellular matrix, perhaps through changes in expression of matrix metalloproteinase and/or signaling in fibroblasts, keratinocytes or other cells to modify their migration and invasion [4]. These considerations led to our hypothesis that SLO might alter invasion of metastatic cancer cells. Here we tested SLO with a human breast cancer cell line MDA-MB-231 derived from metastatic disease. Cell invasion through Matrigel was inhibited by dose-dependent addition of SLO. Analysis of signaling events revealed that SLO selectively activated the EGF ErbB1 receptor. Knockdown of EGFR by siRNA prevented SLO inhibition of invasion, indicating that the EGFR is required for response to SLO. The results offer unexpected new insights into the mechanism of action of SLO and the role of EGFR in cancer metastasis.
MATERIALS AND METHODS
Cell Culture and Reagents
MDA-MB-231 human breast carcinoma cells were cultured in L-15 medium supplemented with 10% fetal bovine serum and maintained at 37°C in a humidified atmosphere without CO2. BD BioCoat Growth Factor Reduced BD Matrigel Invasion Chambers were purchased from BD Bioscience and Human Phospho-RTK Arrays were purchased from R&D Systems. Streptolysin O (SLO, also known as ML-5) was a purified recombinant preparation that was air oxidized to render it catalytically inactive. Anti-phospho ERK and anti-ERK were purchased from Cell Signaling. Anti-EGFR was a generous gift from S. Parsons (University of Virginia). Secondary antibodies Alexa Fluor® 680 goat anti-rabbit IgG and anti-mouse IgG were purchased from Invitrogen, and donkey anti-rabbit IRDye 800CW was purchased from LI-COR Biosciences (Lincoln, NE). Immunoblotting was done as previously described [5] and used quantitative infrared fluorescent scanning with the Odyssey system (LiCor Inds.). EGFR siGENOME SMARTpool siRNA was purchased from Thermo Scientific. Other reagents and chemicals were from Thermo Fisher Scientific.
Cell Invasion Assay
MDA-MB-231 cells (2.5 × 10⁵) were plated in duplicate into the upper chambers of a BD BioCoat Growth Factor Reduced Matrigel Invasion Chamber (BD Bioscience) in serum free media. Recombinant SLO in concentrations from 0 to 10 units/ml was added to cells 1.5 hours after plating and cells allowed to invade into the bottom chamber containing 10% fetal bovine serum for 22 h. Upper chambers were rinsed with phosphate buffered saline and wiped with cotton swabs to remove non-invasive cells. Lower chambers were washed with saline and the Matrigel inserts were fixed in methanol for 15 min and stained with 0.005% crystal violet/methanol to visualize the cells. Specimens were examined with a Zeiss Axiovert 135 inverted microscope using a 10X objective. The average number of invasive cells for each condition was calculated from images of six fields. Results from 3 independent experiments were used in a Student’s t test to determine statistical significance.
Invasion Assay with siRNA Knock down
MDA-MB-231 cells were seeded at a density of 900,000 per 10 cm plate in Dulbecco’s modified Eagle’s medium. Cells were transfected with either 100 nM EGFR siRNA or non-targeted siRNA using oligofectamine according to manufacturer’s instructions 1.5 h after plating. Cells were transfected again at 24 h and cultured for an additional 48 h. The siRNA treated MDA-MB-231 cells were plated (1.5 × 10⁵) in duplicate in the upper chamber of a BD BioCoat Growth Factor Reduced BD Matrigel Invasion Chamber (BD Bioscience) in serum free media. Either 10 units/ml recombinant SLO or 50 ng/ml EGF were added to cells 1.5 h post plating and cells were allowed to invade into the bottom chamber containing 10% FBS for 22 h. Upper chambers were rinsed with PBS and wiped with cotton swabs to remove non-invaded cells. Lower chambers were washed with PBS and the Matrigel inserts processed as described above. Whole cell extracts from siRNA treated cultures were immunoblotted with anti-EGF to demonstrate knock down.
RTK Arrays and Immunoblots
MDA-MB-231 cells were plated onto 10 cm tissue culture dishes and grown to 80% confluency. Cells were treated with 0 or 10 units/ml of recombinant SLO for 1.5 h. Alternatively, cells were treated with 50 ng/ml EGF for 1.5 h. After treatments cells were lysed in 400 ul of NP40 lysis buffer (1% NP40, 20 mM Tris-HCl (pH 8.0), 137 mM NaCl, 10% glycerol, 2 mM EDTA, 1 mM sodium orthovanadate, and 1X protease inhibitor cocktail V) and centrifuged at 13,000g for 15 min. Alternatively, peroxyvanadate was prepared as previously described [5] and added to cells prior to lysis. Human Phospho-RTK Arrays (R&D Systems) were incubated with 250 ug of whole cell extracts overnight at 4° C, washed and incubated with the anti-phospho-tyrosine-HRP for 2 h according to manufacturer’s instructions. Activated receptors were visualized with enhanced chemiluminescent staining and X-ray film exposure and quantitated using Image J software.
For immunoblots of EGFR activation MDA MB 231 cells were treated with 10 IU/ml SLO, 50 ng/ml EGF or vehicle control for 1.5 hours and cells collected with protein lysis buffer supplemented with protease and phosphatase inhibitor cocktail (Thermo Scientific, Rockford, IL, cat#78443). Each lane was loaded with 40 ug protein and proteins resolved by SDS-PAGE. The EGFR was analyzed using phosphosite-specific antibodies for Tyr845, Tyr1068, Tyr1045, Tyr992, Tyr1173 and EGFR protein, as loading control. Primary and secondary antibodies were purchased from Cell Signaling (#9922 and #6963). The experiments were independently replicated and immunoblots quantitated using densitometry and Image J software.
Gene expression analysis by RT-PCR
The expression of mRNA for a select series of genes was analyzed using the SABiosciences Human Tumor Metastasis RT2 Profiler™ PCR Array (PAHS-028) from Qiagen. Cultures of MDA-MB-231 cells were treated 24 hr with saline as control vs. 2 units/ml SLO. Samples were processed for total mRNA and RT-PCR with 0.5 ug cDNA used for analysis following the manufacturer’s protocol. The experiment was repeated independently three times and the average –fold change for SLO vs. control calculated for each of the genes to determine those with a significant (p<0.05) difference from control.
Cell growth assays
Human breast cancer cell lines were seeded at between 10 and 20 × 103 in 24 well plates. The MDA-MB-231 cells were cultured in L15 Medium Leibovitz without carbon dioxide atmosphere, the MCF-7 cells in DMEM with 5% CO2 and the SKBR3 and Bt549 cells in RPMI 1640 with 5% CO2. The following day cells were treated with 0.5% or 10% fetal bovine serum or 10% fetal serum with 50 ng/ml EGF (Invitrogen), or 2 units/ml, or 10 units/ml SLO (Capricorn). Growth of cells was assayed at days 2, 5 and 7 by addition of Alamar blue reagent (1:10 v/v) for 2 h and fluorescence intensity measured with a CytoFluor plate reader.
RESULTS AND DISCUSSION
SLO inhibits MDA MB 231 breast cancer cell invasion
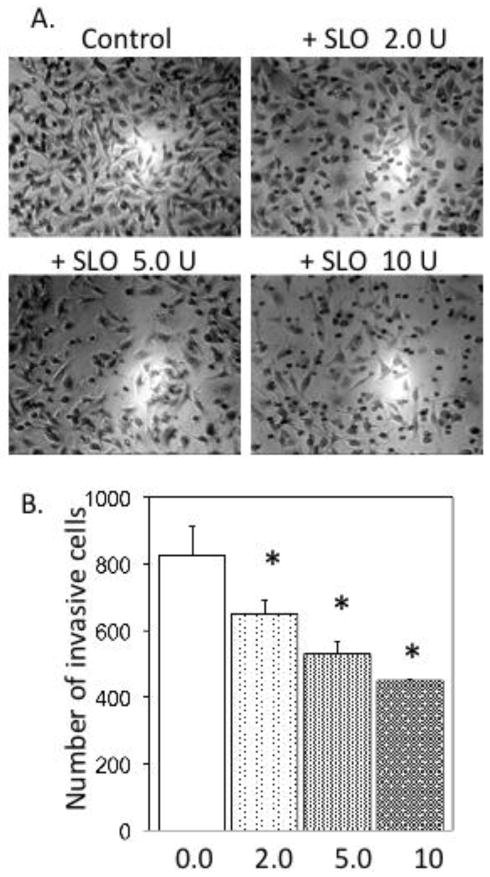
This study was designed to test whether oxidized bacterial cytotoxin Streptolysin O (SLO) inhibits the metastatic activity of human cancer cells. Human breast carcinoma MDA-MB-231 cells were assayed for invasion through Matrigel, using a two-chamber system where cells invade through extracellular matrix and then extrude through 8-micron pores in a filter membrane. Cells were transferred into the top wells coated with Matrigel and 0, 2, 5 or 10 units/ml of recombinant SLO were added. Fetal serum was in the lower chamber as an attractant. After 22 h the cells that had invaded through the Matrigel and emerged on the bottom of the membrane support were stained and examined under a microscope (Figure 1A). The average number of cells in six microscopic fields was determined, in duplicate samples. We observed no decrease in cell viability in cultures with up to 10 units/ml SLO and the total number of cells remained the same under each of the conditions. The results were replicated in three independent experiments. With 2, 5 and 10 units/ml SLO the reduction in cell invasion was statistically significant (p ≤ 0.02), compared to the control with no added SLO (Figure 1B). The data showed a SLO dose-dependent reduction in the number of cancer cells that invaded through Matrigel. The incremental decrease in invasion with increasing doses of SLO gave a dose-response relationship that tended toward saturation, suggesting SLO action involved binding to a discrete number of cell surface receptors.
Figure 1. Inhibition of human breast cancer MDA-MB-231 cell invasion by SLO.
A. Microscopic images of MDA-MB-231 cells on the bottom surfaces of filters following invasion in the Matrigel assay at the indicated doses of SLO, as described in Materials and Methods. B. Analysis of the cumulative number of invasive cells at the indicated doses of SLO (units/ml), replicated in three independent experiments to give standard error of the mean, with significance of p< 0.05 by Student’s t test.
SLO activates the EGFR ErbB1 in MDA-MB-231 cancer cells
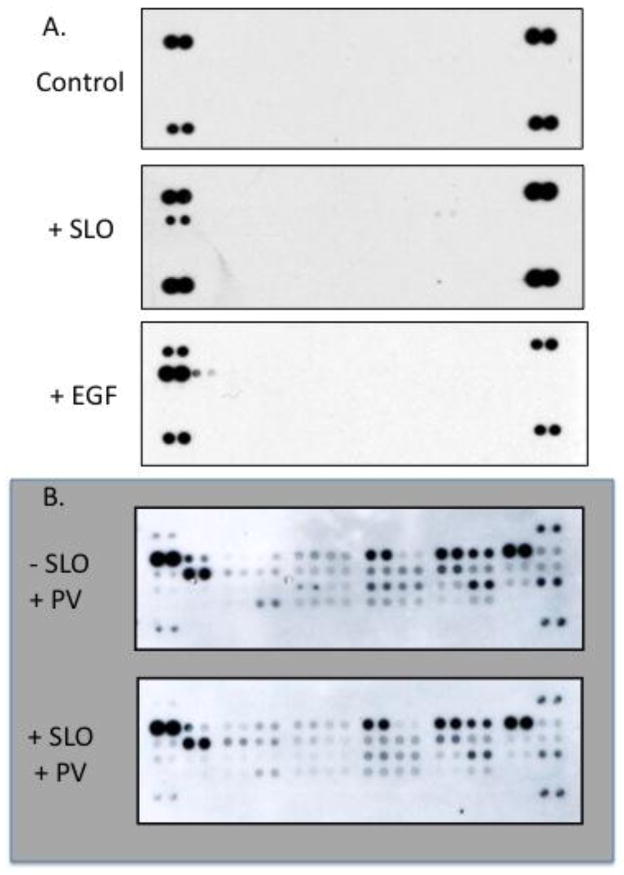
Cell signaling involves activation of receptor tyrosine kinases (RTK) and we tested whether RTKs were activated by SLO. MDA-MB-231 cells treated with 0 or 10 units/ml of recombinant SLO for 1.5 h, a time chosen to examine initial signaling events that would lead to the altered cellular phenotypes. Cell extracts were incubated with an slide-based array of antibodies for 42 human RTKs. Control MDA-MB-231 cells did not show detectable activation of any of the RTKs in the array, compared to the internal pTyr standards that appear as pairs of dots in the corners of the arrays (Figure 2A). SLO selectively activated only the EGF receptor ErbB1 (not ErbB2, 3, 4 that were also present on the array, in the same row), even in the constant presence of 10% fetal serum in the medium. Independent experiments (n = 3) confirmed that 10 units/ml of recombinant SLO induced a significant (p ≤ 0.02) activation of EGFR in MDA-MB-231 cells compared to non-treated control cells. We compared the effects of SLO to purified EGF on activation of RTKs in MDA-MB-231 cells. At a dose of 50 ng/ml EGF we found robust activation of the EGF receptor (Figure 2A). We noted that the phosphotyrosine staining of the EGFR induced by EGF was greater intensity than the internal pTyr standards. By comparison, SLO activation of EGFR yielded less intense staining than the internal standards. These results demonstrated selective activation of EGFR ErbB1 in MDA-MB-231 cells by addition of either SLO or EGF.
Figure 2.
Analysis of Receptor Tyr Kinases (RTK) activation in human breast cancer MDA-MB-231 cells. A. Cells were treated with medium alone or added SLO (10 units/ml) or EGF (50 ng/ml) and extracts analyzed as described in Materials and Methods. Data are representative of independent replicates for each condition. B. Cells were pre-treated with or without SLO, then with peroxyvanadate (PV) and processed to analyze RTK activation.
Most RTKs were not detected as active in MDA MB 231 cells when using this assay according to the manufacturer’s protocol. To enhance sensitivity we pre-treated cells with the protein Tyr phosphatase inhibitor peroxyvanadate. This inhibited dephosphorylation of RTKs in the live cells; boosting their pTyr content and improving detection on the array. Cells were treated with peroxyvanadate alone for 5 min as a control and compared to cells treated with SLO, plus peroxyvanadate for the last 5 min of treatment (Figure 2B). Extracts were prepared and the arrays were developed exactly as before. In contrast to the essentially blank arrays seen previously, the RTK arrays from peroxyvanadate-treated cells showed Tyr phosphorylation of nine RTKs above background. These were sorted into three groups by relative staining intensity (Figure 2B): EGFR and Axl >, FGFR3, HGFR, Insulin R > IGF-IR, c-Ret, EphA2 and EphA4. The EGFR ErbB1 and Axl were the most intensely stained RTKs in peroxyvanadate treated cells, (both on the same top row, at/near opposite ends of the array).
Peroxyvanadate was effective at inhibiting Tyr phosphatases in the intact cells and preserved phosphorylation of RTKs that otherwise undergo dephosphorylation during preparation of cell extracts. The greatly increased yield of pTyr in the active RTKs is evident by comparison of the staining intensity of the RTKs relative to the internal pTyr standards in the four corners of every array. Furthermore, the results revealed that in MDA-MB-231 cells only a few RTKs are active. In other human cell lines that we have examined, such as melanomas, we found a different subset of activated RTKs [6], demonstrating the responsiveness and validity of the assay. Combination treatment of peroxyvanadate plus SLO did not reveal differences in RTK activation relative to control cells treated with peroxyvanadate alone (Figure 2B). The results show only ErbB1, but no other RTK, was activated by SLO, demonstrating a high degree of specificity.
It is interesting to note that Axl was the second most phosphorylated RTK detected in MDA-MB-231 cells, confirming that it is highly expressed in the most aggressively invasive breast cancer cell lines. Over expression of Axl converts less invasive cells into cells with a more invasive phenotype and, conversely, siRNA knockdown or chemical inhibition of Axl significantly reduces motility and invasiveness of human breast cancer cells [7].
Different responses of EGFR to SLO and EGF
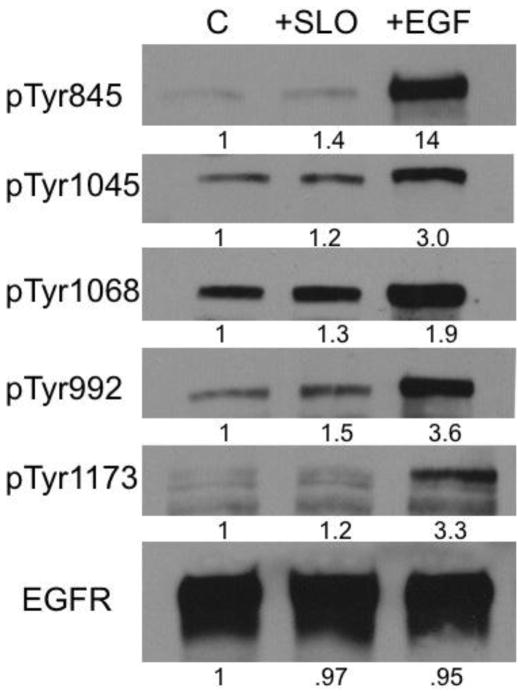
SLO specificity for ErbB1 activation in MDA-MB-231 cells mimicked the response to EGF. However, we noted differences between responses to SLO vs. EGF. First, EGF gave higher intensity pTyr staining of EGFR compared to SLO on the RTK array. Second, immunoblotting with phosphosite-specific antibodies showed relative increases in EGFR phosphorylation at various Tyr sites was different with SLO compared to EGF (Figure 3). With EGF there was a 1.9 to 14-fold increase, whereas with SLO the increase was over a more narrow range, from 1.2 to 1.5-fold. These results revealed that SLO activated Tyr phosphorylation of EGFR at Tyr992, 1068, 1045 and 1173 about half as much as EGF, compared to Tyr845 where there was a 10-fold difference in SLO vs. EGF (Figure 3). Thus, both SLO and EGF specifically activate Tyr phosphorylation of EGFR in MDA-MB-231 cells, but in different patterns. This could account for how the SLO activation of EGFR reported here produces significant inhibition of MDA-MB-231 cell invasion, whereas in previous reports EGF added to MDA-MB-231 cells had no effect, or produced some increase in invasion [8–13].
Figure 3.
Analysis of Tyr phosphorylation sites in EGFR in response to SLO or EGF. MDA MB 231 cells were treated with 10 IU/ml SLO, 50 ng/ml EGF or vehicle control for 1.5 h and analyzed by immunoblotting with phosphosite-specific antibodies and with anti-EGFR, as loading control, as described under Materials & Methods. Relative increases (shown as -fold increase vs. control) were determined by densitometry and the results were replicated in an independent experiment.
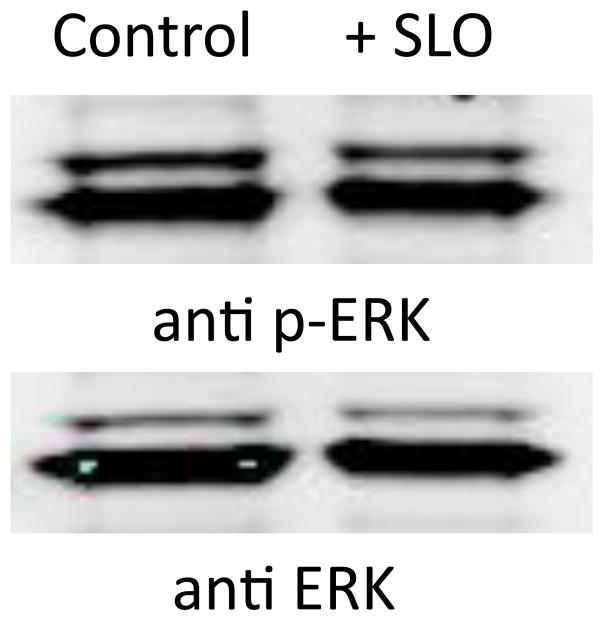
SLO activation of ErbB1 did not increase phosphorylation of ERK kinase, a hallmark of EGF signaling. Downstream of ErbB1 is the Raf-MEK-ERK kinase pathway that transmits intracellular signals by phosphorylation of transcription factors and enzymes [14, 15]. ERK becomes activated by MEK-catalyzed dual phosphorylation of Thr-X-Tyr in the kinase activation loop [16]. We used phosphosite-specific antibodies to compare ERK activation in MDA-MB-231 cells with and without addition of SLO (Figure 4). There was no difference in phosphorylation, indicative of no change in ERK activation. The total amount of ERK protein in these cell extracts was identical, based on staining with a separate antibody. We also did not observe an increase in phosphorylation of S473 in Akt in response to SLO (not shown). Thus, SLO-mediated Tyr phosphorylation of ErbB1 was not coupled to an increase in ERK or Akt activation in MDA-MB-231 cells.
Figure 4.
ERK activation in human breast cancer MDA-MB-231 cells. Cells grown in medium with and without added SLO (10 units/ml) were extracted and immunoblotted as described for ERK phosphosite-specific antibody (anti p-ERK, upper panel) and for total ERK protein (anti ERK, lower panel).
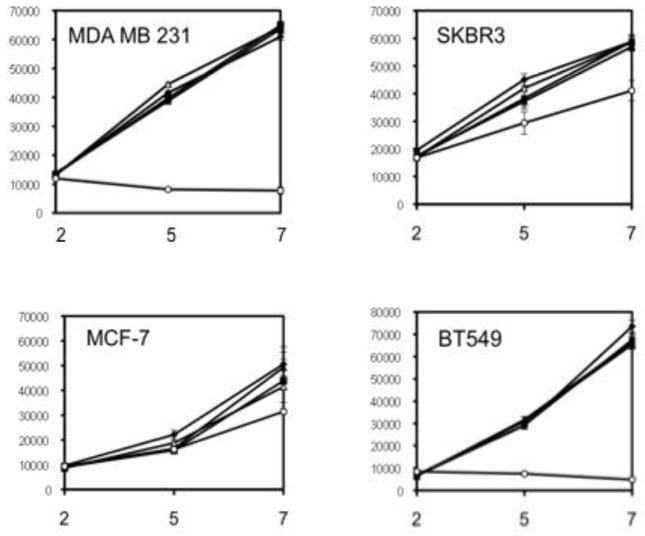
The lack of ERK activation by SLO might be due to the high basal level of ERK activation due to mutations in K-Ras and B-Raf in MDA-MB-231 cells [17]. However, even with mutations in the Ras-Raf-MEK-ERK pathway these cells showed serum dependence for proliferation. In 10% serum the addition of SLO or EGF did not further increase cell proliferation. We also tested other breast cancer cell lines and found that neither EGF nor SLO had much effect on proliferation. Cells were plated and grown for up to one week in regular (10%) or reduced (0.5%) serum, or regular serum with added SLO or EGF. The number of viable cells was assayed by reaction with the dye Alamar blue. The cell lines tested (MDA-MB-231, SKBR3, MCF-7 and BT549) all showed some dependence on serum, to a greater or lesser extent (Figure 5). However, there was no change in proliferation rates of these human cancer cell lines with added SLO or EGF under the conditions tested. These other cells are transformed by mutations in PTEN or PI3K [17]. We concluded that these mutations enable proliferation of breast cancer cells, whereas SLO signaling from the EGFR is not required for proliferation, but instead is modulating expression of other genes and cellular processes related to cell invasion.
Figure 5.
Proliferation of human breast cancer cells. The cell lines MDA-MB-231, SKBR3, BT549 and MCF-7 (clockwise) were grown in culture as described with 0.5% fetal serum (open circles) or 10% fetal serum alone (closed squares) or with added EGF (50 ng/ml; closed diamonds), or SLO (2 units/ml, open triangles; 10 units/ml, closed triangles). At days 2, 5, 7 the number of viable cells was assayed by Alamar blue and fluorescence intensity measured in arbitrary units.
Gene expression in response to SLO
Our evidence that SLO inhibited cancer cell invasion in a surrogate assay for metastasis led us to investigate whether SLO caused changes in the levels of mRNA from genes associated with tumor metastasis. This assay used Real Time PCR with a series of custom primers for 84 genes known to be involved in tumor metastasis. Gene expression was analyzed following 24 h exposure to SLO or a saline-treated control, approximately the same time frame as the Matrigel invasion assay. Triplicate arrays were used and the average values used to calculate the relative –fold change in SLO treated vs. control. Only 10 of the 84 genes tested showed more than a 1.5-fold up or down regulation (with p< 0.1 or 0.05) with six mRNA levels increased and four decreased (Table 1). The largest changes were the more than 3-fold increased expression of mRNA for matrix metallopeptidase-3 (MMP-3) and the inflammatory cytokine Il-1beta. In contrast to the elevation in MMP-3, the expression of two other matrix metallopeptidases (MMP2 and MMP9) were suppressed. These results demonstrate a cell signaling response to SLO that significantly affects a limited subset of genes related to metastasis. The divergence of response between MMP3 and MMP 2 and 9 makes it difficult to attribute changes in MMPs to cellular phenotype.
Table 1.
Changes in expression of selected tumor metastasis genes induced by SLO treatment of human breast cancer MDA-MB-231 cells.
| Gene symbol | Name | -fold change |
|---|---|---|
| MMP3 | matrix metalloproteinase-3 | + 3.8 |
| IL1B | interleukin 1 beta | + 3.7 |
| ITGA7 | integrin alpha 7 | + 2.5 |
| MTSS1 | metastasis suppressor-1 | + 2.1 |
| NR4A3 | nuclear receptor 4A3 | + 1.6 |
| VEGFA | vascular endothelial growth factor | + 1.5 |
| RORB | RAR-related orphan receptor | − 2.5 * |
| MMP2 | matrix metalloproteinase-2 | − 2.1 * |
| CXCR4 | chemokine C-X-C motif receptor | − 1.8 |
| MMP9 | matrix metalloproteinase-9 | − 1.6 |
The -fold changes are significant with p< 0.05, except for those indicated with an asterisk, p< 0.1.
SLO inhibition of invasion is dependent on EGFR
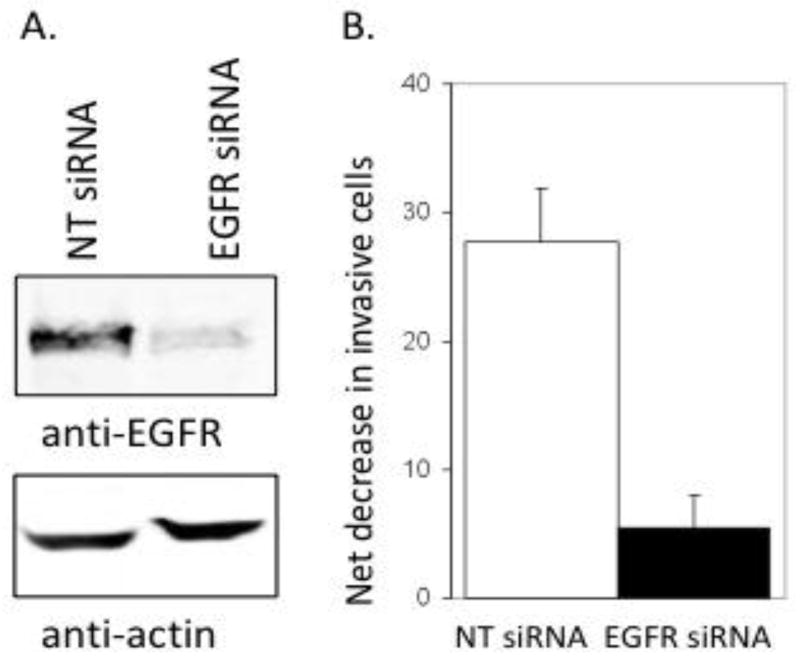
To determine if SLO inhibition of invasion that correlated to activation of EGFR actually required the EGFR we used siRNA to knockdown EGFR in MDA-MB-231 cells and a non-coding siRNA as a control. Quantitative fluorescent immunoblotting showed the levels of EGFR were reduced more than 80% (Figure 6A). Control siRNA and EGFR knock-down cells were treated with either buffer or 10 units/ml of SLO in the Matrigel invasion assay. Control cells with non-targeted knockdown showed a significant (p ≤ 0.05) reduction in the number of invasive cells in the presence of SLO, reproducing again our primary observation. However, SLO treatment of EGFR knock-down cells yielded less reduction in the number of invasive cells, or less net decrease in invasive cells due to addition of 10 units/ml SLO (Figure 6B). The results demonstrate that inhibition of cell invasion by SLO is dependent on the expression of EGFR in MDA-MB-231 cells.
Figure 6.
Knockdown of EGFR by siRNA reduces SLO inhibition of human breast cancer MDA-MB-231 cell invasion. A. Immunoblotting of EGFR (upper panel) and actin (lower panel) as a loading control in extracts of cells transfected with a non-targeted (NT) siRNA or with pooled siRNA targeted to EGFR, as described in Materials and Methods. B. The net decrease (control – SLO treated) in number of cells invading through Matrigel in cells transfected with control vs. EGFR targeted siRNA.
In summary, we have described SLO as a novel agent that inhibits in vitro invasion of breast cancer cells through extracellular matrix without stimulating cell growth. This response requires the EGFR that is activated very specifically by SLO. EGFR activation by SLO is as specific as, but distinct from, activation by EGF. Often metastasis, not the growth of a primary tumor, is central to patient morbidity and mortality. To this end, there is an urgent need for agents that reduce or interfere with metastasis, without adverse side effects. We think that SLO holds promise as such an agent.
Acknowledgments
EHH was supported in part by fellowship T32 CA009109 and DLB by grant CA40024 from the National Cancer Institute. The authors acknowledge Beech Tree Labs for financial support. VG and JMM are employees of Beech Tree Labs, JMM is a shareholder in the company and AED is a consultant. The authors wish to thank Christoph Schorl and Hilary E. Hartlaub at the Genomics and Proteomics Core Facility of Brown University for providing access to real time PCR machine, analysis software and other technical support.
Footnotes
Publisher's Disclaimer: This is a PDF file of an unedited manuscript that has been accepted for publication. As a service to our customers we are providing this early version of the manuscript. The manuscript will undergo copyediting, typesetting, and review of the resulting proof before it is published in its final citable form. Please note that during the production process errors may be discovered which could affect the content, and all legal disclaimers that apply to the journal pertain.
References
- 1.Alouf JE. Pharmacol Ther. 1980;11(3):661–717. doi: 10.1016/0163-7258(80)90045-5. [DOI] [PubMed] [Google Scholar]
- 2.Bhakdi S, Tranum-Jensen J, Sziegoleit A. Infect Immun. 1985;47(1):52–60. doi: 10.1128/iai.47.1.52-60.1985. [DOI] [PMC free article] [PubMed] [Google Scholar]
- 3.Bhakdi S, Bayley H, Valeva A, Walev I, Walker B, Kehoe M, Palmer M. Arch Microbiol. 1996;165(2):73–79. doi: 10.1007/s002030050300. [DOI] [PubMed] [Google Scholar]
- 4.Mamber SW, Long V, Rhodes RG, Pond-Tor S, Wheeler LR, Fredericks K, Vanscoy B, Sauniere JF, Steinschneider R, Laurent JC, McMichael J. Nonlinearity Biol Toxicol Med. 2004;2(2):67–87. doi: 10.1080/15401420490464295. [DOI] [PMC free article] [PubMed] [Google Scholar]
- 5.Hall EH, Balsbaugh JL, Rose KL, Shabanowitz J, Hunt DF, Brautigan DL. Mol Cell Proteomics. 2010;9(12):2853–2863. doi: 10.1074/mcp.M110.003665. [DOI] [PMC free article] [PubMed] [Google Scholar]
- 6.Molhoek KRSA, Smolkin M, Chowbina S, Papin J, Brautigan DL, Slingluff CL., Jr Melanoma Res. 2011 doi: 10.1097/CMR.0b013e328343a1d6. in press. [DOI] [PMC free article] [PubMed] [Google Scholar]
- 7.Zhang YX, Knyazev PG, Cheburkin YV, Sharma K, Knyazev YP, Orfi L, Szabadkai I, Daub H, Keri G, Ullrich A. Cancer Res. 2008;68(6):1905–1915. doi: 10.1158/0008-5472.CAN-07-2661. [DOI] [PubMed] [Google Scholar]
- 8.Kimura F, Iwaya K, Kawaguchi T, Kaise H, Yamada K, Mukai K, Matsubara O, Ikeda N, Kohno N. Cancer Sci. 2010;101(5):1133–1140. doi: 10.1111/j.1349-7006.2010.01527.x. [DOI] [PMC free article] [PubMed] [Google Scholar]
- 9.Price JT, Tiganis T, Agarwal A, Djakiew D, Thompson EW. Cancer Res. 1999;59(21):5475–5478. [PubMed] [Google Scholar]
- 10.Shao ZM, Wu J, Shen ZZ, Barsky SH. Anticancer Res. 1998;18(3A):1435–1439. [PubMed] [Google Scholar]
- 11.Trusolino L, Cavassa S, Angelini P, Ando M, Bertotti A, Comoglio PM, Boccaccio C. Faseb J. 2000;14(11):1629–1640. doi: 10.1096/fj.14.11.1629. [DOI] [PubMed] [Google Scholar]
- 12.Wang SJ, Saadi W, Lin F, Minh-Canh Nguyen C, Li Jeon N. Exp Cell Res. 2004;300(1):180–189. doi: 10.1016/j.yexcr.2004.06.030. [DOI] [PubMed] [Google Scholar]
- 13.Azios NG, Dharmawardhane SF. Neoplasia. 2005;7(2):128–140. doi: 10.1593/neo.04346. [DOI] [PMC free article] [PubMed] [Google Scholar]
- 14.Roberts PJ, Der CJ. Oncogene. 2007;26(22):3291–3310. doi: 10.1038/sj.onc.1210422. [DOI] [PubMed] [Google Scholar]
- 15.Keshet Y, Seger R. Methods Mol Biol. 2010;661:3–38. doi: 10.1007/978-1-60761-795-2_1. [DOI] [PubMed] [Google Scholar]
- 16.Procaccia S, Kraus S, Seger R. Methods Mol Biol. 2010;661:39–58. doi: 10.1007/978-1-60761-795-2_2. [DOI] [PubMed] [Google Scholar]
- 17.Hollestelle A, Elstrodt F, Nagel JH, Kallemeijn WW, Schutte M. Mol Cancer Res. 2007;5(2):195–201. doi: 10.1158/1541-7786.MCR-06-0263. [DOI] [PubMed] [Google Scholar]


