Abstract
There is an imperative need to develop methods that can rapidly and accurately determine individual exposure to radiation for screening (triage) populations and guiding medical treatment in an emergency response to a large-scale radiological/nuclear event. To this end, a number of methods that rely on dose-dependent chemical and/or physical alterations in biomaterials or biological responses are in various stages of development. One such method, ex vivo electron paramagnetic resonance (EPR) nail dosimetry using human nail clippings, is a physical biodosimetry technique that takes advantage of a stable radiation-induced signal (RIS) in the keratin matrix of fingernails and toenails. This dosimetry method has the advantages of ubiquitous availability of the dosimetric material, easy and non-invasive sampling, and the potential for immediate and rapid dose assessment. The major challenge for ex vivo EPR nail dosimetry is the overlap of mechanically induced signals and the RIS. The difficulties of analysing the mixed EPR spectra of a clipped irradiated nail were addressed in the work described here. The following key factors lead to successful spectral analysis and dose assessment in ex vivo EPR nail dosimetry: (1) obtaining a thorough understanding of the chemical nature, the decay behaviour, and the microwave power dependence of the EPR signals, as well as the influence of variation in temperature, humidity, water content, and O2 level; (2) control of the variability among individual samples to achieve consistent shape and kinetics of the EPR spectra; (3) use of correlations between the multiple spectral components; and (4) use of optimised modelling and fitting of the EPR spectra to improve the accuracy and precision of the dose estimates derived from the nail spectra. In the work described here, two large clipped nail datasets were used to test the procedures and the spectral fitting model of the results obtained with it. A 15-donor nail set with 90 nail samples from 15 donors was used to validate the sample handling and spectral analysis methods that have been developed but without the interference of a native background signal. Good consistency has been obtained between the actual RIS and the estimated RIS computed from spectral analysis. In addition to the success in RIS estimation, a linear dose response has also been achieved for all individuals in this study, where the radiation dose ranges from 0 to 6 Gy. A second 16-donor nail set with 96 nail samples was used to test the spectral fitting model where the background signal was included during the fitting of the clipped nail spectra data. Although the dose response for the estimated and actual RIS calculated in both donor nail sets was similar, there was an increased variability in the RIS values that was likely due to the variability in the background signal between donors. Although the current methods of sample handling and spectral analysis show good potential for estimating the RIS in the EPR spectra of nail clippings, there is a remaining degree of variability in the RIS estimate that needs to be addressed; this should be achieved by identifying and accounting for demographic sources of variability in the background nail signal and the composition of the nail matrix.
INTRODUCTION
In the response to a large-scale radiological/nuclear event (i.e., an event where triage is needed to achieve balance between the capabilities of the medical system and the number of individuals potentially at risk), it will be necessary to conduct dosimetry as the first level of triage to identify those individuals who should enter the next stage of the medical system to deal with the potential onset of acute radiation syndrome. The initial triage step is to separate the largest segment of the potentially exposed individuals who have been irradiated to doses under 2 Gy from those who may have received doses over 2 Gy(1–3).
To accomplish the needed initial screening, it is necessary to develop methods that can rapidly and accurately determine individual exposure to radiation. However, in a mass casualty scenario, determining individual exposure to a level of accuracy and precision that is required for assessing the need for medical intervention will be difficult by conventional methods due to the absence of standard personal dosimetry devices (i.e., film badges). This limitation can, however, be overcome through the use of biodosimetry methods that are based on measuring dose-dependent changes in one or more physical or biological responses to the incident radiation, either directly on an individual or in samples (i.e., blood, urine, hair, nails, etc.) collected from an individual(1, 4–7). Essentially, an ever-present dosemeter that is based on the individual's own tissue is substituted for an external dosemeter.
Two types of biodosimeters are currently under development: those based on biological responses to radiation and those based on physical or chemical changes that occur in materials collected from an individual. Biological biodosimetry assays, based on parameters such as DNA damage, gene activation, cytokine levels, and metabolic products, show good response to radiation exposure; therefore, they have the potential to function as estimators of the dose received by an individual(4). However, these responses are typically not specific to the radiation exposure but are instead radiation-induced perturbations within the normal variances and response to damage of cellular, organ, or system function; thus, they are affected by other factors (i.e., previous disease, variations in baseline and simultaneous perturbations such as wounds, burns and extreme psychological and physical stress), both with regard to the magnitude and time-dependent changes in the response(1). The combination of these multiple factors on the measured biological response may make these assays better suited for the second stage of triage in which the focus is on determining an individual's response. Complimentary to biologically based methods are physically based biodosimetry methods, which measure the physical or chemical changes that occur in external materials (i.e., cloth, glass, plastic, etc.) among the personal effects or biological materials (i.e., teeth, hair, nails) collected from an individual(5, 7–12). Because physically based biodosimetry methods are not affected by the factors that can affect biological responses, they are more amenable to measuring dose and also offer the ability to assess dose distribution over an individual. These dosimetry approaches, however, do not provide direct information on an individual's response to the radiation(1).
One physically based biodosimetry method that is being developed takes advantage of the chemical changes that occur when fingernails or toenails are exposed to radiation. This produces relatively stable chemical species with unpaired electrons in the keratin proteins that comprise the nails. These radicals can be sensitively detected and quantified by electron paramagnetic resonance (EPR) spectroscopy(5, 7, 8, 10, 11, 13, 14). The radiation sensitivity of nails is relatively high, and the radicals are sufficiently stable over time due to the condensed nature of the keratin proteins in nails(13, 14). Furthermore, the number of radicals is proportional to the magnitude of the dose over a wide dose range. These are the motivations for our study of the feasibility and methodology of nail EPR dosimetry for population triage in case of mass casualty radiation events(5, 8, 15–17).
There are two approaches to measuring the radiation-induced signal (RIS) that arises from the formation of the radicals that are formed in the nail. A clipping of the nail can be collected and measured ex vivo using conventional EPR instrumental techniques. However, cutting the nail produces a mechanically induced signal (MIS) in the clipping(5, 7, 10, 18, 19). This MIS directly overlaps with the RIS, preventing the direct measurement of the RIS in the clipping. This interference can be overcome by avoiding the need to obtain a nail clipping and instead making direct measurements of the RIS in the nail plate using an in vivo EPR technique similar to that used for in vivo EPR tooth dosimetry(5, 15, 20). However, in vivo EPR nail method is not sufficiently advanced at the current time to be used in EPR nail dosimetry. Therefore, methods are being developed to account for the MIS interference and provide accurate measurements of the RIS in irradiated nail clippings(5, 7, 8, 10, 12, 14, 17, 18).
One such method uses spectral fitting methods to quantify the individual signals from the MIS and RIS, thereby allowing the RIS amplitude in the overall nail spectrum to be determined. Herein, we describe a linear regression spectral fitting model that uses two spectral components to individually describe the MIS and RIS, thereby deriving an estimate of the RIS content within a clipped nail spectrum. To achieve sufficient accuracy of the two-component spectra, a number of methodological considerations were addressed to insure the stability of the component signals underlying the MIS and RIS throughout the process from nail collection to measurement of the EPR spectrum of the clipped nail. This study describes the sample-handling methods that have been developed and the application of the two-component spectral fitting model in the analysis of irradiated clipped nail spectra from a dose-response study of nails from 23 healthy donors.
MATERIALS AND METHODS
Sample preparation
Sets of nail clippings were collected from 23 volunteers. Each volunteer contributed clippings from six nails. To remove the MIS from harvesting the nail clipping during sample collection and prevent the regeneration of a background signal, all nails were soaked in water for 20 min, surface wiped dry with Kimwipes, placed in mylar bags containing molecular sieve and an iron powder-based O2 scavenger, and further dried under dry nitrogen gas in a glove bag. The water content of the water-treated nail clippings was monitored indirectly by the effect that it had on the signal amplitude of an internal standard for all samples until a consistent, minimum level (maximum internal standard amplitude) was obtained, usually within 1–2 h under the drying conditions of the glove bag.
Experimental procedure
To emulate a radiation disaster scenario, the dry nail clippings were first irradiated and then cut to simulate the harvesting of the nail clipping. Prior to irradiation (pre-IR), the EPR spectrum was measured for each sample to obtain the background signal that may have not been removed from the initial nail clipping. Then, of the six nails from each donor, two nails received a sham dose of 0 Gy, and the remaining nails received a dose of 1, 2, 4 or 6 Gy from a 137Cs source. EPR spectra were acquired post-irradiation (post-IR) to obtain the actual RIS signal. The six nails were then cut into small pieces to simulate harvesting of the nail clipping from in vivo irradiated nails, and EPR spectra were measured immediately (post-cut) to obtain the combined MIS and RIS spectra. All sample handling was done in glove bags purged with dry air.
Instrumental settings
Spectra were acquired on a Bruker EMX X-band EPR spectrometer with a High-Q resonator. The centre field of the magnet was set at 3500 gauss and the sweep width was 150 gauss. The modulation frequency was 100 kHz, with an amplitude of 5 gauss. The microwave incident power was 0.4 mW. Spectra were acquired as the average of five scans using a time constant of 40.96 ms and sweep time of 40 s. The amplitude of each nail spectrum was normalized both to the signal of a reference standard (singlet at g = 1.98 from a standard supplied by Bruker BioSpin, Bilerica, MA, USA) located inside the cavity below the nail sample and to nail mass.
RESULTS AND DISCUSSION
The detection and quantification of the RIS in nail clippings acquired from individuals who potentially have been exposed to ionising radiation will require a reliable method to eliminate the interference of the MIS from the required clipping of the nail. The approach described here uses a spectral fitting procedure and model that is based on a well-defined set of basis spectra for MIS and RIS spectral components to derive an estimate of the RIS signal in irradiated nail clippings. For this approach to be successful, three steps were taken: (1) the MIS, RIS, and background signals and their spectral properties were thoroughly studied; (2) a nail sample-handling method was developed to control the stabilities of the component signals after the nail clipping is harvested to ensure consistency in the match of the spectral elements in the EPR spectra; and (3) a spectral model was developed to provide an estimate of the RIS intensity in the nail EPR spectrum.
Characterisation of the MIS and RIS signals
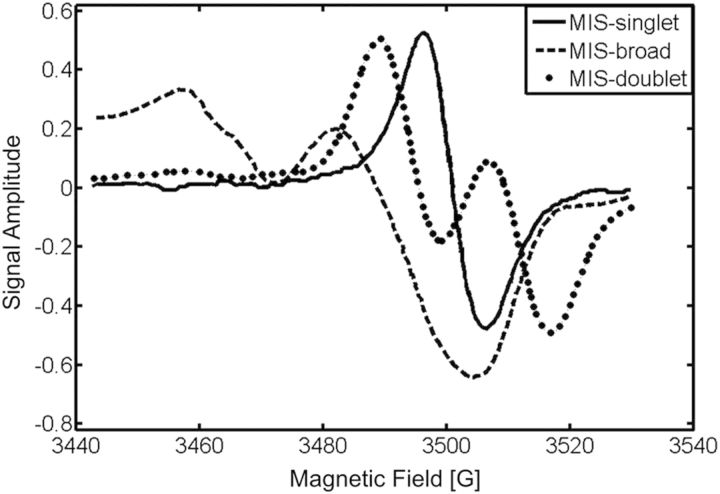
As described in previous work(5, 7, 10), the MIS is composed of four signals. Figure 1 shows three of these signals produced by the harvesting cut, which is needed to collect the nail clipping from exposed individuals. These three signals are: (1) an 18 gauss doublet (MIS-doublet), (2) a rhombic anisotropic spectrum covering 150 gauss (MIS-broad), and (3) a singlet with a 10 gauss line width (MIS-singlet). Underlying these three signals, and coincident with the MIS-singlet, is a background singlet signal. Also, the RIS is coincident with these signals. Of these signals, the MIS-doublet and the MIS-broad can be easily distinguished from the other signals due to well-separated spectral features and differences in either their stability or microwave power saturation behaviour.
Figure 1.
The three spectral components of the MIS: MIS-doublet (dotted), MIS-broad (hashed) and MIS-singlet (solid).
The stabilities of the MIS and RIS spectral components differ with time after cutting and irradiation, respectively. These stabilities are dependent on the water and oxygen content of the nail, in addition to ambient temperature(8–10). Of the three MIS components, the MIS-doublet is the least stable, with a lifetime of 20–60 min depending on the water content and temperature of the nail. The MIS-broad and MIS-singlet have similar stabilities within the first 20–30 min following the cutting, but the MIS-broad is found to be less stable than the MIS-singlet at longer times; the MIS-singlet is the last remaining signal in clipped nails. The RIS has a stability and power saturation behaviour similar to the MIS-singlet. Therefore, approaches to exploit differences in the stabilities or microwave power saturation behaviour of the MIS-singlet and RIS to differentiate these two signals have not been successful in nails receiving doses under 10 Gy(5, 7, 10).
The individual spectral components of the MIS and the RIS can be isolated and used as well-defined basis spectra. Based on these spectra, a spectral decomposition method was developed, whereby the RIS amplitude can be determined indirectly. The method relies on subtraction of the MIS-doublet and MIS-broad signals from the nail EPR spectrum, followed by an estimation of the MIS-singlet and RIS in the remaining signal. The estimation of the MIS-singlet is calculated from the MIS-broad signal amplitude using a predetermined constant (i.e., the ratio of the MIS-broad to MIS-singlet amplitudes). This ratio was determined based on studies of these two MIS components in multiple donor nails, which showed similar signal ratios across nail donors within the first 60 min following harvesting of a nail clipping. The RIS amplitude is then estimated from the difference between the residual sample signal and the estimated amplitude of the MIS-singlet. Testing of this signal analysis in a 30-donor validation study demonstrated that RIS estimates can be obtained at doses as low as 1 Gy with a linear dose response within a 0–10 Gy range(5).
One outcome of this validation study was a higher than expected relative standard deviation (RSD) of 26% for the amplitude ratios of the MIS-broad/MIS-singlet. A similar RSD of 25% was found for the inter- and intra-individual variability of the RIS and MIS-singlet amplitude estimates. However, the consistency of the MIS-broad/MIS-singlet ratio is critical to determining the MIS-singlet and the RIS in the spectral analysis method. To accurately estimate the MIS-singlet amplitude based on the MIS-broad amplitude, control of the variability in this ratio must be attained. Subsequent investigation found that the variability in the MIS-broad/MIS-singlet ratio was likely due to variation in the water content of the nails that accentuated differences in the decay kinetics between the two signals(5).
To improve the stabilities of the EPR-detectable species in the irradiated clipped nail samples, the sample handling procedure was modified. The purpose of the modification was to control the water and oxygen content of the nail clipping following harvesting. As has been noted, the water content of the nail clipping influences the stabilities of the MIS- and RIS-component signals(5, 7–10). Reducing the water content in nails increases the stability of all spectral components in the irradiated clipped nail. Oxygen is also important in the decay of the MIS-doublet. As shown in Figure 2, exposing the nail clipping to a nitrogen gas atmosphere reduces the oxygen content, thereby minimizing the loss of signal. Therefore, we anticipate that by reducing both water and oxygen content after harvesting the nail clipping, the intensities of the MIS and RIS components in the nail clipping can be retained at or near those produced immediately after the cut.
Figure 2.
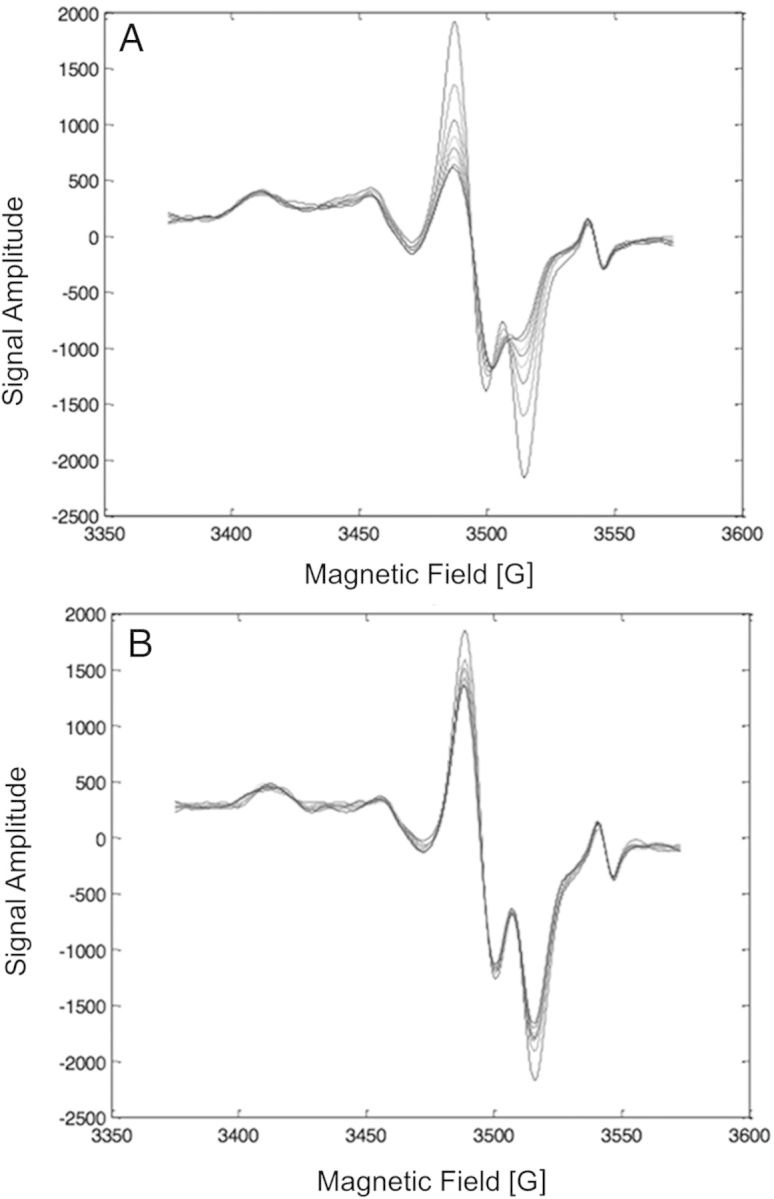
Decay of the MIS in fingernail clippings exposed to ambient air (A) or carbon dioxide (B) over 60 min following cutting. Under air, the MIS-doublet undergoes rapid fading as seen by the decrease the intensity of the peak at 3520 G, with some minor fading of the MIS-broad as seen in the peak centred at 3460 G. However, under carbon dioxide the fading is dramatically slowed for all the MIS spectral components. The peak at 3545 G is the Bruker reference standard.
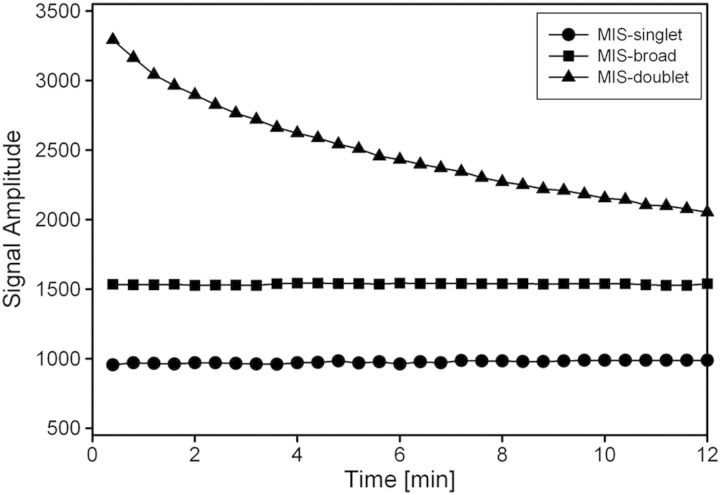
To achieve control of the MIS and RIS stabilities after harvesting a nail clipping, several modifications to the nail handling and storage procedure have been developed and implemented. These include placement of the nail clippings under a dry, inert gas, such as nitrogen or carbon dioxide, within mylar bags to reduce the water and oxygen content of the nails following harvesting. Addition of a desiccant and an oxygen scavenger to the mylar bags further assists in the reduction of water and oxygen, respectively. As is shown in Figure 3, placement of nail clippings within a mylar bag immediately after harvesting stabilised the MIS-broad and MIS-singlet and greatly reduced the decay rate of the MIS-doublet. This stabilisation provided good correlation between the three MIS spectral components (Figure 4A and B). Notably, excellent correlation was achieved between the MIS-broad and MIS-singlet signals, which is critical to the use of the MIS-broad signal as a means to indirectly measure the MIS-singlet intensity in the nail clipping spectra.
Figure 3.
Signal amplitudes of the MIS-doublet (triangle), MIS-broad (square) and MIS-singlet (circle) as a function of time after harvesting nail clippings that are then placed under an atmosphere of dry nitrogen gas. The signal amplitudes of the MIS-broad and the MIS-singlet remain constant for at least 7 d when the nail clipping is kept under nitrogen gas within the mylar storage bags (data not shown). The MIS-doublet achieves a constant positive value after 25–30 min under nitrogen and remains stable for at least 7 d.
Figure 4.
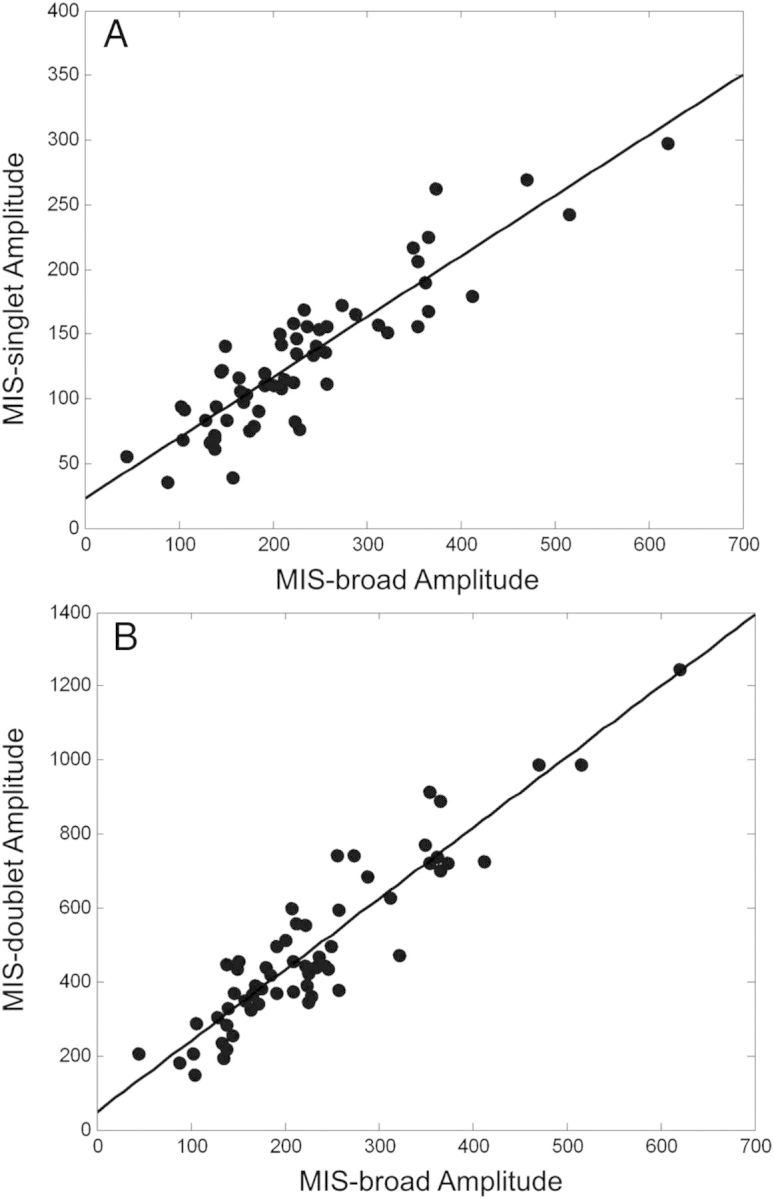
Correlation of the signal amplitudes of the MIS spectral components after 30 min under dry nitrogen in mylar bags. Good correlation is shown between the MIS-singlet and MIS-broad (A) and the MIS-doublet and MIS-broad (B) amplitudes in 60 individual nail samples.
Another factor that must be controlled in the nail clippings is a variable background signal. This signal varies in intensity depending on the treatment and storage conditions of the nail clipping(14, 18). In the nail models that were used in the validation studies of the spectral fitting model, the nail clippings were preconditioned by soaking in water, followed by drying under air or nitrogen gas, to return the nail to its original physical state and to also remove the MIS in the original harvesting cut(5, 7, 10, 18). A low-intensity background signal remained in the nail following the preconditioning, which slowly increased over a period of several days to a maximum value. This “rebound” in the background signal was greatly reduced by keeping the clipped nails in dry, inert gases (Figure 5). Therefore, by storing the nail clippings in mylar bags, the “rebound” in the background signal intensity can be controlled, thus minimizing its influence on the variability of the background signal in the sample spectral analysis.
Figure 5.
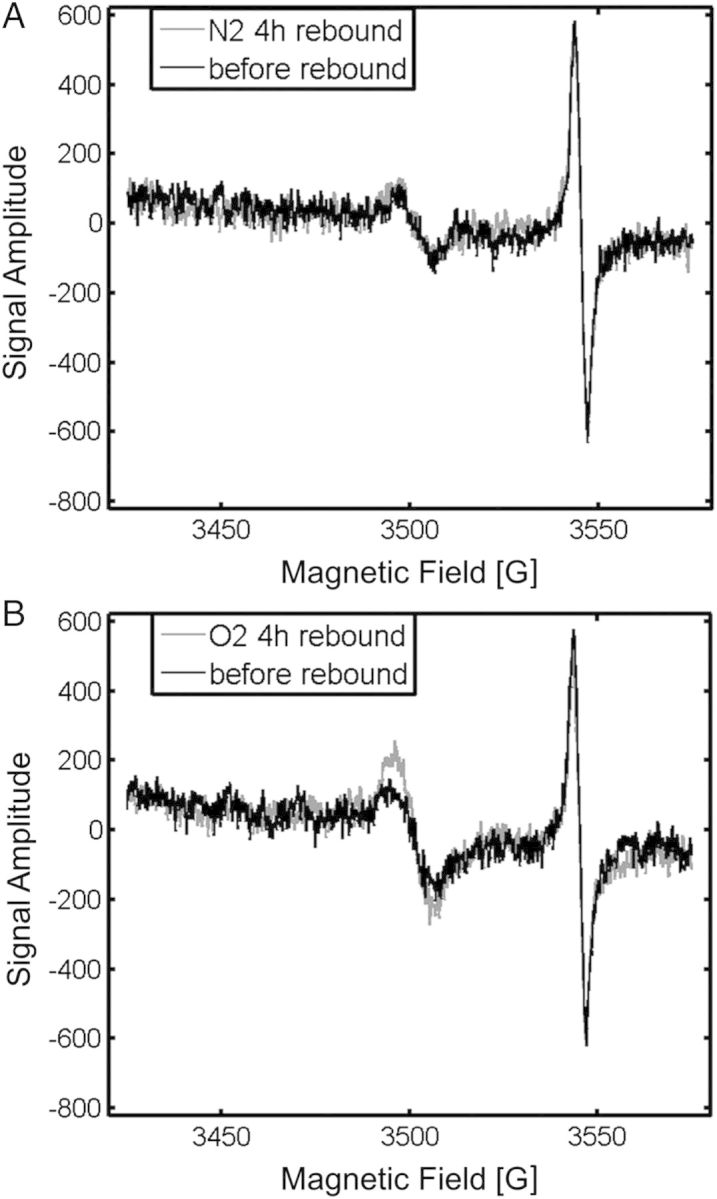
Background signal intensity in nail clippings that have been soaked in water for 20 min and then air-dried under nitrogen (A) or oxygen (B) for 4 h. Exposure of nail clippings to nitrogen after the water treatment prevents the ‘rebound’ in the background signal amplitude. The peak at 3545 G is the Bruker reference standard.
Spectral fitting model
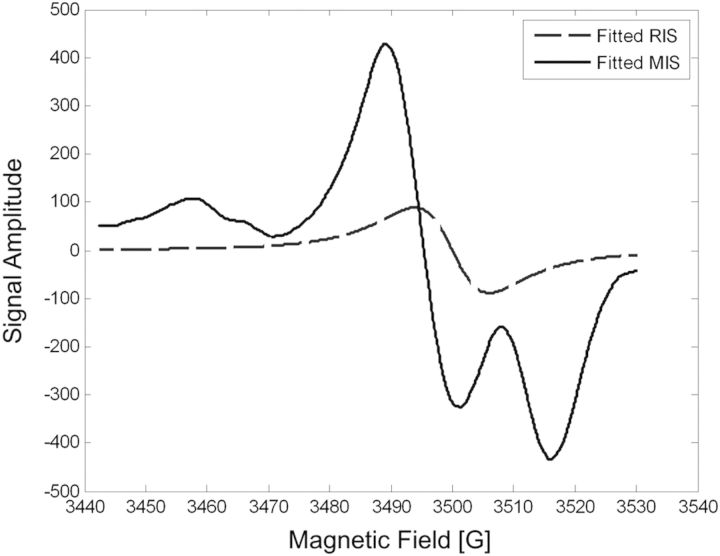
The spectral model that has been developed incorporates the three MIS signal components and the RIS. Based on the stabilities of the MIS and RIS signals that have been achieved with the nail sample-handling method described above and the consistency in the intensities of the components in the overall MIS spectrum, a composite basis spectrum can be used to model the MIS, rather than fitting the three individual MIS spectral components. Figure 6 shows the composite MIS basis spectrum that is the mean of the MIS spectra acquired from 60 individual nail samples and was used in the fitting model. The RIS basis spectrum (Figure 6) is the first derivative of a Lorentzian function, which provides a fit to the actual RIS.
Figure 6.
The basis spectra used in the two-component linear regression spectral fitting model. The MIS (solid) is the composite of the MIS-doublet, MIS-broad and MIS-singlet signals and is the average of 30 MIS spectra obtained from the post-cut spectra of the unirradiated nail samples, after subtraction of the pre-IR (background) spectrum. The RIS (hashed) is a simple Lorentzian function.
In the first test of the spectral fitting model, the two-component spectral fitting was applied to the analysis of sets of nails acquired from 15 donors, with 6 nail clippings from each donor irradiated to doses of 0–6 Gy for a total of 90 individual nail clippings. Prior to the analysis, the pre-IR EPR spectra were subtracted from the post-IR and post-cut EPR spectra for each nail clipping. This allowed a test of the spectral fitting model for the MIS and RIS spectral components without interference from the background signal and provided the amplitude of the actual RIS (from subtraction of the background spectrum from the post-IR spectrum). Because the background signal has a g-value that is virtually identical to that of the RIS, it is currently impossible to differentiate these two signals in a spectral fitting model. Therefore, the contribution of the background signal to the overall nail spectrum will be treated separately by a post-analysis adjustment that is described later.
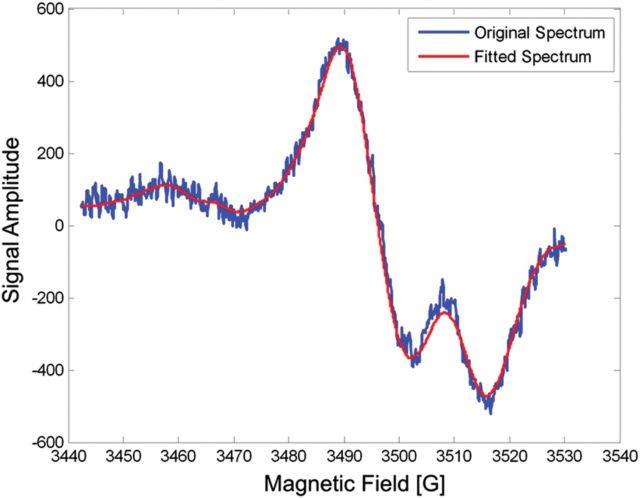
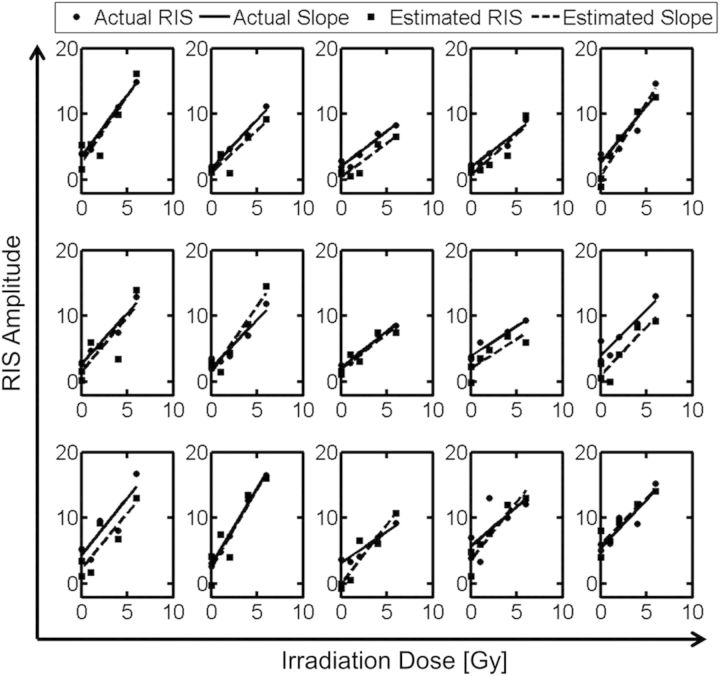
Analysis of the individual post-cut nail spectra (without background) was conducted using the two-component spectral linear, least-squares fitting model. Figure 7 demonstrates the goodness of fit of the combined MIS and RIS basis spectra to these spectra in a typical nail clipping that received a 6 Gy dose. Figure 8 shows the difference between the post-cut and fitted spectra and the absence of residual signals. This result confirms the ability of the two-component spectral model to provide an excellent fit to the experimental nail data. A comparison of the estimated RIS calculated from the fitting model to the actual RIS obtained from post-IR nail spectra (without background) in Figure 9 demonstrates good agreement between the linear dose response of the estimated and actual RIS. Therefore, the two-component model is able to accurately determine the RIS in the irradiated clipped nail spectra.
Figure 7.
Two-component fit of the MIS and RIS basis functions (red) to the post-cut spectrum of a nail clipping that received a 6 Gy dose (blue) after subtraction of the background.
Figure 8.
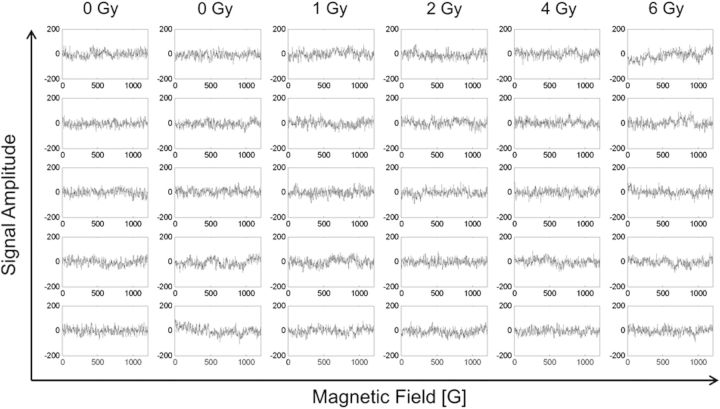
Residual spectrum after the linear regression fit of the two-component model to the post-cut spectra acquired from the six nail samples (irradiated to doses of 0, 1, 2, 4 or 6 Gy) in five donor nail sets.
Figure 9.
Comparison of the dose response of the estimated RIS (square), determined from spectral fitting and the dose response of the actual RIS (circle) in all 15-donor nail sets. The actual RIS was obtained by subtracting the pre-IR spectrum from the post-IR spectrum.
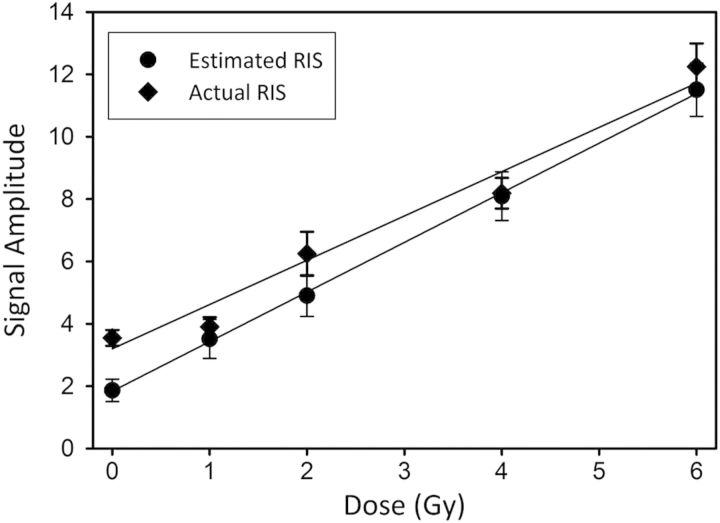
The combined dose response of the RIS in the nail sets from the 15 donors revealed a linear relationship between the mean amplitude of the estimated RIS and the radiation dose to the nail clippings (Figure 10). The slopes and intercepts calculated from a linear regression analysis of the combined dose response of the estimated RIS and actual RIS (Table 1) show that the dose response was similar for both RIS values. A receiver operating characteristic (ROC) analysis of both the estimated and actual RIS to discriminate 0 and 1 Gy from 2, 4, and 6 Gy demonstrated the predictive power of the assay, with area under the curve (AUC) values of 0.90 and 0.92, respectively (Table 1). Based on the dose-threshold recommendation for medical triage in the case of a radiation event, we utilized 2 Gy as the threshold for ROC analysis.(1, 3).
Figure 10.
Plots of the mean estimated RIS (circle) and actual RIS (diamond) amplitudes for all 15-donor nail sets calculated without the background included during the spectral fitting. The error bars represent the standard error of the mean. The lines represent the linear regression analysis of the dose response of the estimated and actual RIS amplitudes calculated for all 90 nail clipping samples.
Table 1.
Linear regression analysis of the dose response of the RIs amplitude and (SEIP) ROC analysis of the dose-response data.
| Slopea | Intercepta | AUCb | |
|---|---|---|---|
| Spectral fitting after background is subtracted | |||
| Estimated RIS | 1.59±0.12 | 1.84±0.38 | 0.90±6 |
| Actual RIS | 1.42±0.10 | 3.20±0.30 | 0.92±5 |
| Spectral fitting with background included followed by post-fitting background correction for RIS | |||
| Estimated RIS* | 1.48±0.15 | −0.15±0.48 | 0.83±9 |
| Actual RIS* | 1.61±0.16 | 1.11±0.51 | 0.87±7 |
a± 1 SE.
bAUC calculated from the ROC analysis of the estimated and actual RIS values derived from the spectral fitting of clipped nail spectra, without (RIS) or with (RIS*) background included during the spectral fitting. The error values represent 1 SD.
Although the two-component spectral fitting model accurately estimated the RIS amplitude in the clipped nail spectra, this was only accomplished by prior removal of the background signal. For the purposes of providing dose estimates from unplanned human exposure to radiation, the spectral fitting model must be applied to the analysis of clipped nail spectra that may include a background signal. Therefore, the amplitude of the RIS estimate that is calculated would include the background amplitude. Because the background and RIS overlap in the nail spectra, and also have similar power saturation properties, a spectral fitting model cannot be developed that will provide separate estimates of these two spectral components. Instead, the RIS estimate that is calculated is adjusted for the background by assuming a constant mass-dependent value in clipped nails. This assumption is based on the low variability in the background amplitude that has been measured in fingernails in another study(18).
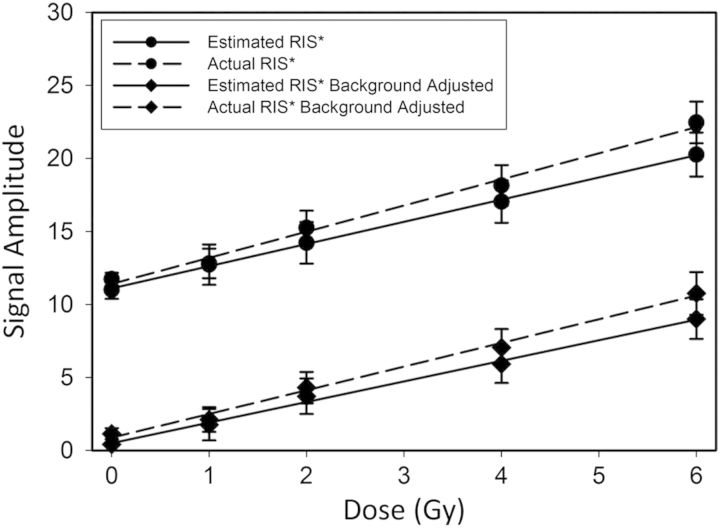
A second analysis of clipped nail spectral data acquired from a 16-donor study was conducted using the two-component fitting model, but this time including the background signal in the nail clipping spectra. As part of this analysis, a mean and standard deviation for the background amplitude of 10.5±2.3 was calculated from the average of the background amplitudes (normalised to nail mass) measured in the pre-IR spectra acquired for each of the 96 individual nail samples. Plotting the average actual and estimated RIS* amplitudes (* indicates that the actual and estimated amplitudes are a combination of the RIS and background amplitudes) across donor nail sets for each dose (Figure 11) shows dose-response relationships that are similar in slope to that obtained in the previous spectral fitting test (Figure 10). Again there is good agreement between the actual RIS* and estimated RIS* as was seen in the first test of the spectral fitting model, but with offsets that are proportional to the mean background amplitude (Table 1). Therefore, our results suggest that the background signal in nail clippings may be treated as a constant for the purposes of calculating the RIS amplitude from the combined RIS plus background amplitudes determined by spectral fitting analysis of irradiated nail clippings.
Figure 11.
Plots of the mean estimated RIS (solid lines) and actual RIS (hashed lines) amplitudes for all 16-donor nail sets with the background included during the fitting analysis but no post-fitting correction for background (circles) and with a post-fitting correction for background (diamonds). The error bars represent the standard error of the mean. The lines represent the linear regression analysis of the dose response of the estimated and actual RIS amplitudes calculated for all 96 nail clipping samples.
An ROC analysis of the data from the second analysis of the clipped nail spectra, where the estimated RIS* and actual RIS* values were corrected for background, showed a decrease in the AUC of the assay in comparison with those calculated in the 15-donor nail set (Table 1). This decreased sensitivity between the first and second of these spectral analyses was likely the result of a relatively high variability in the background (22% RSD), which would not have affected the estimated and actual RIS calculated in the 15-donor nail set data because the actual background in each nail sample was subtracted from the fingernail prior to the spectral analysis. The background measured in the 16-donor nail set was higher than the 8% reported by Reyes et al.(18). This difference may be due to the nail sample preparations used by the two groups. The longer cut edge in the nail handling here may lead to a higher background amplitude and variability if the background signal is related to the extent of the cut edge. This issue should be further explored as another step to controlling the background in clipped nails.
There are other potential sources of the background signal in nail clippings that need to be investigated. Spectral noise has a large impact on the accuracy of signal amplitude measurement, and further refinements in spectral filtering are required to reduce this influence. The composition and properties of nails differ with sex, age, race, disease state, nutrition, and other factors(21–25). These differences may also have an influence on the levels of the background signal in nails. Thus, the use of more than one background adjustment value may be required, depending on the factors that influence the level of the background signal in nails.
The stability of the RIS must also be addressed. There will likely be a delay of perhaps several days between the time of exposure in a radiation/nuclear event and the time when samples can be collected for retrospective dosimetric analysis. Studies have shown that factors such as nail water content and temperature have an effect on the stability of the RIS in nails(5, 7–10, 26). Therefore, the variation of water content in the distal extension of the in vivo nail plate under various ambient conditions should be studied to determine the kinetics of RIS decay. From this information, the amplitude of the estimated RIS that is determined from the spectral fitting model can be extrapolated back to the time of exposure(8).
CONCLUSION
The success of the ex vivo EPR nail dosimetry method where the RIS amplitude is estimated through linear regression based on spectral fitting depends on controlling the water and oxygen content of the nail following clipping. This is due to the need to control the stability of the three MIS components in the nail, thereby maintaining a consistent overall MIS spectrum. With these controls in place, good agreement has been obtained between the estimated RIS calculated from the two-component regression model and the actual RIS measured in the post-IR spectrum before the final cutting. However, the ROC analyses revealed remaining variability in both of the RIS values. A large source of this variability was due to the variability in the background signal in the nail samples. Additional studies of the factors that contribute to the background signal are needed to more accurately account for the background in the estimated RIS that is derived from the two-component spectral fitting model.
FUNDING
The work reported here is supported by a grant from NIH/NIAID (U19AI091173: Dartmouth Physically-Based Biodosimetry Center for Medical Counter measures Against Radiation).
REFERENCES
- 1.Swartz H. M., Flood A. B., Gougelet R. M., Rea M. E., Nicolalde R. J., Williams B. B. A critical assessment of biodosimetry methods for large-scale incidents. Health Phys. 2010;98:95–108. doi: 10.1097/HP.0b013e3181b8cffd. [DOI] [PMC free article] [PubMed] [Google Scholar]
- 2.González A. J. Lauriston S. Taylor lecture: radiation protection in the aftermath of a terrorist attack involving exposure to ionizing radiation. Health Phys. 2005;89:418–446. doi: 10.1097/01.hp.0000179340.57348.26. [DOI] [PubMed] [Google Scholar]
- 3.Flood A. B., Bhattacharyya S., Nicolalde R. J., Swartz H. M. Implementing EPR dosimetry for life-threatening incidents: factors beyond technical performance. Radiat. Meas. 2007;42:1099–1109. doi: 10.1016/j.radmeas.2007.05.042. [DOI] [PMC free article] [PubMed] [Google Scholar]
- 4.Trompier F., Bassinet C., Della Monaca S., Romanyukha A., Reyes R., Clairand I. Overview of physical and biophysical techniques for accident dosimetry. Radiat. Prot. Dosim. 2011;144:571–574. doi: 10.1093/rpd/ncq341. [DOI] [PubMed] [Google Scholar]
- 5.He X., Gui J., Matthews T. P., Williams B. B., Swarts S. G., Grinberg O., Sidabras J., Wilcox D. E., Swartz H. M. Advances towards using finger/toenail dosimetry to triage a large population after potential exposure to ionizing radiation. Radiat. Meas. 2011;46:882–887. doi: 10.1016/j.radmeas.2011.05.016. [DOI] [PMC free article] [PubMed] [Google Scholar]
- 6.Flood A. B., Nicolalde R. J., Demidenko E., Williams B. B., Shapiro A., Wiley A. L., Jr, Swartz H. M. A framework for comparative evaluation of dosimetric methods to triage a large population following a radiological event. Radiat. Meas. 2011;46:916–922. doi: 10.1016/j.radmeas.2011.02.019. [DOI] [PMC free article] [PubMed] [Google Scholar]
- 7.Wilcox D. E., He X., Gui J., Ruuge A. E., Li H., Williams B. B., Swartz H. M. Dosimetry based on EPR spectral analysis of fingernail clippings. Health Phys. 2010;98:309–317. doi: 10.1097/HP.0b013e3181b27502. [DOI] [PMC free article] [PubMed] [Google Scholar]
- 8.Trompier F., Kornak L., Calas C., Romanyukha A., Leblanc B., Mitchell C. A., Swartz H. M., Clairand I. Protocol for emergency EPR dosimetry in fingernails. Radiat. Meas. 2007;42:1085–1088. doi: 10.1016/j.radmeas.2007.05.024. [DOI] [PMC free article] [PubMed] [Google Scholar]
- 9.Trompier F., Bassinet C., Wieser A., De Angelis C., Viscomi D., Fattibene P. Radiation-induced signals analysed by EPR spectrometry applied to fortuitous dosimetry. Ann. Ist. Super. Sanita. 2009;45:287–296. [PubMed] [Google Scholar]
- 10.Black P. J., Swarts S. G. Ex vivo analysis of irradiated fingernails: chemical yields and properties of radiation-induced and mechanically-induced radicals. Health Phys. 2010;98:301–308. doi: 10.1097/HP.0b013e3181b0c045. [DOI] [PMC free article] [PubMed] [Google Scholar]
- 11.Symons M. C. R., Chandra H., Wyatt J. L. Electron paramagnetic resonance spectra of irradiated finger nails: a possible measure of accidental exposure. Radiat. Prot. Dosim. 1995;58:11–15. [Google Scholar]
- 12.Romanyukha A., Trompier F., Leblanc B., Calas C., Clairand I., Mitchell C. A., Smirniotopoulos J. G., Swartz H. M. EPR dosimetry in chemically treated fingernails. Radiat. Meas. 2007;42:1110–1113. doi: 10.1016/j.radmeas.2007.05.026. [DOI] [PMC free article] [PubMed] [Google Scholar]
- 13.Reyes R. A., Romanyukha A., Olsen C., Trompier F., Benevides L. A. Electron paramagnetic resonance in irradiated fingernails: variability of dose dependence and possibilities of initial dose assessment. Radiat. Environ. Biophys. 2009;48:295–310. doi: 10.1007/s00411-009-0232-1. [DOI] [PubMed] [Google Scholar]
- 14.Reyes R. A., Trompier F., Romanyukha A. Study of the stability of EPR signals after irradiation of fingernail samples. Health Phys. 2012;103:175–180. doi: 10.1097/HP.0b013e31824ac338. [DOI] [PubMed] [Google Scholar]
- 15.Swartz H. M., et al. Electron paramagnetic resonance dosimetry for a large-scale radiation incident. Health Phys. 2012;103:255–267. doi: 10.1097/HP.0b013e3182588d92. [DOI] [PMC free article] [PubMed] [Google Scholar]
- 16.Swartz H. M., et al. In vivo EPR for dosimetry. Radiat. Meas. 2007;42:1075–1084. doi: 10.1016/j.radmeas.2007.05.023. [DOI] [PMC free article] [PubMed] [Google Scholar]
- 17.Romanyukha A., Reyes R. A., Trompier F., Benevides L. A. Fingernail dosimetry: current status and perspectives. Health Phys. 2010;98:296–300. doi: 10.1097/01.HP.0000347999.01948.74. [DOI] [PubMed] [Google Scholar]
- 18.Reyes R. A., Romanyukha A., Trompier F., Mitchell C. A., Clairand I., De T., Benevides L. A., Swartz H. M. Electron paramagnetic resonance in human fingernails: the sponge model implication. Radiat. Environ. Biophys. 2008;47:515–526. doi: 10.1007/s00411-008-0178-8. [DOI] [PubMed] [Google Scholar]
- 19.Chandra H., Symons M. C. Sulphur radicals formed by cutting alpha-keratin. Nature. 1987;328:833–834. doi: 10.1038/328833a0. [DOI] [PubMed] [Google Scholar]
- 20.Williams B. B., Dong R., Kmiec M., Burke G., Demidenko E., Gladstone D., Nicolalde R. J., Sucheta A., Lesniewski P., Swartz H. M. Development of in vivo tooth EPR for individual radiation dose estimation and screening. Health Phys. 2010;98:327–338. doi: 10.1097/HP.0b013e3181a6de5d. [DOI] [PMC free article] [PubMed] [Google Scholar]
- 21.Hossein-nezhad A., Sadeghi Afjeh M., Saghafi H., Rahmani M., Parviz M., Maghbooli Zh., Larijani B. The fingernail protein content may predict bone turnover in postmenopausal women. Iran. J. Public Health. 2008;37:55–62. (1) [Google Scholar]
- 22.Rich P. Nail changes due to diabetes and other endocrinopathies. Dermatol. Ther. 2002;15:107–110. [Google Scholar]
- 23.Towler M. R., Wren A., Rushe N., Saunders J., Cummins N. M., Jakeman P. M. Raman spectroscopy of the human nail: a potential tool for evaluating bone health? J. Mater. Sci.: Mater. Med. 2007;18:759–763. doi: 10.1007/s10856-006-0018-9. [DOI] [PubMed] [Google Scholar]
- 24.De Berker D. A. R., André J., Baran R. Nail biology and nail science. Int. J. Cosmet. Sci. 2007;29:241–275. doi: 10.1111/j.1467-2494.2007.00372.x. [DOI] [PubMed] [Google Scholar]
- 25.Dittmar M., Dindorf W., Banerjee A. Organic elemental composition in fingernail plates varies between sexes and changes with increasing age in healthy humans. Gerontology. 2008;54:100–105. doi: 10.1159/000128269. [DOI] [PubMed] [Google Scholar]
- 26.Dalgarno B. G., McClymont J. D. Evaluation of ESR as a radiation accident dosimetry technique. Appl. Radiat. Isot. 1989;40:1013–1020. [Google Scholar]


