

Abstract
Accelerated molecular dynamics (aMD) simulations greatly improve the efficiency of conventional molecular dynamics (cMD) for sampling biomolecular conformations, but they require proper reweighting for free energy calculation. In this work, we systematically compare the accuracy of different reweighting algorithms including the exponential average, Maclaurin series, and cumulant expansion on three model systems: alanine dipeptide, chignolin, and Trp-cage. Exponential average reweighting can recover the original free energy profiles easily only when the distribution of the boost potential is narrow (e.g., the range ≤20kBT) as found in dihedral-boost aMD simulation of alanine dipeptide. In dual-boost aMD simulations of the studied systems, exponential average generally leads to high energetic fluctuations, largely due to the fact that the Boltzmann reweighting factors are dominated by a very few high boost potential frames. In comparison, reweighting based on Maclaurin series expansion (equivalent to cumulant expansion on the first order) greatly suppresses the energetic noise but often gives incorrect energy minimum positions and significant errors at the energy barriers (∼2–3kBT). Finally, reweighting using cumulant expansion to the second order is able to recover the most accurate free energy profiles within statistical errors of ∼kBT, particularly when the distribution of the boost potential exhibits low anharmonicity (i.e., near-Gaussian distribution), and should be of wide applicability. A toolkit of Python scripts for aMD reweighting “PyReweighting” is distributed free of charge at http://mccammon.ucsd.edu/computing/amdReweighting/.
Introduction
Accelerated molecular dynamics (aMD) is an enhanced sampling technique that works by flattening the molecular potential energy surface, often by adding a non-negative boost potential when the system potential is lower than a reference energy. The boost potential, ΔV decreases the energy barriers and thus accelerates transitions between different low-energy states.1 With this, aMD is able to sample distinct biomolecular conformations and rare barrier-crossing events that are not accessible to conventional molecular dynamics (cMD) simulations. AMD has been successfully applied to a number of biological systems2 and hundreds-of-nanosecond aMD simulations have been shown to capture millisecond-time scale events in both globular and membrane proteins, such as the bovine pancreatic trypsin inhibitor (BPTI)3 and a G-protein coupled receptor (GPCR).4
In addition to enhanced conformational sampling, it is appealing to reweight aMD simulations to recover the original free energy landscapes of functional biomolecules. In theory, frames of aMD simulations can be reweighted by the Boltzmann factors of the corresponding boost potential (i.e., eΔV/kBT) and averaged over each bin of selected reaction coordinate(s) to obtain the canonical ensemble, an algorithm termed “exponential average” here. However, exponential reweighting is known to suffer from large statistical noise in practical calculations5 because the Boltzmann reweighting factors are often dominated by a very few frames with high boost potential.
In an effort to avoid the energetic noise, scaled molecular dynamics (scaled MD) has been developed to flatten the biomolecular potential energy surface using a single scaling factor, enabling population-based reweighting and significantly improving the reweighted free energy profiles as demonstrated on alanine dipeptide and chignolin.5d While scaled MD provides a great advantage for simulation reweighting, it scales the system potential uniformly and does not allow selective acceleration of biomolecular conformational changes as does aMD, for example, applying boost potential to protein dihedrals only1a or subdomains of a protein.6 Moreover, small numerical errors can also occur in the reweighting of scaled MD simulations and are the subject of an ongoing study.
AMD has also been combined with replica exchange (i.e., REXAMD) for optimal conformational sampling and free energy calculations of protein–ligand binding.7 REXAMD provides an approach to calculate the free energy directly from the simulation replica with zero boost potential (i.e., unaccelerated).7c However, it has been shown that including statistics collected from accelerated runs can improve the final reweighted free energies.7b Moreover, REXAMD can be challenging in practice, as the optimal acceleration parameters for each replica are a priori not known. Thus, accurate reweighting of aMD simulations is still of key interest for free energy calculations. Such need also emerges in using aMD enhanced sampling simulations to build Markov state models.8
Importantly, aMD does not require any predefined reaction coordinate(s), unlike other biased free energy calculation methods, including the umbrella sampling,9 metadynamics,10 adaptive biasing force (ABF) calculations,11 and orthogonal space sampling.12 Thus, aMD can be advantageous for exploring the biomolecular conformational space without a priori knowledge or restraints and calculating the system free energy landscape through postsimulation analysis. However, the biasing potential applied in aMD simulations is on the order of tens to hundreds of kcal/mol, which is much greater in magnitude and wider in distribution than that of other biasing simulation methods that make use of predefined reaction coordinates (e.g., several kcal/mol). This leads to grand challenge for accurate reweighting of aMD simulations. A thorough analysis of the advantages and disadvantages of different algorithms for aMD reweighting is still lacking. Open questions include how to effectively suppress the energetic noise encountered in exponential reweighting, and what are the limiting parameters for accurate reweighting of aMD simulations in terms of system size and levels of acceleration. Note that the reweighting algorithms discussed in this study shall be applicable to all biasing simulation methods for recovering the original free energy profiles.
In previous aMD studies of proteins, Maclaurin series expansion was applied to approximate the exponential term eΔV/kBT and it was found less noisy than the exponential reweighting.3 Furthermore, Shen and Hamelberg showed that cumulant expansion effectively smoothed the free energy profiles of alanine dipeptide obtained from aMD simulations.5a Cumulant expansion has also been widely used in free energy calculations of biomolecules in nonequilibrium simulations based on the Jarzynski’s equality,13 for example, fast-growth thermodynamic integration14 and steered molecular dynamics.15 Particularly, when the boost potential or its equivalent follows Gaussian distribution, the cumulant expansion to the second order is exact for calculating the average of exponentials. This has been known as “Gaussian fluctuation approximation” and applied to calculate electrostatic free energies of solutes in solution.16
Here, reweighting algorithms including the exponential average, Maclaurin series, and cumulant expansion are compared systematically for analyzing aMD simulations of three extensively studied biomolecular model systems, that is, alanine dipeptide, chignolin, and Trp-cage. The latter two are known to be fast-folding proteins.17 The distributions of boost potential applied in the aMD simulations are analyzed in detail to address the limiting parameters for accurate aMD reweighting.
Methods
Accelerated Molecular Dynamics
Accelerated molecular dynamics (aMD) enhances the conformational sampling of biomolecules, often by adding a non-negative boost potential to the system when the system potential is lower than a reference energy:1,5b
| 1 |
where V(r) is the original potential, E is the reference energy, and V*(r) is the modified potential. In the simplest form, the boost potential, ΔV(r) is given by
| 2 |
where α is the acceleration factor. As the acceleration factor α decreases, the energy surface is flattened more and biomolecular transitions between the low-energy states are increased.
Two versions of aMD that provide different acceleration levels of biomolecules are termed “dihedral-boost”1a and “dual-boost”.1b In dihedral-boost aMD, boost potential is applied to all dihedrals in the system with input parameters (Edihed, αdihed). In dual-boost aMD, a total boost potential is applied to all atoms in the system in addition to the dihedral boost (i.e., Edihed, αdihed; Etotal, αtotal). Previous applications have suggested the following parameters for proper acceleration of conformational changes in globular proteins3 and they are used in this study of alanine dipeptide, chignolin and Trp-cage
| 3 |
where Nres is number of protein residues, Natoms is the total number of atoms, and Vdihed_avg and Vtotal_avg are the average dihedral and total potential energies calculated from short cMD simulations, respectively.
Energetic Reweighting
For an aMD simulation of a N-atom biomolecular system, the probability distribution along a selected reaction coordinate(s) A(r) is written as p*(A), where r denotes the atomic positions {r1,···,rN}. Given the boost potential ΔV(r) of each frame, p*(A) can be reweighted to recover the canonical ensemble distribution, p(A), as
| 4 |
where M is the number of bins, β = 1/kBT and ⟨eβΔV(r)⟩j is the ensemble-averaged Boltzmann factor of ΔV(r) for simulation frames found in the jth bin. The above equation provides an “exponential average” algorithm for reweighting of aMD simulations. As the Boltzmann reweighting factors are often dominated by high boost potential frames, the distribution of ΔV is characterized by its standard deviation σΔV and the range δΔV=ΔVmax – ΔVmin. The reweighted potential of mean force (PMF) is calculated as F(Aj) =–(1/β) ln p(Aj).
Furthermore, the exponential term can be approximated by summation of the Maclaurin series of boost potential ΔV(r) with the reweighting factor rewritten as
| 5 |
where the subscript j has been suppressed. The Maclaurin series expansion up to the 5th–10th order has been used in practice to reweight aMD trajectories.3 The reweighted PMF profiles are typically less noisy than those obtained from exponential average reweighting.
Finally, the ensemble-averaged reweighting factor can also be approximated using cumulant expansion:14,18
| 6 |
where the first three cumulants are given by
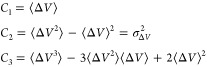 |
7 |
The free energy can then be derived from cumulant expansion as
| 8 |
where F*(Aj) is the modified free energy surface sampled in the aMD simulation and the constant Fc = (1/β) ln Σj = 1M⟨eβΔV(r)⟩j.
In principle, reweighting using cumulant expansion is able to greatly suppress the energetic noise, since it collectively reweights many data points along the chosen reaction coordinate(s). Note that the Maclaruin series expansion is equivalent to cumulant expansion on the first order:
| 9 |
When the distribution of boost potential ΔV within a bin satisfies the Gaussian distribution, cumulant expansion to the second order provides an accurate approximation of the exponential reweighting factor. In this study, we introduce a quantity called “anharmonicity”,19 γ to characterize the distribution of aMD boost potential as follows. Given ΔV for frames found in one bin of the selected reaction coordinate(s), the normalized probability distribution can be obtained p(ΔV) and its entropy is calculated as
| 10 |
Assuming ΔV satisfies exactly Gaussian distribution, for which the boost potential achieves perfect sampling, its maximum entropy is given by
| 11 |
where σ is the standard deviation of the ΔV distribution. Then, the distribution anharmonicity, γ of boost potential ΔV is obtained as
| 12 |
When γ is zero, the boost potential follows ideal Gaussian distribution and cumulant expansion to the second order is expected to provide accurate reweighted free energy profiles. As γ increases, the ΔV distribution becomes less harmonic and the reweighted PMF obtained from cumulant expansion to the second order deviates from the original free energy profile. Thus, γ serves as an effective indicator of aMD reweighting accuracy using cumulant expansion to the second order.
Simulation Protocols
All cMD and aMD simulations of alanine dipeptide, chignolin, and Trp-cage were performed using AMBER with the ff99SB force field on GPUs20 using the SPFP precision model.21 The simulated systems were built using the Xleap module of the AMBER package. Alanine dipeptide and chignolin were constructed as described previously.5d For Trp-cage, the amino acid sequence was obtained from the PDB code 2JOF(22) and an extended polypeptide was built as the starting structure. By solvating the structures in a TIP3P23 water box that extends 8 to 10 Å from the solute surface, the alanine dipeptide system contained 630 water molecules, 2211 waters for chignolin, and 11 355 waters for Trp-cage. The total number of atoms in the three systems are 1912, 6773, and 34 370 for alanine dipeptide, chignolin, and Trp-cage, respectively (Table 1).
Table 1. Biomolecular Model Systems Simulated with Accelerated Molecular Dynamics (aMD) in the Present Studya.
| system | Nres | Natoms | cMD | aMD | dihedral/dual-boost | ΔVavg (kcal/mol) | σΔV (kcal/mol) | δΔV (kcal/mol) |
|---|---|---|---|---|---|---|---|---|
| alanine dipeptide | 2 | 1912 | 1000 ns | 20 ns × 5 | dihedral-boost | 3.1 | 1.8 | 11.7 |
| 20 ns × 5, 1000 ns | dual-boost | 4.2 | 2.1 | 18.5 | ||||
| chignolin | 10 | 6773 | 1000 ns × 2 | 300 ns × 3 | dual-boost | 8.5 | 3.2 | 31.9 |
| Trp-cage | 20 | 34 370 | 1000 ns × 2 | 500 ns × 4 | dual-boost | 38.8 | 7.0 | 70.8 |
Nres and Natoms are the number of residues and system atoms, respectively. ΔVavg, σΔV, and δΔV are the average, standard deviation, and range (maximum–minimum) of the aMD boost potential, ΔV.
In AMBER simulations of the three systems, bonds containing hydrogen atoms were restrained with the SHAKE algorithm24 and thus a 2 fs time step was used. Weak coupling to an external temperature and pressure bath was used to control both temperature and pressure.25 The electrostatic interactions were calculated using the PME (particle mesh Ewald summation)26 with a cutoff of 8.0 Å for long-range interactions.
The three systems were initially minimized for 2000 steps using the conjugate gradient minimization algorithm and then the solvent was equilibrated for 50 ps in isothermal–isobaric (NPT) ensemble with the solute atoms fixed. Another minimization was performed with all atoms free and the systems were slowly heated to 300 K over 500 ps. Final system equilibration was achieved by a 200 ps isothermal–isovolumetric (NVT) and 400 ps NPT run to ensure that the water box of simulated systems had reached the appropriate density. Then, production simulations were performed in the NVT ensemble. The aMD acceleration parameters were calculated using the first 100 ns cMD simulation of each system.
For alanine dipeptide, one 1000 ns cMD simulation and five independent 20 ns dihedral-boost and dual-boost aMD simulations were obtained for calculating free energies. One of the five dual-boost aMD simulations was also extended to 1000 ns as a converged reference. For chignolin, two independent 1000 ns cMD simulations and three independent 300 ns dual-boost aMD simulations were compared. For Trp-cage, two independent 1000 ns cMD simulations and four independent 500 ns dual-boost aMD simulations were obtained for comparison. The simulation frames were saved every 0.2 ps for trajectory analysis. A summary of the simulations is listed in Table 1.
PMF profiles were calculated for backbone dihedrals Φ and Ψ in alanine dipeptide, Φ4 and Ψ4 for Pro4 in chignolin, and Φ12 and Ψ12 for Pro12 in Trp-cage. Two-dimensional PMF profiles of (Φ, Ψ) in alanine dipeptide were also analyzed. In case of multiple independent cMD/aMD simulations, PMF profiles obtained by averaging the independent runs were used. Calculations using five different bin sizes 3, 6, 9, 12, and 15 for backbone dihedrals in alanine dipeptide (Supporting Information Figure S1) showed that when the bin size is 3, the number of sampling points can be smaller than 10 with no converged free energy values for several bins in the energy barrier region at Φ = 0° (see Supporting Information Figure S1A). As the bin size is increased to 6 or above, the free energy profiles exhibit slight variations. Furthermore, with increasing bin size the anharmonicity is found to decrease monotonically (Supporting Information Figures S1C and S1D), because of the fact that more data points with similar distribution width are collected in each bin. Therefore, a bin size of 6 is selected to balance between reducing the anharmonicity and increasing the bin resolution. When the number of simulation frames within a bin is lower than a certain limit (i.e., cutoff), the bin is not sufficiently sampled and thus excluded for reweighing. The cutoff can be determined by iteratively increasing it until the minimum position of the PMF profile does not change. The final cutoff was set as 10, 50, and 500 for reweighting of aMD simulations on alanine dipeptide, chignolin, and Trp-cage, respectively.
For Chignolin and Trp-cage, the root-mean-square deviation (RMSD) of the protein Cα atoms relative to the experimentally determined folded structure were calculated from each cMD simulation and plotted in Supporting Information Figure S6. Folding of the two proteins were observed in all the presented simulations with RMSD decreased to ∼2 Å. This justifies that conformations of the two fast-folding proteins are well sampled. Furthermore, averaging of the two independent cMD runs for each system is presented. The error bars provide an estimate of the simulation accuracy. The RMSD plots for aMD simulations of both Chignolin and Trp-cage are obtained as well in the Supporting Information Figure S7, depicting more frequent folding of the two fast-folding proteins. AMBER trajectories were analyzed using the ptraj tool. A toolkit of Python scripts “PyReweighting” was used to reweight the aMD simulations to calculate both 1D and 2D free energy profiles.
Results and Discussion
Using exponential average, Maclaurin series and cumulant expansion, reweighting of aMD simulations yields PMF profiles of backbone dihedrals Φ and Ψ in alanine dipeptide, Φ4 and Ψ4 for Pro4 in chignolin, and Φ12 and Ψ12 for Pro12 in Trp-cage. The two proline residues in chignolin and Trp-cage are located in the middle region of the protein chain and conformational changes in their backbone dihedrals have been suggested to play a key role in the protein folding.17 The reweighted PMF profiles of aMD simulations are compared with those of long-time scale cMD simulations to examine accuracy of the three different aMD reweighting algorithms.
Alanine Dipeptide
The PMF profiles of backbone dihedrals Φ and Ψ in alanine dipeptide (Figure 1A) obtained by reweighting five independent 20 ns dihedral-boost and dual-boost aMD simulations are compared with those of a 1000 ns cMD simulation. In the dihedral-boost aMD simulations, the boost potential, ΔV has an average of 3.1 kcal/mol, which is lower than that of the dual-boost aMD (4.2 kcal/mol). Furthermore, the normalized distribution of ΔV is not symmetric with the left wing truncated at 0 kcal/mol and right wing stretched to 11.7 kcal/mol (Figure 1B). Due to shift of ΔV to higher values, the left wing of the ΔV distribution is less truncated in dual-boost aMD simulations than in the dihedral-boost aMD. The standard deviation of ΔV in dual-boost aMD is 2.1 kcal/mol, which is slightly higher than that of dihedral-boost aMD (1.8 kcal/mol).
Figure 1.

(A) Scheme representation of backbone dihedrals Φ and Ψ in alanine dipeptide. (B) The probability distribution of boost potential ΔV obtained from five independent 20 ns dihedral-boost aMD (aMD) and dual-boost aMD (aMD_DB) simulations.
In the dihedral-boost aMD simulations, the distribution of ΔV is narrow with a range δΔV ≤ 12 kcal/mol (20kBT). Exponential average reweighting is able to recover the original free energy profiles of Φ (Figure 2A) and Ψ (Figure 2B) as obtained from 1000 ns cMD simulation, except that one local energy well of Φ centered at 48° is increased by ∼1 kcal/mol, suggesting insufficient sampling of this region with dihedral-boost aMD. Using Maclaurin series expansion to the 10th order, the reweighted PMF profiles differs most in Ψ with position of the energy minimum shifted from 0° to 24° and the energy barriers lowered by ∼1 kcal/mol (Figure 2D), as well as in Φ with the −72° energy minimum lowered by ∼0.5 kcal/mol (Figure 2C). With cumulant expansion, reweighting on the first order that is equivalent to Maclaurin series expansion produces lower PMF with incorrect minimum positions, while expansion up to the third order overestimates the PMF values relative to the energy minimum in both Φ (Figure 2E) and Ψ (Figure 2F). In comparison, cumulant expansion to the second order provides the closest PMF in Φ with two energy wells centered at −150° and −72° accurately reproduced, but PMF of the 48° local energy well exhibits significant increase similar to that of the exponential average reweighting (Figure 2E). Moreover, the second-order cumulant expansion overestimates energy barriers of Ψ by ∼1 kcal/mol at both −120° and 90° as shown in Figure 2F.
Figure 2.

Free energy profiles of backbone dihedrals Φ and Ψ in alanine dipeptide calculated by reweighting five independent 20 ns dihedral-boost aMD simulations using (A, B) exponential average, (C, D) Maclaurin series expansion to the 10th order, (E, F) cumulant expansion to the 1st, 2nd, and 3rd orders. The free energy profiles obtained from a 1000 ns cMD simulation are also plotted for comparison.
In dual-boost aMD simulations, exponential average reweighting leads to significantly overestimated PMF with incorrect minimum positions and high fluctuations in both Φ and Ψ (Figures 3A and B). This originates from the fact that the Boltzmann reweighting factors are dominated by a few high boost potential frames (ΔV– ΔVmin = ∼12–18 kcal/mol as shown in Figure 1B). Using Maclaurin series expansion to the 10th order (cumulant expansion on the first order), the reweighted PMF profiles are less noisy, but they do not reproduce the accurate energy minimum values in Φ (Figure 3C) or the original minimum position in Ψ (Figure 3D), and the energy barriers are underestimated by ∼1–2 kcal/mol. In contrast, while cumulant expansion to the third order still leads to deviated PMF profiles, expansion to the second order recovers the most accurate PMF profiles with negligible fluctuations that agree excellently with the original obtained from 1000 ns cMD simulation (Figures 3E and F). Reweighting of a converged 1000 ns dual-boost aMD simulation leads to closely similar results, as shown in Supporting Information Figure S3.
Figure 3.

Free energy profiles of backbone dihedrals Φ and Ψ in alanine dipeptide calculated by reweighting five independent 20 ns dual-boost aMD simulations using (A, B) exponential average, (C, D) Maclaurin series expansion to the 10th order, (E, F) cumulant expansion to the 1st, 2nd, and 3rd orders. The profiles are plotted similarly as in Figure 2.
Next, we analyze the distribution anharmonicity, γ of ΔV for aMD trajectory frames found in each 6°-bin of Φ and Ψ (see details in Methods). In the region of 0°–90° for Φ, the anharmonicity γ of the dihedral-boost aMD simulations is significantly higher than that of the dual-boost aMD (Figure 4A). This justifies the finding that less accurate PMF profiles are obtained from dihedral-boost aMD simulations using cumulant expansion to the second order than from the dual-boost aMD. Moreover, in the two regions of Ψ energy barriers at −120° and 90° (especially the central barrier at −120°), dihedral-boost aMD exhibits marked higher anharmonicity (Figure 4B), which appears as an indicator of incorrectly reweighted PMF in these regions as shown in Figure 2F. Overall, γ is close to zero in most regions of Φ and Ψ except the energy barriers in the dual-boost aMD simulations. ΔV satisfies near-Gaussian distribution in these regions, for which sufficient conformational sampling is achieved and highly accurate PMF is recovered through cumulant expansion to the second order.
Figure 4.
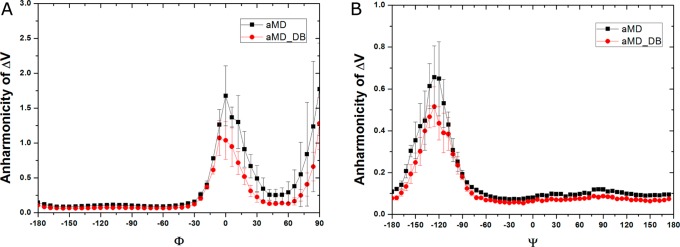
Distribution anharmonicity of boost potential ΔV of frames found in each bin of (A) Φ and (B) Ψ in the dihedral-boost aMD (aMD) and dual-boost aMD (aMD_DB) simulations of alanine dipeptide.
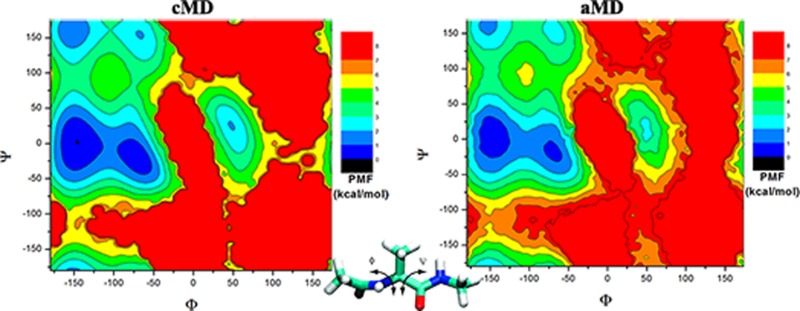
The two-dimensional PMF profiles of (Φ, Ψ) in alanine dipeptide are presented in Figure 5. From the 1000 ns cMD simulation, the global energy minimum is identified at (−150°, 0°) and another four local minima at (−78°, −6°), (−150°, 156°), (−66°, 150°), and (48°, 30°) (see Figure 5A). In comparison, the exponential average reweighting produces highly fluctuating PMF with large magnitudes of 20–40 kcal/mol in the 20 ns dual-boost aMD simulation (Supporting Information Figure S4A), even in the converged 1000 ns aMD simulation (Supporting Information Figure S4B). For reweighted PMF profiles using Maclaurin series and cumulant expansion, because the 20 ns dual-boost aMD simulation appears to lack converged sampling, as shown in Supporting Information Figure S5, results obtained from the 1000 ns aMD simulation are presented in Figure 5. With Maclaurin series expansion to the 10th order, the reweighted PMF profile agrees reasonably well with the original in the overall shape, but it differs most in the relative PMF values and the global minimum is incorrectly predicted at (−72°, −60°) as shown in Figure 5B. The calculated root-mean-square error (RMSE) is 1.24 kcal/mol. In contrast, using cumulant expansion to the second order, the global minimum is correctly reproduced at (−150°, 0°), similarly for the other four local energy minima (Figure 5C). The reweighted PMF profile is closely similar to the original with RMSE of 0.68 kcal/mol. Figure 5D plots the anharmonicity of ΔV distribution in each bin of (Φ, Ψ) in the 1000 ns dual-boost aMD simulations. Low anharmonicity values (typically <0.1) are found in the sampled conformational space except the energy barrier regions, which again justifies the accurate aMD reweighting using cumulant expansion to the second order.
Figure 5.

Two-dimensional free energy profiles of backbone dihedrals (Φ, Ψ) in alanine dipeptide calculated from (A) 1000 ns cMD simulation and reweighting of 1000 ns dual-boost aMD simulation using (B) Maclaurin series to the 10th order and (C) cumulant expansion to the 2nd order. (D) The distribution anharmonicity of ΔV of frames found in each bin of (Φ, Ψ) in the 1000 ns dual-boost aMD simulation.
In summary, exponential average reweighting is accurate only when distribution of the boost potential is narrow with the range δΔV ≤ 20kBT as found in dihedral-boost aMD simulation of alanine dipeptide. This is consistent with many previous aMD studies.1a,5a,27 However, conformational changes of biomolecules can be limited by slow diffusion of the surrounding solvent molecules. Thus, dual-boost aMD has been developed to accelerate the dihedral transitions and slow diffusive motions concurrently.1b While dual-boost aMD provides acceleration at a higher level and greatly improves the conformational sampling,2b,4a boost potential of much wider distribution is applied in the simulations (see Figure 1B and Table 1). In this case, the exponential reweighting generally leads to high energetic noise because the Boltzmann reweighting factors are dominated by a few high boost potential frames. Although the Maclaurin series expansion greatly helps suppressing the energetic noise with the distribution range of the reweighting factors reduced by ∼5 orders of magnitude (see Supporting Information Figure S2A), it often misses reproducing the correct energy minimum positions and the PMF errors can be as large as ∼2–3kBT. The large noise of aMD reweighting factors can be suppressed using cumulant expansion as well (Supporting Information Figure S2B). When distribution of the boost potential exhibits low anharmonicity, reweighting using cumulant expansion to the second order is able to recover highly accurate free energy profiles within the statistical errors of ∼kBT. Using cumulant expansion to the third order, the reweighted PMF profiles are rather deviated from the original even in the converged 1000 ns dual-boost aMD simulation (Supporting Information Figures S3E, F), largely due to propagation of small errors in the estimates of the third order cumulants.
Chignolin and Trp-cage
Apart from the alanine dipeptide, reweighting of aMD simulations is further analyzed on two fast-folding proteins (chignolin and Trp-cage) as compared with 1000 ns reference cMD simulations (see Methods). Particularly, free energy profiles are calculated for backbone dihedrals of Pro4 in chignolin (Φ4 and Ψ4 in Figure 6A) and Pro12 in Trp-cage (Φ12 and Ψ12 in Figure 6C). With increasing system size, higher boost potential ΔV is applied in aMD simulations of chignolin and Trp-cage than in the alanine dipeptide simulations (Table 1). For chignolin, the ΔV has an average of 8.5 kcal/mol with 3.2 kcal/mol standard deviation, exhibiting a wide distribution from 0 to 31.9 kcal/mol (Figure 6B). For Trp-cage, the ΔV is further increased to an average of 38.8 kcal/mol with a broad distribution (σΔV =7.0 kcal/mol), ranging from 13.6 to 80.1 kcal/mol (Figure 6D).
Figure 6.

Chignolin: (A) scheme representation of backbone dihedrals Φ4 and Ψ4 of the only proline residue (Pro4) and (B) the probability distribution of boost potential ΔV obtained from three independent 200 ns dual-boost aMD simulations. Trp-cage: (C) scheme representation of backbone dihedrals Φ12 and Ψ12 of Pro12 that is located in the middle of the protein chain and (D) the probability distribution of boost potential ΔV from four independent 500 ns dual-boost aMD simulations.
In dual-boost aMD simulations of chignolin, reweighting using exponential average leads to high fluctuations in both Φ4 and Ψ4, as shown in Figure 7A and B. The energy wells are poorly reproduced and the energy barrier of Ψ4 at 75° is overestimated by ∼6 kcal/mol. Again, this originates from the broad distribution of ΔV, for which the Boltzmann reweighting factors are dominated by the high boost potential frames with ΔV = 20–32 kcal/mol. Using Maclaurin series expansion to the 10th order, the reweighted PMF profiles are less noisy, but they differ most in the energy barrier region of Ψ4 near 75° by ∼2 kcal/mol (Figure 7D). With cumulant expansion, since the reweighted PMF profiles using expansion to the third order exhibit large energetic noise as seen in Figure 3E and F, they are not presented for chignolin, also for Trp-cage below. Cumulant expansion on the first order generates deviated PMF profiles, similar to the Maclaurin series expansion. In comparison, PMF profiles obtained from cumulant expansion to the second order exhibits better agreement with those of 1000 ns cMD simulations with errors of ∼0.5 kcal/mol (Figure 7E and F). High fluctuations are observed in the energy barrier region of Ψ4 centered at 75° (Figure 7F), which is strongly correlated with the increased anharmonicity of the ΔV distribution found in the energy barrier region (Figure 7H). In the energy well regions of Φ4 centered at −72° and Ψ4 at −30° and 150°, the anharmonicity of ΔV distribution stays low at ∼0.05 (Figure 7G and H). This justifies the accurate PMF obtained in these regions through cumulant expansion to the second order.
Figure 7.

Free energy profiles of backbone dihedrals Φ4 and Ψ4 in chignolin calculated from reweighting three independent 300 ns dual-boost aMD simulations using (A, B) exponential average, (C, D) Maclaurin series expansion to the 10th order, (E, F) cumulant expansion to the 1st and 2nd orders. The free energy profiles obtained from two independent 1000 ns cMD simulation are also plotted for comparison. The distribution anharmonicity of ΔV in the aMD simulations are plotted in (G) Φ4 and (H) Ψ4.
For Trp-cage, high energetic noise is found in the reweighted PMF profiles obtained through exponential average (Figure 8A and B), similar to those of alanine dipeptide and chignolin. Based on Maclaurin series expansion to the 10th order, the reweighted PMF profiles are much less noisy, but the PMF values of Φ12 in the energy barrier region −12°–12° differ most from the cMD simulations by ∼2 kcal/mol, and the energy minimum position of Ψ12 is shifted from −18° to −36° (Figure 8C and D). In comparison, cumulant expansion to the second order provides reweighted PMF profiles that are similar to the original as obtained from the 1000 ns cMD simulations within ∼kBT statistical errors (Figure 8E and F). High fluctuations observed in the energy barrier regions are also strongly correlated with the increased anharmonicity of the ΔV distribution as shown in Figure 8G and H. In summary, reweighting based on cumulant expansion to the second order provides the most accurate reweighted PMF profiles compared with the exponential average and Maclaurin series expansion.
Figure 8.

Free energy profiles of backbone dihedrals Φ12 and Ψ12 in Trp-cage calculated by reweighting four independent 500 ns dual-boost aMD simulations: (A, B) exponential average, (C, D) Maclaurin series expansion to the 10th order, (E, F) cumulant expansion to the 1st and 2nd orders. The free energy profiles obtained from two independent 1000 ns cMD simulation are also plotted for comparison. The distribution anharmonicity of ΔV in the aMD simulations are plotted in (G) Φ12 and (H) Ψ12.
Conclusions
AMD is an efficient enhanced sampling technique that has been demonstrated to capture millisecond-time scale events in both globular and membrane proteins. Unlike many other biased sampling methods, aMD is able to explore the conformational space of biomolecules without the requirement of predefined reaction coordinate(s). However, accurate reweighting of aMD simulations has been a long-standing problem.5a
In this study, we systematically compared the currently used aMD reweighting algorithms, including the exponential average, Maclaurin series and cumulant expansion, with simulations on three model systems, that is, alanine dipeptide, chignolin and Trp-cage. In the dihedral-boost aMD simulations of alanine dipeptide, the boost potential exhibits a relatively narrow distribution with a range δΔV ≤ 12 kcal/mol, for which exponential average is able to recover the original PMF profiles within errors of ∼1 kcal/mol. In the dual-boost aMD simulations of alanine dipeptide, chignolin and Trp-cage, larger boost potentials of broader distribution (δΔV ≥ 18 kcal/mol) are applied. The exponential reweighting factors are dominated by a small number of simulation frames with the largest ΔV, leading to highly noisy PMF profiles. Reweighting based on the Maclaurin series expansion that is equivalent to cumulant expansion on the first order greatly suppresses the energetic noise, but the energy minimum positions are often incorrectly reproduced and the PMF values exhibit errors of ∼1–2 kcal/mol in the systems examined. In contrast, cumulant expansion to the second order normally recovers the most accurate PMF profiles (within ∼kBT of the original), particularly when the distribution of ΔV satisfies near-Gaussian distribution. In this context, anharmonicity of the ΔV distribution, γ can serve as an indicator of the accuracy of aMD reweighting using cumulant expansion to the second order.
For simulations of larger systems (e.g., proteins with several hundred residues and hundreds-of-thousand to millions of atoms), significantly higher boost potential with broad distribution (e.g., δΔV ≈ 100–200 kcal/mol) often occurs with the current aMD scheme and accurate reweighting remains challenging.5c In future developments, the anharmonicity of the ΔV distribution, γ could be used to propose new formula for aMD boost potential such that accurate reweighting can be achieved. Furthermore, the postprocessing of aMD trajectories could be optimized to minimize the anharmonicity of the boost potential distribution, for instance through the selection of a good set of multidimensional reaction coordinates. In general, we expect cumulant expansion to find great use in the reconstruction of accurate free energy profiles from aMD simulations.
Acknowledgments
We thank Changsun Eun, Ferran Feixas, Donald Hamelberg, Hari Muddana, and Michael K. Gilson for valuable discussions. Computing time was provided on GPU nodes of the Triton Shared Computing Cluster (TSCC) at the San Diego Supercomputer Center (SDSC) and by the joint Memorial Sloan Kettering Cancer Center (MSKCC) and Walker Lab Exxact AMBER GPU Cluster. This work was supported by NSF (grants MCB1020765 and SI2-1148276), National Institutes of Health (NIH) (grant GM31749), Howard Hughes Medical Institute, Center for Theoretical Biological Physics (CTBP), NVIDIA Inc., and the National Biomedical Computation Resource (NBCR).
Supporting Information Available
Figures S1–S7 as described in the text. This material is available free of charge via the Internet at http://pubs.acs.org.
The authors declare no competing financial interest.
Funding Statement
National Institutes of Health, United States
Supplementary Material
References
- a Hamelberg D.; Mongan J.; McCammon J. A. Accelerated Molecular Dynamics: A Promising and Efficient Simulation Method for Biomolecules. J. Chem. Phys. 2004, 1202411919–11929. [DOI] [PubMed] [Google Scholar]; b Hamelberg D.; de Oliveira C. A. F.; McCammon J. A. Sampling of Slow Diffusive Conformational Transitions with Accelerated Molecular Dynamics. J. Chem. Phys. 2007, 12715155102. [DOI] [PubMed] [Google Scholar]
- a Wereszczynski J.; McCammon J. A. Nucleotide-Dependent Mechanism of Get3 As Elucidated from Free Energy Calculations. Proc. Natl. Acad. Sci. U.S.A. 2012, 109207759–7764. [DOI] [PMC free article] [PubMed] [Google Scholar]; b Gasper P. M.; Fuglestad B.; Komives E. A.; Markwick P. R. L.; McCammon J. A. Allosteric Networks in Thrombin Distinguish Procoagulant vs Anticoagulant Activities. Proc. Natl. Acad. Sci. U.S.A. 2012, 1095221216–21222. [DOI] [PMC free article] [PubMed] [Google Scholar]; c Markwick P. R. L.; Pierce L. C. T.; Goodin D. B.; McCammon J. A. Adaptive Accelerated Molecular Dynamics (Ad-AMD) Revealing the Molecular Plasticity of P450cam. J. Phys. Chem. Lett. 2011, 23158–164. [DOI] [PMC free article] [PubMed] [Google Scholar]; d Bucher D.; Grant B. J.; Markwick P. R.; McCammon J. A. Accessing a Hidden Conformation of the Maltose Binding Protein Using Accelerated Molecular Dynamics. PLoS Comput. Biol. 2011, 74e1002034. [DOI] [PMC free article] [PubMed] [Google Scholar]; e Wang Y.; Markwick P. R. L.; de Oliveira C. A. F.; McCammon J. A. Enhanced Lipid Diffusion and Mixing in Accelerated Molecular Dynamics. J. Chem. Theory Comput. 2011, 7103199–3207. [DOI] [PMC free article] [PubMed] [Google Scholar]
- Pierce L. C. T.; Salomon-Ferrer R.; de Oliveira C. A. F.; McCammon J. A.; Walker R. C. Routine Access to Millisecond Time Scale Events with Accelerated Molecular Dynamics. J. Chem. Theory Comput. 2012, 892997–3002. [DOI] [PMC free article] [PubMed] [Google Scholar]
- a Miao Y.; Nichols S. E.; Gasper P. M.; Metzger V. T.; McCammon J. A. Activation and Dynamic Network of the M2 Muscarinic Receptor. Proc. Natl. Acad. Sci. U. S. A. 2013, 1102710982–10987. [DOI] [PMC free article] [PubMed] [Google Scholar]; b Miao Y.; Nichols S. E.; McCammon J. A. Mapping of Allosteric Druggable Sites in Activation-Associated Conformers of the M2Muscarinic Receptor. Chem. Biol. Drug Des. 2013, 832237–246. [DOI] [PMC free article] [PubMed] [Google Scholar]
- a Shen T. Y.; Hamelberg D. A Statistical Analysis of the Precision of Reweighting-Based Simulations. J. Chem. Phys. 2008, 1293034103. [DOI] [PubMed] [Google Scholar]; b Markwick P. R. L.; McCammon J. A. Studying functional dynamics in bio-molecules using accelerated molecular dynamics. Phys. Chem. Chem. Phys. 2011, 134520053–20065. [DOI] [PubMed] [Google Scholar]; c Miao Y.; Nichols S. E.; McCammon J. A. Free Energy Landscape of G-Protein Coupled Receptors, Explored by Accelerated Molecular Dynamics. Phys. Chem. Chem. Phys. 2014, 16146398–6406. [DOI] [PMC free article] [PubMed] [Google Scholar]; d Sinko W.; Miao Y.; de Oliveira C. A. F.; McCammon J. A. Population Based Reweighting of Scaled Molecular Dynamics. J. Phys. Chem. B 2013, 1174212759–12768. [DOI] [PMC free article] [PubMed] [Google Scholar]
- Wereszczynski J.; McCammon J. A. Using Selectively Applied Accelerated Molecular Dynamics to Enhance Free Energy Calculations. J. Chem. Theory Comput. 2010, 6113285–3292. [DOI] [PMC free article] [PubMed] [Google Scholar]
- a Fajer M.; Hamelberg D.; McCammon J. A. Replica-Exchange Accelerated Molecular Dynamics (REXAMD) Applied to Thermodynamic Integration. J. Chem. Theory Comput. 2008, 4101565–1569. [DOI] [PMC free article] [PubMed] [Google Scholar]; b Fajer M.; Swift R. V.; McCammon J. A. Using Multistate Free Energy Techniques to Improve the Efficiency of Replica Exchange Accelerated Molecular Dynamics. J. Comput. Chem. 2009, 30111719–1725. [DOI] [PMC free article] [PubMed] [Google Scholar]; c Arrar M.; de Oliveira C. A. F.; Fajer M.; Sinko W.; McCammon J. A. w-REXAMD: A Hamiltonian Replica Exchange Approach to Improve Free Energy Calculations for Systems with Kinetically Trapped Conformations. J. Chem. Theory Comput. 2013, 9118–23. [DOI] [PMC free article] [PubMed] [Google Scholar]
- Bowman G. R.; Huang X.; Pande V. S. Using Generalized Ensemble Simulations and Markov State Models to Identify Conformational States. Methods 2009, 492197–201. [DOI] [PMC free article] [PubMed] [Google Scholar]
- a Torrie G. M.; Valleau J. P. Nonphysical sampling distributions in Monte Carlo free-energy estimation: Umbrella sampling. J. Comput. Phys. 1977, 232187–199. [Google Scholar]; b Kumar S.; Bouzida D.; Swendsen R. H.; Kollman P. A.; Rosenberg J. M. The Weighted Histogram Analysis Method for Free-Energy Calculations on Biomolecules 0.1. The Method. J. Comput. Chem. 1992, 1381011–1021. [Google Scholar]
- Laio A.; Gervasio F. L. Metadynamics: A Method to Simulate Rare Events and Reconstruct the Free Energy in Biophysics, Chemistry, and Material Science. Rep. Prog. Phys. 2008, 7112126601. [Google Scholar]
- a Darve E.; Pohorille A. Calculating Free Energies Using Average Force. J. Chem. Phys. 2001, 115209169–9183. [Google Scholar]; b Darve E.; Rodriguez-Gomez D.; Pohorille A. Adaptive Biasing Force Method for Scalar and Vector Free Energy Calculations. J. Chem. Phys. 2008, 12814144120. [DOI] [PubMed] [Google Scholar]
- a Zheng L. Q.; Yang W. Practically Efficient and Robust Free Energy Calculations: Double-Integration Orthogonal Space Tempering. J. Chem. Theory Comput. 2012, 83810–823. [DOI] [PubMed] [Google Scholar]; b Zheng L.; Chen M.; Yang W. Random Walk in Orthogonal Space to Achieve Efficient Free-Energy Simulation of Complex Systems. Proc. Natl. Acad. Sci. U.S.A. 2008, 1055120227–32. [DOI] [PMC free article] [PubMed] [Google Scholar]
- a Jarzynski C. Nonequilibrium Equality for Free Energy Differences. Phys. Rev. Lett. 1997, 78142690–2693. [Google Scholar]; b Jarzynski C. Equilibrium Free-Energy Differences from Nonequilibrium Measurements: A Master-Equation Approach. Phys. Rev. E 1997, 5655018–5035. [Google Scholar]
- Hummer G. Fast-Growth Thermodynamic Integration: Error and Efficiency Analysis. J. Chem. Phys. 2001, 114177330–7337. [Google Scholar]
- Park S.; Khalili-Araghi F.; Tajkhorshid E.; Schulten K. Free Energy Calculation from Steered Molecular Dynamics Simulations Using Jarzynski’s Equality. J. Chem. Phys. 2003, 11963559–3566. [Google Scholar]
- a Levy R. M.; Belhadj M.; Kitchen D. B. Gaussian Fluctuation Formula for Electrostatic Free-Energy Changes in Solution. J. Chem. Phys. 1991, 9553627–3633. [Google Scholar]; b Simonson T.; Wong C. F.; Brunger A. T. Classical and quantum simulations of tryptophan in solution. J. Phys. Chem. A 1997, 101101935–1945. [Google Scholar]
- Lindorff-Larsen K.; Piana S.; Dror R. O.; Shaw D. E. How Fast-Folding Proteins Fold. Science 2011, 3346055517–520. [DOI] [PubMed] [Google Scholar]
- Eastwood M. P.; Hardin C.; Luthey-Schulten Z.; Wolynes P. G. Statistical Mechanical Refinement of Protein Structure Prediction Schemes: Cumulant Expansion Approach. J. Chem. Phys. 2002, 11794602–4615. [Google Scholar]
- Lange O. F.; Grubmuller H. Full Correlation Analysis of Conformational Protein Dynamics. Proteins: Struct., Funct., Bioinf. 2008, 7041294–1312. [DOI] [PubMed] [Google Scholar]
- a D.A. Case T. A. D., T.E. Cheatham C. L. III Simmerling J. Wang R. E. Duke R. Luo R. C. Walker W. Zhang K. M. Merz B. Roberts S. Hayik A. Roitberg G. Seabra J. Swails A. W. Goetz I. Kolossváry K. F. Wong F. Paesani J. Vanicek R. M. Wolf J. Liu X. Wu S. R. Brozell T. Steinbrecher H. Gohlke Q. Cai X. Ye J. Wang M.-J. Hsieh G. Cui D. R. Roe D. H. Mathews M. G. Seetin R. Salomon-Ferrer C. Sagui V. Babin T. Luchko S. Gusarov A. Kovalenko, and Kollman P.A.. AMBER 12; University of California: San Francisco, 2012; [Google Scholar]; b Gotz A. W.; Williamson M. J.; Xu D.; Poole D.; Le Grand S.; Walker R. C. Routine Microsecond Molecular Dynamics Simulations with AMBER on GPUs. 1. Generalized Born. J. Chem. Theory Comput. 2012, 851542–1555. [DOI] [PMC free article] [PubMed] [Google Scholar]; c Salomon-Ferrer R.; Götz A. W.; Poole D.; Le Grand S.; Walker R. C. Routine Microsecond Molecular Dynamics Simulations with AMBER on GPUs. 2. Explicit Solvent Particle Mesh Ewald. J. Chem. Theory Comput. 2013, 993878–3888. [DOI] [PubMed] [Google Scholar]; d Salomon-Ferrer R.; Case D. A.; Walker R. C. An Overview of the Amber Biomolecular Simulation Package. Wiley Interdiscip. Rev.: Comput. Mol. Sci. 2013, 32198–210. [Google Scholar]
- Le Grand S.; Gotz A. W.; Walker R. C. SPFP: Speed without Compromise—A Mixed Precision Model for GPU Accelerated Molecular Dynamics Simulations. Comput. Phys. Commun. 2013, 1842374–380. [Google Scholar]
- Barua B.; Lin J. C.; Williams V. D.; Kummler P.; Neidigh J. W.; Andersen N. H. The Trp-cage: Optimizing the Stability of a Globular Miniprotein. Protein Eng., Des. Sel. 2008, 213171–185. [DOI] [PMC free article] [PubMed] [Google Scholar]
- Jorgensen W. L.; Chandrasekhar J.; Madura J. D.; Impey R. W.; Klein M. L. Comparison of Simple Potential Functions for Simulating Liquid Water. J. Chem. Phys. 1983, 792926–935. [Google Scholar]
- Ryckaert J.-P.; Ciccotti G.; Berendsen H. J. C. Numerical Integration of the Cartesian Equations of Motion of a System with Constraints: Molecular Dynamics of n-Alkanes. J. Comput. Phys. 1977, 233327–341. [Google Scholar]
- Berendsen H. J. C.; Postma J. P. M.; Vangunsteren W. F.; Dinola A.; Haak J. R. Molecular-Dynamics with Coupling to an External Bath. J. Chem. Phys. 1984, 8183684–3690. [Google Scholar]
- Essmann U.; Perera L.; Berkowitz M. L.; Darden T.; Lee H.; Pedersen L. G. A Smooth Particle Mesh Ewald Method. J. Chem. Phys. 1995, 103198577–8593. [Google Scholar]
- Wang Y.; Harrison C. B.; Schulten K.; McCammon J. A. Implementation of Accelerated Molecular Dynamics in NAMD. Comput. Sci. Discovery 2011, 41015002. [DOI] [PMC free article] [PubMed] [Google Scholar]
Associated Data
This section collects any data citations, data availability statements, or supplementary materials included in this article.