

Abstract
The hydrodynamic tail vein injection is a technique that is used to deliver nucleic acids into live mice. Delivery through this method results in the in vivo transfection of foreign DNA primarily in the liver. Here, we describe the use of this technique to test for regulatory activity of liver promoters and enhancers, using a dual luciferase reporter system as the readable/measureable output and how this application can be used for pharmacogenomic studies.
Keywords: Hydrodynamic tail vein, Pharmacogenomics, Promoter, Enhancer
1 Introduction
The hydrodynamic tail vein technique is an efficient procedure to deliver nucleic acids to the liver via the rapid intravascular injection of a large volume of liquid [1, 2]. It can be used to deliver specific genes into the liver [3–5], to deliver RNAi [6–11], to invoke tumors [12], and to study the gene expression of the host after delivery of foreign DNA that generates therapeutic plasma levels of the resulting protein [13]. Here, we describe its use for the pharmacogenomic characterization of promoters, enhancers, and their variants in the liver. This approach can be also applied for the general investigation of hepatic gene regulatory elements.
The liver is a central organ for drug absorption, deposition, metabolism, and elimination (ADME). There has been much research focused on understanding how the diverse array of drug-associated liver genes interact to determine drug response. It is well known that differential expression of drug-metabolizing enzymes and drug transporters in the liver is a major determinant of drug response variability. In addition, interindividual differences in liver function clearly have a genetic component, as demonstrated by recent genome wide association studies that have uncovered novel susceptibility loci linked to many liver-associated diseases [14–16]. However, in the majority of cases, the variation observed within these loci does not affect protein coding regions [17]. The same holds true for pharmacogenomic phenotypes. Faulty gene regulation (in regulatory regions, such as promoters and enhancers), rather than aberrant protein structure, could be the cause of many of these pharmacogenomic outcomes.
With technological advances, such as comparative genomics and chromatin immunoprecipitation in combination with massively parallel sequencing technologies (ChIP-seq), gene regulatory sequences can now be identified in a rapid manner. However, their functional characterization, particularly in vivo, still remains a challenge. The hydrodynamic tail vein injection technique can be used as an in vivo assay to rapidly characterize functional gene regulatory elements and to test them for differences in activity due to nucleotide variation. Identifying regulatory elements and characterizing the functional effects of genetic variants on drug response will help us uncover the mechanisms of adverse drug reactions mediated by the liver. Ultimately, the study of pharmacogenomics offers the promise of tailoring more effective drug treatments on an individual basis.
2 Materials
2.1 For the Injection
Nucleic acid (10 μg/mouse of assayed plasmid; Renilla control, such as pGL4.74[hRluc/TK] (Promega): 2 μg/mouse).
Heat source (heat lamp or heat box with 120 W bulb, such as: Aladin Enterprises, Inc., Cat. # RHB.1812).
Heat pad(s) (such as reusable pads from SnapHeat.com; Cat. # SH812 & SH88).
Source of anesthesia (e.g., isoflurane), gas chamber, and mouth piece.
Scale.
Mice: 21–25 g (see Note 1).
3 mL syringes (Becton Dickinson; Cat. #: 309585).
27½ gauge needles (Becton Dickinson; Cat. #: 305109).
Medical gauze pads (Kendall; Cat. #: 2187).
Delivery Solution (Mirus TransIT®-EE In Vivo; Cat. #: Mir5340; [18]).
5 mL sterile centrifuge/plastic tubes to hold injection solution (Argos Technologies; Cat. #: T2076S).
2.2 For Liver Harvest and Luciferase Assay
Dissection instruments (scissors/forceps).
1× Lysis Buffer (5× Passive Lysis Buffer, Promega; Cat. #: E1941; Proprietary Formulation).
Luciferase substrate (see Note 2).
Renilla luciferase substrate (see Note 2).
Sterile or autoclaved liver collection tubes (see Note 8) and 1.5 mL microcentrifuge tubes.
Homogenizer (e.g., rotor stator).
Refrigerated microcentrifuge.
70 % Ethanol.
White flat bottom 96-well plates (CoStar, Cat. #: 3917).
Luminometer.
2.3 Nucleic Acid Preparation
2.3.1 Promoters
For the analysis of promoters and their variants, it is typical to clone at least 250 bp upstream of the transcriptional start site (TSS) and approximately 100 bp downstream of the TSS.
Promoter sequences and their variants are cloned into the pGL4.11b [luc2P] (Promega) vector that contains the luciferase reporter gene (Fig. 1).
An empty pGL4.11b [luc2P] vector (without an insert) is used as a negative control for promoter assays. In addition, the reference sequence of the assayed promoter is typically used as a baseline to compare the promoter activity of nucleotide variants [19].
Fig. 1.
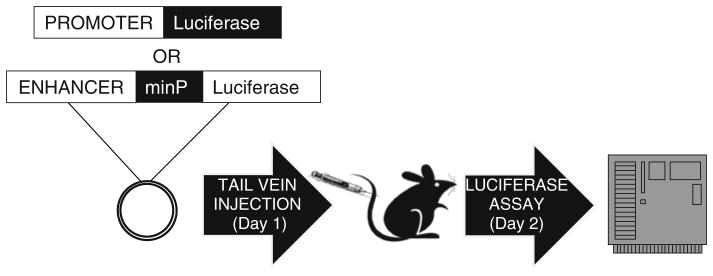
A schematic illustration of the hydrodynamic tail vein injection assay. Promoters or putative enhancer sequences are cloned into a luciferase reporter plasmid and co-injected with a Renilla luciferase reporter plasmid (not shown) into the tail vein of the mouse. Luciferase activity is assayed 24 h post injection and measured by a luminometer. minP: minimal promoter
2.3.2 Enhancers
For enhancers, there is a variety of methods and resources from which one can select candidate sequences to test for enhancer activity. These include but are not restricted to: comparative genomics, ChIP-seq datasets for enhancer marks, DNase hypersensitive sites and transcription factor binding site analysis. For pharmacogenomic purposes, we have focused on using some of these approaches to analyze regulatory sequences around genes that are involved in ADME, such as liver membrane transporters [19, 20].
The sequences that are tested for enhancer activity and their variants are cloned into the pGL4.23 [luc/minP] (Promega) vector that contains a minimal promoter (a promoter that is not sufficient to drive reporter expression without the presence of a functional enhancer) and the firefly luciferase reporter gene (Fig. 1).
For enhancers, an empty pGL4.23[luc/minP] plasmid serves as a negative control and results are compared to this vector as fold induction [20]. In addition, the reference sequence of an identified enhancer is used as a baseline to compare the enhancer activity of any nucleotide variants.
2.3.3 Control Constructs and DNA Purification
In every injection, 2 μg of the pGL4.74 [hRluc/TK] vector that contains the constitutive HSV-TK promoter followed by the Renilla Reniformis (hRluc) luciferase gene is injected to control for injection efficiency.
The ApolipoproteinE (APOE) enhancer (hg18:chr19:50119112–50119676; [21]), which is known to drive liver specific tissue expression, can be used as a positive control for liver enhancer activity in this assay.
All plasmids are typically grown up from bacterial culture and should be purified using an endotoxin-free plasmid DNA purification kit (see Note 3).
3 Methods
3.1 Day 1: Hydrodynamic Tail Vein Injection
3.1.1 Sample Preparation
The total volume required for injection (formula adopted from Mirus; see Note 4 [18]):
However, to determine the actual volume of delivery solution, the formula is rearranged and the addition of nucleic acids is taken into account:
Example 3A.
A mouse to be injected weighs 24 g. The DNA concentration of the test construct (TC) plasmid is 500 ng/μL and the Renilla plasmid (RP) concentration is 200 ng/μL. To inject 10 μg of the test construct and 2 μg of the Renilla, the total injection mix volume would be:
After subtracting the volume of the test and Renilla plasmids, the volume of the delivery solution should be:
-
To assist in determining the amount of delivery solution for each individual mouse at the time of injection, it is advised to prepare a worksheet that has already calculated the volume of nucleic acid needed for each injection and subtracted that volume from the total volume that is to be injected. In this worksheet, the weight of the mouse is already taken into account by increments of 0.5 g. This allows for the injection procedure to be more time efficient and less prone to error.
Example 3BConstruct ID Test 1 Construct volume (μL) 20 Renilla volume (μL) 10 Weight of mouse (g) Mirus (mL) 21.0 2.17 21.5 2.22 22.0 2.27 22.5 2.32 23.0 2.37 23.5 2.42 24.0 2.47 24.5 2.52 25.0 2.57 Construct DNA concentration (ng/μL) 500 Volume for 10 μg (μL) 20 Warm up the delivery solution to 25–37 °C prior to injection.
Once determining the mouse weight using a scale, add the nucleic acid (test and Renilla) into a sterile 5 mL plastic tube.
Add the appropriate volume of delivery solution to the tube containing the nucleic acid.
Connect the needle to the syringe and load the injection solution. Make certain that there are no air bubbles in the syringe by flipping the syringe, tapping the side or by moving the plunger up and down carefully; push the air out of the needle until a small volume of the injection solution is ejected.
3.2 Preparation of the Animal for Injection
Dilate the tail vein by warming the mouse with a heat source, such as a heat box (Fig. 2), prior to administering the gaseous anesthetic (see Note 5). Following 3–5 min in the heat box, transfer the mouse into the anesthesia chamber (Fig. 3b). The chamber used to administer the anesthetic can also be fitted with a heat pad for optimal dilation.
After the mouse is anesthetized in the chamber, as it is transferred to the injection station, weigh the animal on a scale to determine the volume of delivery solution needed (see Subheading 3.1.1 above). Place the animal on the injection station, with the anesthetic mask positioned into its muzzle (Fig. 4).
Locate the tail veins on either side of the tail (they are located laterally) and adjust the body to the side to be injected. Swab the tail with alcohol to clean the injection site.
Pull the tail taut and place the needle, bevel up, approximately 30–45° from the plane of the tail (see Fig. 5a). It is recommended to first inject in the distal half of the tail so that should the initial injection be unsuccessful, the needle can be repositioned closer towards the trunk of the mouse. Starting too close to the end, however, will be more difficult, as the vein and tail are thinner. As the needle inserts into the vein, move the needle nearly parallel to the tail and insert the entire length of the needle into the vein (see Fig. 5b); inject the injection solution into the tail (see Note 6).
Inject the entire contents of the syringe within 4–8 s at a constant rate.
Stop the bleeding by applying the medical gauze to the injection site.
Take the mouse off the anesthetic (optional; we usually label each mouse with a different number using a permanent marker so as to know what construct was injected) and allow it to recover in a new cage (see Note 7).
Fig. 2.

(a) Heat box (Aladin Enterprises, Inc., Cat. # RHB.1812); (b) mice being warmed up for tail dilation
Fig. 3.

(a) Gaseous anesthesia machine; (b) anesthesia box with heat pad; (c) injection station with anesthesia mouth piece and heat pad
Fig. 4.

Anesthetized mouse on injection station, ready for tail vein injection
Fig. 5.
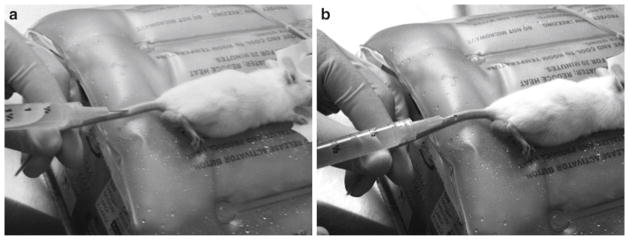
Mouse tail vein injection. (a) Entry of the needle is approximately at a 45° angle; (b) As the needle is inserted into the vein, the needle becomes more parallel with the tail and the solution is injected rapidly between 4 and 8 s
3.3 Day 2: Harvesting the Livers and Luciferase Measurements
Based on Herweijer et al. [3], whose study determined that the optimal liver expression levels of injected DNA is 24 h post injection, livers are harvested at this time point.
3.3.1 Preparation of Reagents
Before sacrificing the mice, dilute lysis buffer in water to working concentration and aliquot 3 mL into labeled liver collection tubes (see Note 8).
Prepare the Luciferase Assay Reagent II and Stop N Glo® Reagent solutions, according to manufacturer’s protocol (see Note 9).
Sacrifice mice according to approved animal protocols, dissect the liver and place it in the numbered liver collection tubes containing 3 mL of cold lysis buffer on ice (make sure all of the liver tissue is entirely immersed in the lysis buffer).
Homogenize the livers for 1 min at high speed until there are no observed liver chunks, keeping samples on ice before and after homogenization. Use 70 % ethanol to clean the homogenizer between samples.
Transfer 1 mL of the liver homogenate to a labeled 1.5 mL microcentrifuge tube and centrifuge at 4 °C for 30 min at 14,000 rpm.
During this centrifugation, aliquot 380 μL lysis buffer to a newly labeled 1.5 mL microcentrifuge tube per sample and store at 4 °C.
Upon completion of centrifugation of the liver homogenate, transfer 20 μL of the supernatant (liquid in the top phase of the homogenate) to the 1.5 mL microcentrifuge tube containing 380 μL lysis buffer that has been chilled to 4 °C and vortex briefly (see Note 10).
Administer the appropriate volume of Luciferase Assay and Stop-N-Glo® reagents into the diluted liver supernatant from step 7. This amount is usually determined by the specific luminometer that is used for this assay, according to the manufacturer’s protocols.
3.4 Analysis of Luciferase Activity Readings
The background blank readings of lysis buffer are routinely subtracted from both the Luciferase and Renilla activity readings. In addition, the Luciferase values are divided by the Renilla activity values (within each sample) to get a normalized relative Luciferase activity value and the replicates are averaged together.
An alternate method of quantifying luciferase activity is a real time approach, using in vivo imaging technology such as the IVIS optical imaging system by Caliper Life Sciences [22]. This system allows for the quantification of bioluminescence and/or luminescence in vivo and avoids sacrificing mice to measure reporter gene activity.
Footnotes
While it is possible to inject at a lower and higher weight, we find that mice that are under and over the 21–25 g weight range pose technical challenges. Smaller mice have smaller tail veins for the gauge used for this technique. Larger mice require more volume to inject and have been found to recover at a lower success rate from the actual injection than mice that are between 21 and 25 g. If the source of mice is an outside provider, plan to have your shipment arrive at least 1 day before, making the mice less stressed and well fed/hydrated than those that arrive on the day of the injection. Also keep in mind, mice that arrive several days ahead of the injection date may gain weight and may be larger than the weight requested. We typically use CD1 mice since they are bigger and albino, making it easier to detect their tail vein and inject.
Promega provides a Dual-Luciferase Reporter Assay kit that provides all the necessary reagents in one kit (Promega, Dual-Luciferase® Reporter Assay System; Cat. #: E1960) [23].
It is important that the purified plasmid DNA is of high quality and protein-, endotoxin-, DNase-, RNase-free to prevent adverse or toxic effects on the animal. To achieve this, we routinely use the Qiagen Endofree Kit (Qiagen, Cat. #: 12362).
The addition of the 0.1 mL delivery solution compensates for the volume of delivery solution that remains in the syringe after the injection.
Condensation in the box or excessive movement is an indication of overheating. To prevent overheating or dehydration, mice are only pulled from their original mouse cage a few minutes prior to their sedation. Do not keep mice in the heat box for more than 20 min.
If the needle is inserted properly, the blood in the vein should clear and injection of the solution should be without resistance. If there is resistance upon pushing the plunger, the needle is not placed properly into the vein. This is also evident, if, during the injection the tail becomes swollen locally and appears to be “perspiring” the solution that is injected out of the tail’s pores. Likewise, if the injection is improperly administered, the anal area of the mouse may also become swollen. Resistance may also be experienced mid-injection, perhaps by the movement of the needle out of the vein. If that is the case, continue to inject the solution but pull the needle slightly out. This may alleviate the resistance and allow for a successful injection.
The mouse should recover within 5 min of the injection. The heart rate may slow or increase rapidly within the first minute post injection, however, this should normalize. If the mouse appears to be seizing after the injection, this may be an indicator that either an air bubble or an impurity entered the circulation and the mouse may not survive. Careful monitoring of the mice post injection is necessary.
The collection tube used may be dependent on the homogenizer; a 14 mL Falcon tube (Becton Dickinson, Cat. #: 352001) is adequate for a rotor stator homogenizer. Additional lysis buffer will be needed to dilute the supernatant in step 7 and to use as a blank/plate control during the luminescence read.
Keep both solutions away from direct light and heat. They can be stored at 4 °C until they are ready to aliquot.
Dilution of the supernatant may not be necessary, depending on the luminometer’s range.
References
- 1.Zhang G, Budker V, Wolff JA. High levels of foreign gene expression in hepatocytes after tail vein injections of naked plasmid DNA. Hum Gene Ther. 1999;10:1735–1737. doi: 10.1089/10430349950017734. [DOI] [PubMed] [Google Scholar]
- 2.Eggenhofer E, et al. High volume naked DNA tail-vein injection restores liver function in Fah-knock out mice. Hepatology. 2009;25:1002–1008. doi: 10.1111/j.1440-1746.2009.06156.x. [DOI] [PubMed] [Google Scholar]
- 3.Herweijer H, Zhang G, et al. Time course of gene expression after plasmid DNA gene transfer to the liver. J Gene Med. 2001;3(3):280–291. doi: 10.1002/jgm.178. [DOI] [PubMed] [Google Scholar]
- 4.Herweijer H, Wolff JA. Progress and prospects: naked DNA gene transfer and therapy. Gene Ther. 2003;10:453–458. doi: 10.1038/sj.gt.3301983. [DOI] [PubMed] [Google Scholar]
- 5.Herweijer H, Wolff JA. Gene therapy progress and prospects: hydrodynamic gene delivery. Gene Ther. 2007;14:99–107. doi: 10.1038/sj.gt.3302891. [DOI] [PubMed] [Google Scholar]
- 6.Lewis DL, et al. Efficient delivery of siRNA for inhibition of gene expression in postnatal mice. Nat Genet. 2002;32:107–108. doi: 10.1038/ng944. [DOI] [PubMed] [Google Scholar]
- 7.McCaffrey AP, et al. RNA interference in adult mice. Nature. 2002;418:38–39. doi: 10.1038/418038a. [DOI] [PubMed] [Google Scholar]
- 8.Sen A, et al. Inhibition of hepatitis C virus protein expression by RNA interference. Virus Res. 2003;96:27–35. doi: 10.1016/s0168-1702(03)00170-9. [DOI] [PubMed] [Google Scholar]
- 9.Song E, et al. RNA interference targeting Fas protects mice from fulminant hepatitis. Nat Med. 2003;9:347–351. doi: 10.1038/nm828. [DOI] [PubMed] [Google Scholar]
- 10.Zender L, et al. Caspase 8 small interfering RNA prevents acute liver failure in mice. Proc Natl Acad Sci USA. 2003;100:7797–7802. doi: 10.1073/pnas.1330920100. [DOI] [PMC free article] [PubMed] [Google Scholar]
- 11.Xu J, et al. Reduction of PTP1B by RNAi upregulates the activity of insulin controlled fatty acid synthase promoter. Biochem Biophys Res Commun. 2005;329:538–543. doi: 10.1016/j.bbrc.2005.02.016. [DOI] [PubMed] [Google Scholar]
- 12.Keng VW, et al. Modeling hepatitis B virus X-induced hepatocellular carcinoma in mice with the sleeping beauty transposon system. Hepatology. 2011;53:781–790. doi: 10.1002/hep.24091. [DOI] [PMC free article] [PubMed] [Google Scholar]
- 13.Zhou T, et al. Intracellular gene transfer in rats by tail vein injection of plasmid DNA. AAPS J. 2010;12:692–698. doi: 10.1208/s12248-010-9231-z. [DOI] [PMC free article] [PubMed] [Google Scholar]
- 14.Chalasani N, et al. Genome-wide association study identifies variants associated with histologic features of nonalcoholic fatty liver disease. Gastroenterology. 2010;139:1567–1576. doi: 10.1053/j.gastro.2010.07.057. [DOI] [PMC free article] [PubMed] [Google Scholar]
- 15.Zhang H, et al. Genome-wide association study identifies 1p36.22 as a new susceptibility locus for hepatocellular carcinoma in chronic hepatitis B virus carriers. Nat Genet. 2010;42:755–758. doi: 10.1038/ng.638. [DOI] [PubMed] [Google Scholar]
- 16.Chen WM, et al. Variations in the G6PC2/ABCB11 genomic region are associated with fasting glucose levels. J Clin Invest. 2008;118:2620–2628. doi: 10.1172/JCI34566. [DOI] [PMC free article] [PubMed] [Google Scholar]
- 17.Schadt EE, et al. Mapping the genetic architecture of gene expression in human liver. PLoS Biol. 2008;6:1020–1032. [Google Scholar]
- 18.MIRUS. [Accessed July 2011];TransIT®-EE Hydrodynamic Delivery Solution Protocol. http://www.mirusbio.com/assets/cms_files/protocols/ML043.pdf.
- 19.Choi JH, et al. Identification and characterization of novel polymorphisms in the basal promoter of the human transporter, MATE1. Pharmacogenet Genomics. 2009;19:770–780. doi: 10.1097/FPC.0b013e328330eeca. [DOI] [PMC free article] [PubMed] [Google Scholar]
- 20.Kim MJ, et al. Functional characterization of liver enhancers regulating drug-associated transporters. Clin Pharmacol Ther. 2011;89:571–578. doi: 10.1038/clpt.2010.353. [DOI] [PMC free article] [PubMed] [Google Scholar]
- 21.Simonet WS, et al. A far-downstream hepatocyte-specific control region directs expression of the linked human apolipoprotein E and C-I genes in transgenic mice. J Biol Chem. 1993;268:8221–8229. [PubMed] [Google Scholar]
- 22.Caliper Life Sciences. [Accessed July 2011];IVIS® Lumina II. http://www.caliperls.com/products/preclinical-imaging/ivis-luminaii.htm.
- 23.Promega Corporation. [Accessed July 2011];Dual-Luciferase® Reporter Assay Technical Manual. http://www.promega.com/resources/protocols/technical-manuals/0/dual-luciferase-reporter-assay-system-protocol/