Abstract
A transgenic ferret model of cystic fibrosis has recently been generated. It is probable that malfunction of airway mucous glands contributes significantly to the airway pathology of this disease. The usefulness of the ferret model may therefore depend in part on how closely the airway glands of ferrets resemble those of humans. Here, we show that in the ferret trachea glands are commonest in its most ventral aspect and disappear about half way up the lateral walls; they are virtually absent from the dorsal membranous portion. Further, the aggregate volume of glands per unit mucosal surface declines progressively by about 60% between the larynx and the carina. The average frequency of glands openings for the ferret trachea as a whole is only about one-fifth that in humans (where gland openings are found at approximately the same frequency throughout the trachea). Glands in the ferret trachea are on average about one-third the size of those in the human. Therefore, the aggregate volume of tracheal glands (per unit mucosal surface area) in the ferret is only about 6% that in humans. As in other mammalian species, airway glands in the ferret disappear at an airway internal diameter of ~1 mm, corresponding approximately in this species to airway generation 6.
Keywords: ferret, cystic fibrosis, airway mucous gland
Cystic fibrosis (CF) is a genetic disease in which the main cause of morbidity and mortality is chronic destructive airway infection and progressive plugging of airways with mucous secretions, bacteria, and vascular transudate (Vawter and Shwachman, 1979). Much evidence suggests that malfunction of airway mucous glands contributes significantly to this pathology (Sturgess and Imrie, 1982; Yamaya et al., 1991; Jiang et al., 1997; Jayaraman et al., 2001; Choi et al., 2007; Joo et al., 2010). Particularly dramatic is the association between the almost complete lack of tracheobronchial glands in mice (Widdicombe et al., 2001), and the failure of the transgenic CF mouse to develop significant airway pathology (Guilbault et al., 2007). By contrast, pig airway glands are similar in size and numbers to those of people (Choi et al., 2000), and the transgenic CF pig develops airway pathology much like that of human CF patients (Ostedgaard et al., 2011). A transgenic ferret model of CF has recently been generated (Sun et al., 2008), and the usefulness of this model may therefore depend on how closely the airway glands of ferrets, in their size and distribution, resemble those of humans. Two differences between ferret and human airway glands have been described. First, in the ferret, all airway glands form postnatally (Leigh et al., 1986), whereas in humans all are formed by the 25th week of gestation (Tos, 1966). Second, maximal flow rates from ferret tracheal glands are only about one-third those from pig and human (Joo et al., 2002a,b; Cho et al., 2010), suggesting that ferret glands are comparatively small. However, precise information regarding the number, distribution, and size of mucous glands of the ferret tracheobronchial tree is lacking, a deficit this paper seeks to fill.
MATERIALS AND METHODS
Animals
Using a protocol approved by the UC Davis IACUC, adult female ferrets (Mustela putorius, sable coat type) were anesthetized with ketamine, and then euthanized with sodium pentobarbital. Immediately after death, the lungs and trachea were removed and placed in phosphate-buffered saline (PBS). Approximately 20 animals were used.
Whole Mounts
Tracheas were split open longitudinally, and divided transversely into six portions of equal length. In some cases, we also dissected out the intrapulmonary airways down to where they became ~1 mm in internal diameter, then removed them, and split them open longitudinally. Each tracheal or bronchial segment was pinned flat in a wax dissecting tray, and fixed in Karnovsky’s fixative (2.5% paraformaldehyde + 2.0% glutaraldehyde in 0.08 M sodium phosphate buffer, pH 7.2) for 8–12 hr at 4°C. After fixation, each segment was rinsed with 0.1 M sodium phosphate buffer and dehydrated by transfer through ethanol solutions of increasing strength (30, 50, 70, 95, and 100%). Airway segments, stored in 100% ethanol, were stained with periodic acid Schiff (PAS) much as in earlier studies (Tos, 1966; Choi et al., 2000). In sequence, they were treated with 70% ethanol (1-hr), distilled water (3× 5 min), 0.05% periodic acid (5 min), distilled water (3× 3 min), freshly prepared Schiff reagent (1 min), distilled water (2× 5 min), 96% ethanol (3× 5 min), 100% ethanol (3× 20 min), and benzene (2× 20 min). They were then equilibrated in anise oil and sandwiched between microscope slides for viewing. Following staining, a photographic montage was made of each whole mount. Gland profiles were outlined, and the percentage of mucosal surface lying over glands was estimated gravimetrically.
Scanning Electron Microscopy
Tracheas were split open longitudinally along the ventral aspect. To remove surface epithelial cells, each trachea was first incubated in a 40 mg/mL protease solution (Type XIV; Sigma, St. Louis, MO) at 4°C for 8–16 hr. The test tubes containing tracheas and enzyme solution were then shaken vigorously to dislodge the epithelium. Any residual epithelial cells were removed by wiping the mucosal surface with cotton swabs soaked in PBS. Tracheas, with or without surface epithelium, were fixed in Karnovsky’s fixative before dehydration by transfer through mixtures of ethanol and 1,1,1,3,3,3-hexamethyldisilazane (2:1, 1:1, and 0:1). The tissue portions were then placed in a sealed desiccator box for at least 6 hr. Each dehydrated portion was mounted on a stub, sputter-coated with gold (Pelco Auto Sputter Coater SC-7, Redding, CA), and viewed in a conventional scanning electron microscope (Philips XL30 TMP, FEI Company, Hillsboro, OR). A photographic montage was made for each tissue portion at 10× magnification. All gland openings on these montages were identified at 100×–200× magnification. Higher magnification was used to obtain photographs of individual gland openings.
Light Microscopy
Pieces of tracheal wall were fixed overnight in 4% formaldehyde in PBS (pH 7.0). They were then dehydrated in alcohols, embedded in paraffin, sectioned (5 μm) perpendicularly to the mucosal surface, and stained with hematoxylin and eosin. To estimate gland volume, projections were made at a suitable magnification, and the surface epithelium and gland profiles traced. A transparent ruler placed next to the section gave the scale. The length of the surface epithelium was determined using a cartographer’s wheel, and the area of gland profiles determined gravimetrically (Choi et al., 2000). The ratio of gland area to epithelial length gives the ratio of gland volume to mucosal surface area (Whimster, 1986; Choi et al., 2000).
RESULTS
Tracheal Whole Mounts
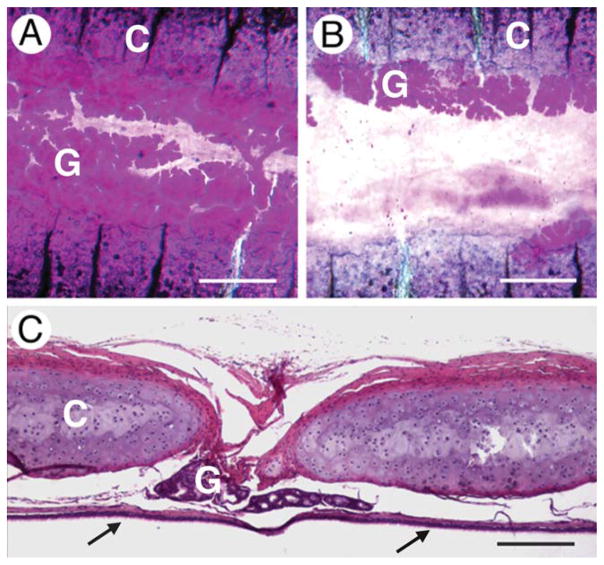
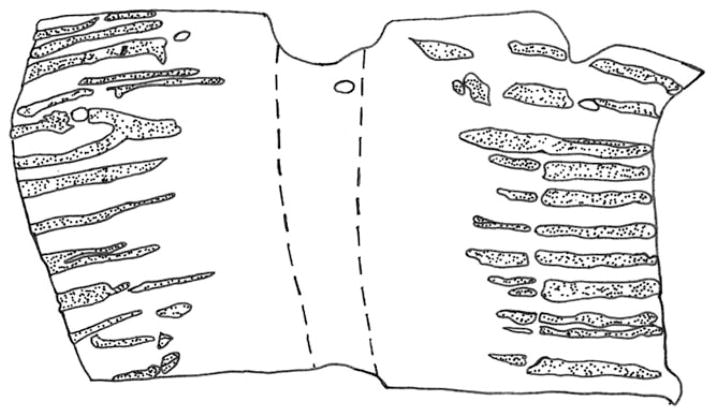
Glands were found almost exclusively between the cartilaginous rings. They were most frequent in the ventral aspect of the most anterior part of the trachea, where they occupied almost all the space between cartilaginous rings (Fig. 1A). With distance dorsally and posteriorly from this point, glands disappeared first from the centers of the intercartilaginous spaces so that they were often present only at the edges of the cartilaginous rings (Fig. 1B). In the entire dorsal membranous portions of four tracheas, only two glands were detected. Light microscopy confirmed the intercartilaginous location of glands (Fig. 1C), and also showed that glands did not penetrate very far between the rings, most being present within 200 μm of the basement membrane of the surface epithelium and none deeper than 500 μm. The circumferential distribution of glands is illustrated further in Fig. 2 in which the glands present in a whole-mount of the anterior-most sixth of a trachea are shown.
Fig. 1.
Location of glands in relation to cartilaginous rings. All images are for the most ventral aspect of the trachea. A: Whole mount of cephalad end of trachea. B: Whole mount from caudal end of trachea. In (A) and (B), glands (G) are stained magenta, the cartilaginous rings (C) are purple with transverse black lines. C: Conventional histological cross section. Parts of two cartilaginous rings (C) are shown with the glands (G) lying between them. The surface epithelium (arrows) is at the bottom. Scale bars = 500 μm (A and B), 200 μm (C).
Fig. 2.
Location of glands in whole mount of anterior-most sixth of trachea. Anterior is up. Gland profiles are stippled. The area between the dashed lines delimits the dorsal membranous portion. The four holes in the anterior end were created by dissecting pins.
To quantify these distributional trends, tracheas were split longitudinally into six equal lengths and the areas occupied by glands determined in projections of whole mounts. Figure 3A shows that there was a threefold decrease in aggregate gland area in moving from the anterior to posterior ends of the trachea. To quantify the predominant localization in the most ventral aspect of the trachea, a line was drawn through the center of the dorsal membranous portion on the projections of the whole mounts. This line was taken as representing 0° around the cross-sectional perimeter. Additional lines were drawn at 30°, 60°, and 90° around the perimeter (the latter corresponding to the most ventral aspect of the trachea). The tracheas had been split through the ventricular portion, and in those cases where the cut was at exactly 90°, the line was drawn through the nearest undamaged area (~85°). The percentage of these various lines that lay over gland profiles was then determined. The results (Fig. 3B) show that glands were most abundant at 90°, fell off significantly by 60°, and were virtually absent at 30° and 0°. This pattern applied to all regions of the trachea.
Fig. 3.
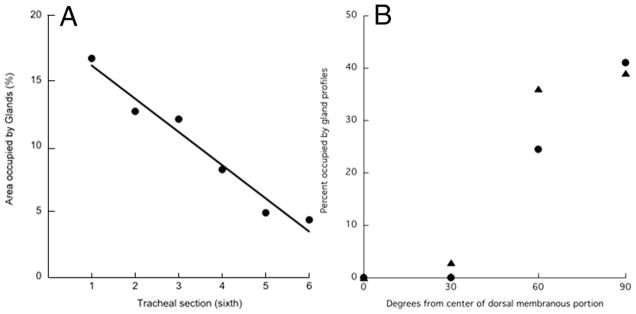
Distribution of glands along and around the trachea. A: Longitudinal distribution. Tracheas were split open longitudinally, cut into six equal lengths, stained with PAS, and the percentage of the area occupied by glands determined. Section 1 is most cephalad, and section 6 is most caudal. Results for one trachea. Exactly similar results were obtained on two other tracheas. B: Circumferential distribution. Results for anterior-most sixth of two tracheas, indicated by different symbols. Values at 30° and 60° are the averages of both sides.
Tracheal Gland Volume
Gland volume was estimated from conventional histological sections taken from eight sites in the trachea: the ventral, dorsal, and both lateral aspects at the anterior and posterior ends of the trachea. These, and other histological specimens, confirmed that gland volume was greatest in the ventral aspect at the anterior end of the trachea. For the anterior ventral portion of the trachea, the average gland volume was 5.7 ± 0.4 μL cm−2.
Tracheal Gland Openings
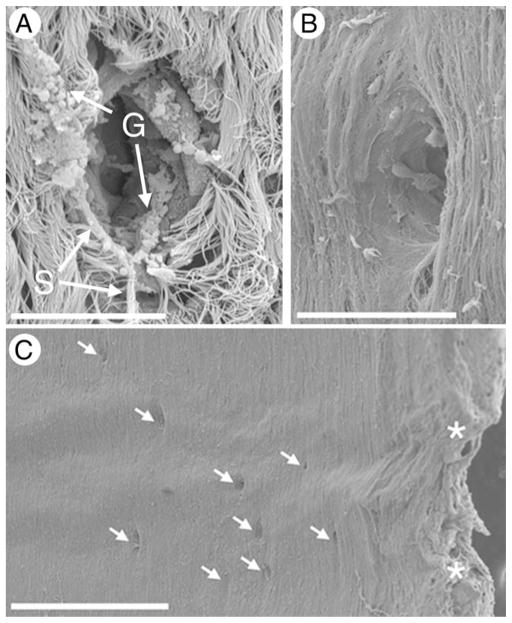
The tracheal surface was densely ciliated, with gland orifices of ~20 μm diameter (Fig. 4A). Better to see the openings, the surface epithelium was removed by protease digestion. This also removed the proximal ductal epithelium thereby increasing the average size of the openings to ~50 μm (Fig. 4B). About half the openings so visualized were circular. The others were elliptical with the long axis pointing in the anterior/posterior direction (Fig. 4B). In the intercartilaginous spaces of the anterior ventral portion of the trachea, gland openings were as frequent locally as 5–10 per mm2 (Fig. 4C). In the most anterior sixth of the trachea, the total number of gland openings was ~75. The average area of this region is ~2.3 cm2, so the average gland density is 0.3 per mm2.
Fig. 4.
Scanning electron microscopy of gland openings. A: With surface epithelium intact. Note strands of mucus and intact mucous granules. B: With surface epithelium removed by protease digestion. C: Low power photograph showing predominant localization of gland openings between cartilaginous rings. Asterisks indicate the edges of the cartilaginous rings. Scale bars = 20 μm (A and B), 500 μm (C).
Bronchial Glands
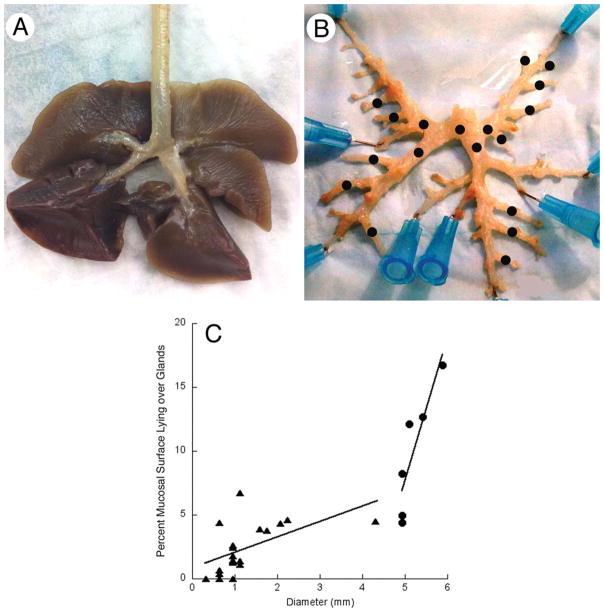
Figure 5A shows intact ferret lungs. To investigate gland distribution in airways smaller than the trachea, lung tissue was micro-dissected away from intrapulmonary airways (Fig. 5B). The pattern of branching was not strictly dichotomous. Instead, major branches led straight to the tip of each lobe. From these, smaller airways branched off at ~45° at regular intervals (Fig. 5B). Whole mounts were made of individual airways and stained for glands. The area of whole mount occupied by glands in the bronchi (range, 0%–6.8%) was significantly less than for the trachea (range, 4.5%–16.5% from posterior to anterior ends). There was a significant dependence of gland area on airway diameter. Results for both trachea and glands are combined in Fig. 5C, which indicates that glands disappear when airway diameter drops below ~0.5 mm.
Fig. 5.
Distribution of glands along the airways. A: Lungs and extrapulmonary airways. B: The same but with pulmonary tissue dissected away to show larger intrapulmonary airways. Black dots indicate airways for which whole mounts were made and stained with PAS. C: The area in a whole mount occupied by gland profiles plotted against airway diameter for the trachea (circles) and for the airways indicated by black dots in panel (B) (triangles).
DISCUSSION
Airway gland function is altered in several ways in CF (Joo et al., 2002a, 2010; Choi et al., 2007), and we speculate that this may contribute to the airway pathology of this disease. Data from the CF mouse and CF pig are consistent with this conjecture. Thus, mice have few or no tracheobronchial glands (Widdicombe et al., 2001), and the pulmonary pathology shown by the CF mouse is minor and contributes little to overall morbidity (Guilbault et al., 2007). By contrast, pigs have tracheobronchial glands that in their size, distribution, and frequency closely resemble those of people (Choi et al., 2000). If untreated, CF pigs die from gastrointestinal problems at birth. However, they can be induced to live for at least several months by ileostomy or cecostomy, and during this interval, they develop severe lung pathology resembling that of humans (Stoltz et al., 2010; Ostedgaard et al., 2011).
Like CF pigs, CF ferrets die in the immediate neonatal period (Sun et al., 2010). Survival can be prolonged pharmacologically or by the generation of transgenic animals in which the cystic fibrosis conductance regulator (the protein defective in CF) is eliminated from all tissues except the gut (Sun et al., 2010). However, there is scant information on the development of pulmonary pathology. Nor is much known about the distribution and size of tracheobronchial glands in this species, though the positive correlation across species between aggregate gland volume (in μL of gland tissue per cm2 of mucosal surface) and tracheal diameter (Widdicombe and Pecson, 2002) suggests that aggregate volume of glands in the ferret should be more than in the mouse but less than in pig or human.
We found the following. First, glands were abundant between cartilaginous rings in the ventral half of the trachea, but were absent from the posterior half. However, second, the overall frequency of the glands for the trachea as a whole was about one-fifth that in humans. Third, glands in the ferret were on average about one-third the size of those in the human. Fourth, therefore, the aggregate volume of glands (normalized to mucosal surface area) was about 6% that of humans. Fifth, as in other species (Mariassy and Plopper, 1983; Whimster, 1986; Ballard et al., 1995; Widdicombe and Pecson, 2002), glands disappeared at an airway diameter of ~1 mm, which in the ferret corresponds to approximately airway generation 6.
In goat, pig, dog, sheep, and human, average density of gland openings in the ventral aspect of the trachea ranges from 0.6 to 1.5 per mm2 (Choi et al., 2000). In human or pig, the density of glands in the posterior membranous portion is the same as in the ventral; in ox, sheep, and dog, it is about one-third (Choi et al., 2000). In the anterior-most sixth of the ferret trachea, we found an average gland frequency of 0.33 per mm2. However, there is steep gradient in gland frequency from the ventral to dorsal aspect of the trachea (Fig. 3). Assuming similar sizes of glands throughout the trachea, then the data of Fig. 3 indicate that the density on the most ventral quadrant averages 1.17 per mm2, in the lateral quadrants it averages 0.07 per mm2, and there are no glands in the most posterior quadrant. The average value of 0.33 per mm2 applies to the anterior (cephalad) end of the trachea. Correcting for the decline in gland frequency along the trachea (Fig. 2), average gland density for the trachea as a whole becomes 0.22 per mm2. Cho et al. (2010) reported that the frequency of gland openings was 1.5 per mm2 in the cartilaginous portion (ventral aspect) of the ferret trachea, and 1.8 per mm2 in the regions between the cartilaginous rings. Unfortunately, they did not state the exact location of their measurements, but their values are about what are to be expected for the most ventral aspect of the most cephalad part of the trachea.
In the ventral portion of the anterior end of the ferret’s trachea, the aggregate gland volume is ~6 μL/cm2, and the gland density is 1.17 per mm2. The average volume of an individual gland is therefore ~52 nL. For the human trachea, the corresponding values are 15 μL/cm2 and 1 opening per mm2, for an average gland volume of ~150 nL (Choi et al., 2000). Consistent with the finding that individual glands are on average smaller in the ferret than in humans is this finding that in the former they are never found more than 500 μm from the surface epithelium, whereas in the latter they may be up to 2 mm deep (Choi et al., 2000).
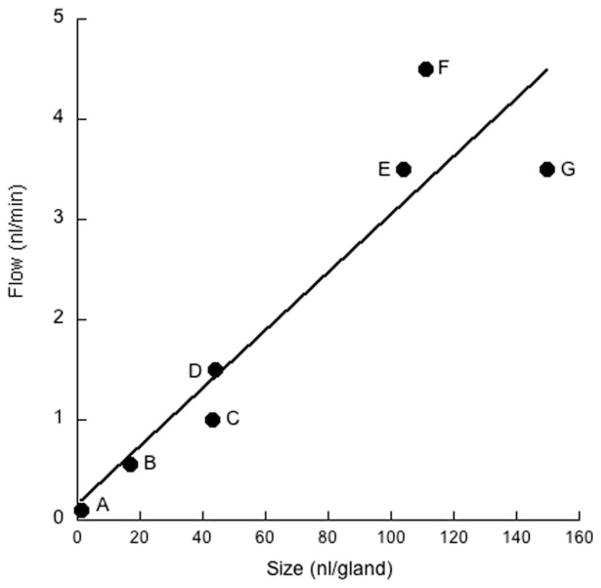
The threefold difference in gland volume between humans and ferrets almost exactly parallels the difference in maximal sustained flow rates. In humans, this is ~3.5 nL/min per gland in response to carbachol (Choi et al., 2007); in the ferret, it is 1.3 nL/min in response to the α-adrenergic agent, phenylephrine (the maximal response to carbachol is 1.0 nL/min) (Cho et al., 2010). In fact, across species and airway location (nasal vs. tracheal), there is an approximately linear relationship between gland size and maximal sustained flow rate (see Fig. 6). This, of course, is to be expected, but it does indicate that both the morphometric and physiological measurements are reliable. It also suggests that the basic design of glands is similar across different orders of mammals.
Fig. 6.
Dependence of maximal flow rates on average gland size. A: Neonatal pig nasal turbinate. B: Adult pig nasal turbinate. C: Ferret trachea. D: Mouse tracheolaryngeal region. E: Pig trachea. F: Sheep trachea. G: Human trachea. Flow rates are the sustained responses to carbachol obtained by Wine and colleagues (Joo et al., 2001; Choi et al., 2007; Ianowski et al., 2007; Cho et al., 2010, 2011). Gland sizes were calculated from data in this and other studies (Choi et al., 2000; Widdicombe et al., 2001; Cho et al., 2011). Line is best least-squares linear regression.
With an average gland density over the trachea as a whole of 0.22 per mm2, and an average volume per gland of 52 nL, the aggregate volume of glands for the trachea as a whole becomes 1.14 μL per cm2. This is about 6% of the corresponding value for humans (Choi et al., 2000).
In humans, glands disappear at about airway generations 8–10 (Whimster, 1986). These are the last of the cartilaginous airways, are ~1 mm in diameter, and occur at the entrance to the pulmonary lobules. It is important to remember, however, that the combined length of the first 8 or so airway generations is ~25 cm, whereas the length of the remaining 15 or so is only ~3 cm (Weibel, 1963). Glands are thus found deep in the human lung. In airways of pig and sheep, glands also disappear when airways reach about 1 mm internal diameter (Mariassy and Plopper, 1983; Ballard et al., 1995). In the ferret, glands can be found in airways of 0.5 mm internal diameter (see Fig. 5), corresponding to generations 5 and 6, and again deep into the lungs. Unfortunately, the detailed morphometry of ferret lung has not been described, but all the airways we studied were cartilaginous.
In conclusion, the ferret trachea contains glands that are considerably smaller and less frequent than in human trachea, resulting in the aggregate volume of glands per unit mucosal surface being only about one-sixth that in humans. It will be interesting to see if the relative lack of tracheobronchial glands in the CF ferret is associated with a milder pulmonary pathology than in human CF.
LITERATURE CITED
- Ballard ST, Fountain JD, Inglis SK, Corboz MR, Taylor AE. Chloride secretion across distal airway epithelium: relationship to submucosal gland distribution. Am J Physiol. 1995;268:L526–L531. doi: 10.1152/ajplung.1995.268.3.L526. [DOI] [PubMed] [Google Scholar]
- Cho HJ, Joo NS, Wine JJ. Mucus secretion from individual submucosal glands of the ferret trachea. Am J Physiol Lung Cell Mol Physiol. 2010;299:L124–L136. doi: 10.1152/ajplung.00049.2010. [DOI] [PMC free article] [PubMed] [Google Scholar]
- Cho HJ, Joo NS, Wine JJ. Defective fluid secretion from submucosal glands of nasal turbinates from CFTR−/− and CFTR (DeltaF508/DeltaF508) pigs. PLoS One. 2011;6:e24424-1–e24424-11. doi: 10.1371/journal.pone.0024424. [DOI] [PMC free article] [PubMed] [Google Scholar]
- Choi HK, Finkbeiner WE, Widdicombe JH. A comparative study of mammalian tracheal mucous glands. J Anat. 2000;197:361–372. doi: 10.1046/j.1469-7580.2000.19730361.x. [DOI] [PMC free article] [PubMed] [Google Scholar]
- Choi JY, Joo NS, Krouse ME, Wu JV, Robbins RC, Ianowski JP, Hanrahan JW, Wine JJ. Synergistic airway gland mucus secretion in response to vasoactive intestinal peptide and carbachol is lost in cystic fibrosis. J Clin Invest. 2007;117:3118–3127. doi: 10.1172/JCI31992. [DOI] [PMC free article] [PubMed] [Google Scholar]
- Guilbault C, Saeed Z, Downey GP, Radzioch D. Cystic fibrosis mouse models. Am J Respir Cell Mol Biol. 2007;36:1–7. doi: 10.1165/rcmb.2006-0184TR. [DOI] [PubMed] [Google Scholar]
- Ianowski JP, Choi JY, Wine JJ, Hanrahan JW. Mucus secretion by single tracheal submucosal glands from normal and cystic fibrosis transmembrane conductance regulator knockout mice. J Physiol. 2007;580:301–314. doi: 10.1113/jphysiol.2006.123653. [DOI] [PMC free article] [PubMed] [Google Scholar]
- Jayaraman S, Joo NS, Reitz B, Wine JJ, Verkman AS. Submucosal gland secretions in airways from cystic fibrosis patients have normal [Na(+)] and pH but elevated viscosity. Proc Natl Acad Sci USA. 2001;98:8119–8123. doi: 10.1073/pnas.131087598. [DOI] [PMC free article] [PubMed] [Google Scholar]
- Jiang C, Finkbeiner WE, Widdicombe JH, Miller SS. Fluid transport across cultures of human tracheal glands is altered in cystic fibrosis. J Physiol. 1997;501:637–647. doi: 10.1111/j.1469-7793.1997.637bm.x. [DOI] [PMC free article] [PubMed] [Google Scholar]
- Joo NS, Cho HJ, Khansaheb M, Wine JJ. Hyposecretion of fluid from tracheal submucosal glands of CFTR-deficient pigs. J Clin Invest. 2010;120:3161–3166. doi: 10.1172/JCI43466. [DOI] [PMC free article] [PubMed] [Google Scholar]
- Joo NS, Irokawa T, Wu JV, Robbins RC, Whyte RI, Wine JJ. Absent secretion to vasoactive intestinal peptide in cystic fibrosis airway glands. J Biol Chem. 2002a;277:50710–50715. doi: 10.1074/jbc.M208826200. [DOI] [PubMed] [Google Scholar]
- Joo NS, Saenz Y, Krouse ME, Wine JJ. Mucus secretion from single submucosal glands of pig. Stimulation by carbachol and vasoactive intestinal peptide. J Biol Chem. 2002b;277:28167–28175. doi: 10.1074/jbc.M202712200. [DOI] [PubMed] [Google Scholar]
- Joo NS, Wu JV, Krouse ME, Saenz Y, Wine JJ. Optical method for quantifying rates of mucus secretion from single submucosal glands. Am J Physiol. 2001;281:L458–L468. doi: 10.1152/ajplung.2001.281.2.L458. [DOI] [PubMed] [Google Scholar]
- Leigh MW, Gambling TM, Carson JL, Collier AM, Wood RE, Boat TF. Postnatal development of tracheal surface epithelium and submucosal glands in the ferret. Exp Lung Res. 1986;10:153–169. doi: 10.3109/01902148609061490. [DOI] [PubMed] [Google Scholar]
- Mariassy AT, Plopper CG. Tracheobronchial epithelium of the sheep: 1. Quantitative light-microscopic study of epithelial cell abundance, and distribution. Anat Rec. 1983;205:263–275. doi: 10.1002/ar.1092050304. [DOI] [PubMed] [Google Scholar]
- Ostedgaard LS, Meyerholz DK, Chen JH, Pezzulo AA, Karp PH, Rokhlina T, Ernst SE, Hanfland RA, Reznikov LR, Ludwig PS, Rogan MP, Davis GJ, Dohrn CL, Wohlford-Lenane C, Taft PJ, Rector MV, Hornick E, Nassar BS, Samuel M, Zhang Y, Richter SS, Uc A, Shilyansky J, Prather RS, McCray PB, Jr, Zabner J, Welsh MJ, Stoltz DA. The DeltaF508 mutation causes CFTR misprocessing and cystic fibrosis-like disease in pigs. Sci Transl Med. 2011;3:74ra24-1–74ra24-12. doi: 10.1126/scitranslmed.3001868. [DOI] [PMC free article] [PubMed] [Google Scholar]
- Stoltz DA, Meyerholz DK, Pezzulo AA, Ramachandran S, Rogan MP, Davis GJ, Hanfland RA, Wohlford-Lenane C, Dohrn CL, Bartlett JA, Nelson GA, Chang EH, Taft PJ, Ludwig PS, Estin M, Hornick EE, Launspach JL, Samuel M, Rokhlina T, Karp PH, Ostedgaard LS, Uc A, Starner TD, Horswill AR, Brogden KA, Prather RS, Richter SS, Shilyansky J, McCray PB, Jr, Zabner J, Welsh MJ. Cystic fibrosis pigs develop lung disease and exhibit defective bacterial eradication at birth. Sci Transl Med. 2010;2:29ra31-1–29ra31-8. doi: 10.1126/scitranslmed.3000928. [DOI] [PMC free article] [PubMed] [Google Scholar]
- Sturgess J, Imrie J. Quantitative evaluation of the development of tracheal submucosal glands in infants with cystic fibrosis and control infants. Am J Pathol. 1982;106:303–311. [PMC free article] [PubMed] [Google Scholar]
- Sun X, Sui H, Fisher JT, Yan Z, Liu X, Cho H-J, Joo NS, Zhang Y, Zhou W, Lei-Butters DC, Yi Y, Griffin MA, Naumann P, Luo M, Ascher J, Wang K, Wine JJ, Meyerholz DK, Engelhardt JF. Ferreting out cystic fibrosis disease biology in a new CFTR knockout model. J Clin Invest. 2010;120:289–297. doi: 10.1172/JCI43052. [DOI] [PMC free article] [PubMed] [Google Scholar]
- Sun X, Yan Z, Yi Y, Li Z, Lei D, Rogers CS, Chen J, Zhang Y, Welsh MJ, Leno GH, Engelhardt JF. Adeno-associated virus-targeted disruption of the CFTR gene in cloned ferrets. J Clin Invest. 2008;118:1578–1583. doi: 10.1172/JCI34599. [DOI] [PMC free article] [PubMed] [Google Scholar]
- Tos M. Development of the tracheal glands in man. Acta Pathol Microbiol Scand Suppl. 1966;185:1–130. [PubMed] [Google Scholar]
- Vawter GF, Shwachman H. Cystic fibrosis in adults: an autopsy study. Pathol Annu. 1979;14:357–382. [PubMed] [Google Scholar]
- Weibel ER. Morphometry of the human lung. Heidelberg: Springer-Verlag; 1963. [Google Scholar]
- Whimster WF. Number and mean volume of individual submucous glands in the human tracheobronchial tree. Appl Pathol. 1986;4:24–32. [PubMed] [Google Scholar]
- Widdicombe JH, Chen LL-K, Sporer H, Choi HK, Pecson IS, Bastacky SJ. Distribution of tracheal and laryngeal mucous glands in some rodents and the rabbit. J Anat. 2001;198:207–221. doi: 10.1046/j.1469-7580.2001.19820207.x. [DOI] [PMC free article] [PubMed] [Google Scholar]
- Widdicombe JH, Pecson IS. Distribution and numbers of mucous glands in the horse trachea. Equine Vet J. 2002;34:630–633. doi: 10.2746/042516402776180151. [DOI] [PubMed] [Google Scholar]
- Yamaya M, Finkbeiner WE, Widdicombe JH. Altered ion transport by tracheal glands in cystic fibrosis. Am J Physiol. 1991;261:L491–L494. doi: 10.1152/ajplung.1991.261.6.L491. [DOI] [PubMed] [Google Scholar]


