Abstract
Cells in the pituitary that synthesize luteinizing and follicle-stimulating hormones regulate the relative production of these two key reproductive hormones in response to signals from the hypothalamus. These signals are encoded in the frequency of gonadotrophin-releasing-hormone pulses. In vitro experiments with a murine-derived cell line have identified key elements of the processes that decode the signal to regulate transcription of the subunits encoding these hormones. The mathematical model described in this paper is based on the results of those experiments and advances quantitative understanding of the biochemical decoder. The model consists of non-linear differential equations for each of six processes that lead to the synthesis of follicle-stimulating hormone. Simulations of the model exhibit key characteristics found in the experiments, including a preference for follicle-stimulating hormone synthesis at low pulse frequencies and a loss of this characteristic when a mutation is introduced.
Keywords: Mathematical modeling, Control theory, Endocrinology, Cell signaling
1. Introduction
A thorough understanding of biological systems includes quantitative descriptions of the dynamics that lead to observed time-varying activity. Engineers describe system dynamics with differential equations [1], and these models are in turn used to understand and control complex electrical, chemical and mechanical processes. We are endeavoring to describe biological systems with the wealth of established tools that have enabled understanding of stability and performance in many human-created systems.
In this paper, we describe a model of how a pituitary cell type, the gonadotroph, produces one of the two key hormones by which it controls the menstrual cycle. These cells are an interesting case to model because their hormone production is controlled by a frequency- modulated chemical signal from the hypothalamus [2–6]. Our goal was to show how a network of simple biochemical processes can interact to decode the pulse frequency-coded signal. This model is rooted in experiments that characterized some of these processes [7–10]. The article includes a background on the physiology, derivation of the model equations, and simulation results with comparison to experimental results.
Both the model and the studies on which it is based characterize experiments performed in vitro using a murine gonadotroph-derived cell line [2–6]. The behavior of pituitary gonadotrophs in vivo involves responses to a far more complex environment – one that includes other endocrine and paracrine stimuli. Both the pulse-coded GnRH signaling mechanism and the response in the form of regulated gonadotropin subunit gene transcription are known to occur in mammals [2–6]. Thus the general characteristics of the behavior modeled here are not merely artifacts of the experimental arrangement.
The cellular mechanisms addressed by our model include the dynamics of signal transduction and gene transcription, with transcriptional activators and repressors competing for promoter sites. Chen et al. [11] found that a set of linear differential equations could describe transcription, translation, and associated feedback events. The model we describe uses similar differential equations, with nonlinear elements added as appropriate.
The model and its structure are motivated by long-term efforts to create a comprehensive model of the menstrual cycle and explain how component factors influence reproductive function. An influential model developed by Selgrade and colleagues [12, 13] has been extended by researchers at the Zuess Institute (Berlin, Germany) [14], and forms the basis for the menstrual cycle model in the text by Keener and Sneyd [15]. These models are structured as collections of coupled first-order ordinary differential equations. The model described below is similarly-structured and will be suitable for integration with these emerging models.
1.1. The hypothalamus signals pituitary gonadotrophs by modulating the frequency of GnRH pulses
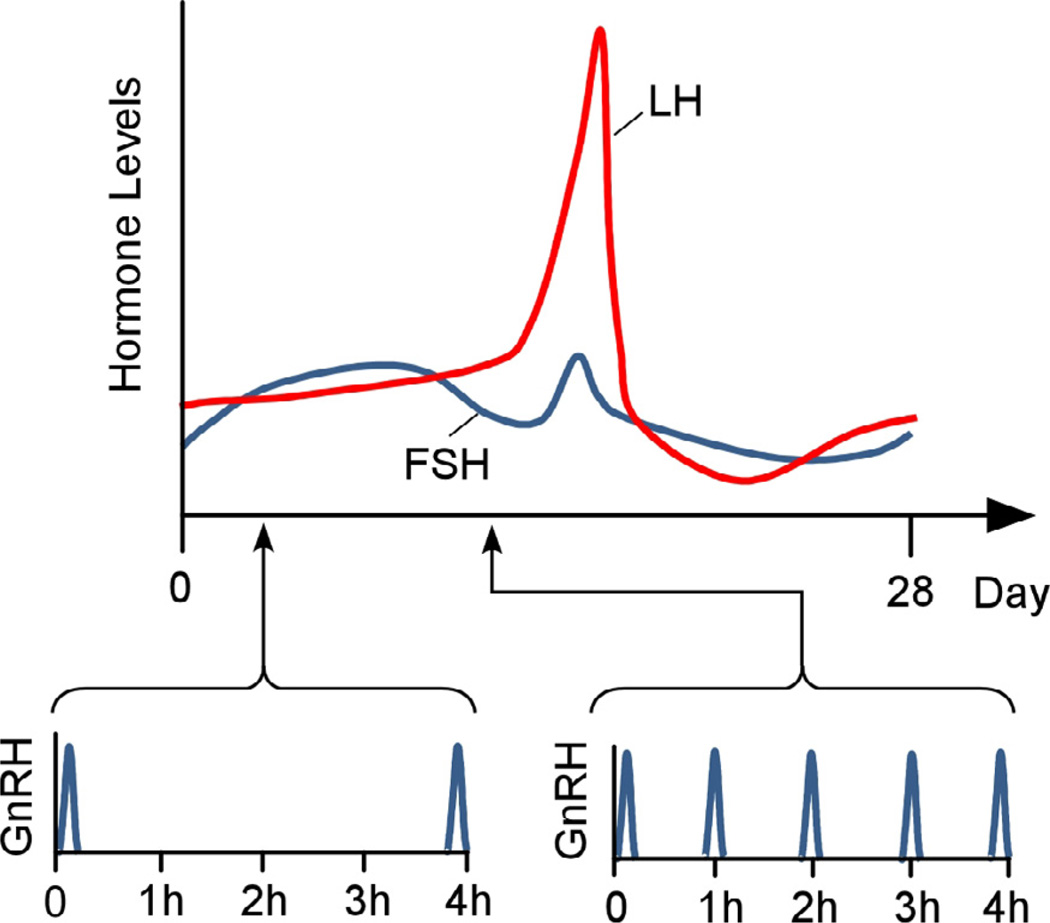
The hypothalamic neuropeptide, gonadotrophin-releasing-hormone (GnRH), signals to pituitary gonadotrophs to produce luteinizing hormone (LH) and follicle-stimulating hormone (FSH) at rates appropriate to phases of the menstrual and estrous cycle in humans and rodents, respectively [16–20]. As the model shown in Fig. 1 (derived from experimental measurements of FSH and LH across the human menstrual cycle) shows, the signal is encoded, at least in part, in the frequency of GnRH pulses secreted by the network of hypothalamic GnRH neurons from their axon terminals in the median eminence into hyperphysical portal vessels [2, 9, 16]. This capillary bed transports the GnRH pulse to the anterior pituitary gland, where the signal is decoded by the gonadotrophs [3].
Fig. 1.
Model based on experimental observations of the variation in FSH and LH across the menstrual cycle in association with measured changes in GnRH pulse frequencies [2, 9, 16].
In most mammals, low GnRH pulse frequencies favor FSH production over that of LH, while faster pulsing results in production of more LH and less FSH. The range of GnRH pulse frequencies released to modulate serum LH and FSH levels is species-dependent. In humans, the interval between pulses ranges from approximately 60–240 min [17], while in rodents the pulses are more frequent.
Experiments in vitro using the LβT2 murine pituitary gonadotrope- derived cell line [7–9] have identified some of the biochemical processes that enable decoding of the frequency into a hormone synthesis response. These experiments were conducted using GnRH pulse intervals ranging from 30 min to 120 min, to reflect the GnRH pulse frequencies that occur physiologically in rodents. They are the basis for the present model.
We have limited the model in this article to the production of FSHβ and the mechanisms by which increases in GnRH pulse frequency can lead to reduced FSH production compared to lower GnRH pulse frequencies. FSH is composed of two subunits, the common glycoprotein α-subunit (αGSU) and the biologically specific FSHβ subunit, each transcribed from a corresponding gene. αGSU is common to both LH and FSH and is produced in sufficient quantities that it does not limit production of the gonadotrophins. FSHβ transcription is the rate-limiting step in FSH production and subsequent release, demonstrated by good correlation between FSHβ mRNA levels and FSH production, secretion, and circulatory levels [2].
The cellular pulse frequency decoder ultimately modulates transcription of the gonadotrophin subunit genes, but many of the regulatory events along the signaling pathway are not yet understood. Walker et al. [21] discuss the possibilities that the regulation of the frequency-modulated response is the result of feedback occurring at the level of the signal transduction cascade within the cytoplasm, at the level of gene transcription within the nucleus, or both. The current model we propose takes both possibilities into account. The dynamics of the signaling cascade in the cytoplasm provide at least two pathways with different frequency responses that ultimately converge as competing elements at the gene promoter.
While the full suite of biochemical pathways has not been uncovered, we demonstrate that a system of simple dynamic elements representing the known processes can lead to the more complex pulse frequency decoding observed in the gonadotroph. This mathematical model includes six differential equations. In simulations described here, these are solved for cases matched to published experimental data.
GnRH-stimulated transcription of the FSHβ subunit is activated by the proximal promoter region of the FSHβ gene, close to the transcriptional start site. This GnRH-responsive element is a non-canonical cAMP response element (CRE) and serves as a recognition site for bZIP transcription factors including CRE binding protein (CREB), which anchor a series of proteins necessary to initiate transcription. CREB is present in the nucleus but can only initiate transcription when it has been phosphorylated [8, 22].
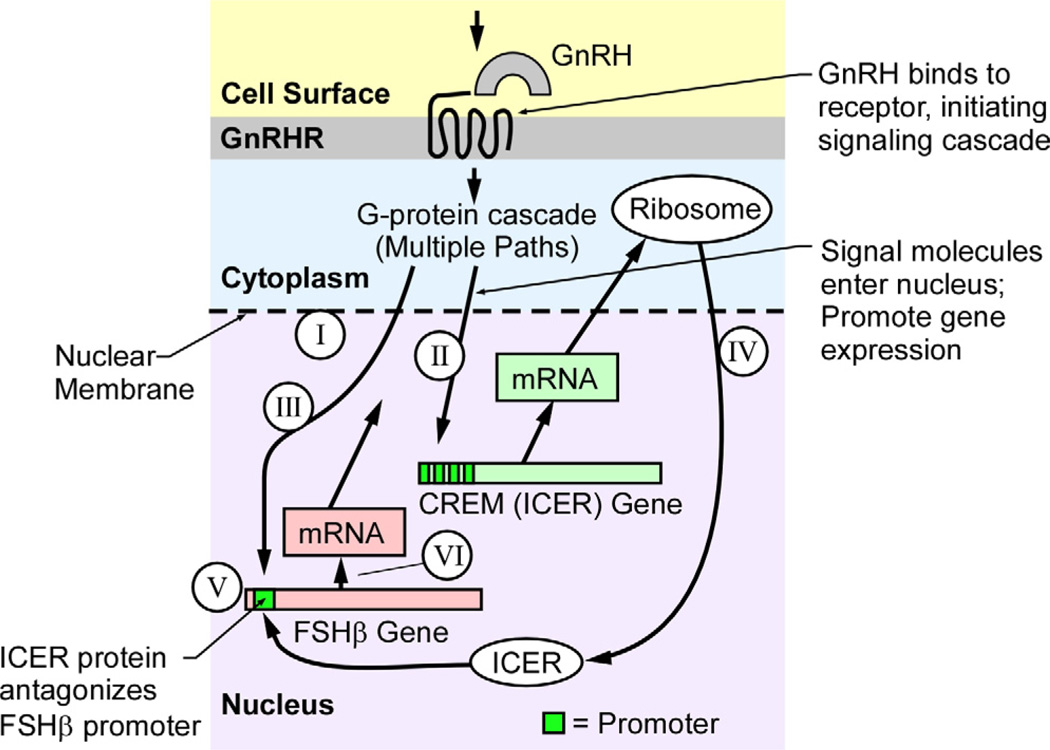
Subsets of proteins within the cAMP response element modulator (CREM) family are produced after the gonadotroph is exposed to GnRH (Fig. 2), including the inducible cAMP early repressor (ICER) proteins, which have the ability to bind to CRE sites. ICER competes with CREB for CRE binding, though ICER does not activate transcription [9, 23–25]. The repressor function of ICER is a significant mechanism for reducing FSHβ transcription at high GnRH pulse frequencies [9].
Fig. 2.
Pathways in the control of FSHβ production within the pituitary gonadotroph in response to GnRH. The hypothalamus produces the hormone GnRH, which binds to a G protein-coupled receptor on the surface of the gonadotroph. Several G protein-coupled pathways are involved in transmitting the GnRH signal to the nucleus to activate transcription of several genes. Among these are the FSHβ gene, modulated by GnRH pulse frequency through CREB phosphorylation, and induction of the CREM gene that encodes for the ICER family of proteins [2, 6, 22]. The circled Roman numerals relate the intracellular processes to the six process equations (Fig. 3).
2. Materials and methods
2.1. Structure of the model: gonadotrophs decode the pulse signal
The model’s signal flow diagram shown in Fig. 3 is based on the intracellular processes depicted in Fig. 2. The model input is the instantaneous level of GnRH in the region of corresponding GnRH receptors on the plasma membranes of gonadotrophs. Binding of GnRH to its receptor on the cell surface initiates an intracellular G protein-coupled signal transduction cascade, which in turn activates a network of signaling pathways, including the activation of kinases by phosphorylation. Portions of this network have been characterized, including activation of multiple kinases, release of intracellular stores of calcium as well as influx of extracellular calcium, and multiple feedback elements that deactivate earlier steps [6, 26].
Fig. 3.
Signal flow diagram for the model pulse frequency decoder in the gonadotroph. Roman numerals identify the processes, described below.
Washington et al. [27] described a detailed mathematical model of signaling in the gonadotroph to explain GnRH-LH dynamics. We have combined the detailed elements of two pathways through the cytoplasmic signaling network into two differential equations and have used them to model FSH synthesis. The resulting temporal response of signal transmission must provide frequency differentiation, but our model does not require that we identify the components of the signal pathways.
The half-life of 3 h for the most unstable members of the ICER family [24, 25], and 4-5 h for others, is too long to distinguish between 120-min and 30-min pulse frequencies. This suggests that the frequency-dependent component of the FSHβ transcriptional response occurs before ICER is produced, i.e., in the signaling cascade. We recognize that the degradation of ICER could also be regulated in response to GnRH pulsing, so the half-life could be substantially shorter than the 3–5 h measured in other systems, but have based the current model on a simpler construction wherein only the regulation of induction is included.
Processes I and II represent two pathways through the signaling network that lead, through processes III and IV, to activation of CREB and production of ICER. Process V models the competition of CREB and ICER for the CRE site, resulting in a calculation of FSHβ produced by the cell in Process VI.
In the model, each process is represented by one or more differential equations with continuous variables. The equations represent the response of a population of cells, not that of a single gene and promoter within a single cell. For example, a variable representing a CRE DNA binding domain should be interpreted as representing the fraction of cells in the population at which the CRE site is bound by CREB or ICER.
2.2. Nomenclature and symbols
2.2.1. State variables
| Symbol | Definition |
|---|---|
| MA | Cascade A terminus (output of G protein signal transduction pathway A) |
| MA+, MA− | Cascade A stimulatory and inhibitory factors |
| MB | Cascade B terminus (output of G protein signal transduction pathway B) |
| G | GnRH-activated receptors (input) |
| I | ICER level in nucleus |
| Cp | Phosphorylated CREB |
| P | Total FSHβ CRE promoter sites bound |
| PI | FSHβ CRE promoter sites bound by ICER |
| PC | FSHβ CRE promoter sites bound by pCREB |
| β | FSHβ subunits in cell |
2.2.2. Constants
| Symbol | Process | Value |
|---|---|---|
| KA+ | I | 0.1 min−1 |
| KA− | I | 0.01 min−1 |
| KG+ | I | 0.5 min−1 |
| KG− | I | 0.05 min−1 |
| KB | II | 0.004 min−1 |
| KC,A | III | 0.1 (arbs/arbs) min−1 |
| KC | III | 0.1 min−1 |
| kI | IV | 0.25 |
| νI | IV | 1.25 |
| α | V | 2 |
| KP | V | .25 |
| KP,CI | V | .05 |
| Kβ | VI | 0.0025 |
| L1 | III | .2 |
| L2 | III | 7 |
| L3 | V | 15 |
| L4 | V | 0.3 |
| L5 | V | 11.5 |
| L6 | V | 0.4 |
| L7 | V | 10 |
| L8 | V | 0.4 |
2.3. Model equations
2.3.1. Process I
The G protein signal transduction cascades that are activated following GnRH binding to its receptor involve a network of reactions [6, 28]. These include multiple pathways, sequential processes, feedback suppression and other components that enable signal transmission. In the present model, the cascade is separated into two parallel paths – designated A and B – with different characteristic time scales for transmission and depletion of signals.
Cascade A is the transmission from GnRH receptor to nuclear transcription factors that stimulate CREB phosphorylation and thereby activate FSHβ transcription. There is evidence that levels of pCREB are reduced at higher pulse frequencies compared to lower frequencies [29]. This suggests that the processes we have grouped into Cascade A also include a mechanism that reduces CREB phosphorylation under faster pulsing. The equations for Process I are a representation of two competing processes. We have chosen to represent the subsequent phosphorylation of CREB with a simple process, putting the more complex set of processes required to match the experimental data into the signaling cascade.
We represent this branch of the signal cascade with two first-order equations:
| (1) |
The equation implies two parts of Cascade A. One (MA+) has a stimulating effect on the cascade output MA while the other (MA−) has an inhibitory effect. Each is driven to increase at a rate proportional to the GnRH level. Absent additional stimulation, both MA+ and MA− decrease at a rate proportional to their respective levels. In this model, they are added to produce the cascade output. The output is subject to a floor at zero, so that there is no output when the inhibitory component is greater than stimulatory.
The parameters in equations in (1) were chosen so the pCREB levels reached in response to 30- and 120-min pulse intervals match experimental data. The parameters KA+ and KA− are determined largely by the pulse frequency range. The stimulatory process was assigned a time constant (1/KA+) of 10 min (half-life of 14.4 min) while the inhibitory process has a time-constant of 100 min (half life of 144 min). The pulses of phosphorylation thus decay quickly. The inhibitory element is active when the pulses are separated by less than 100 min. KG+ and KG− set the relative amplitudes for pCREB pulses at the two intervals, though the absolute values of these parameters is arbitrary because concentrations are not in physically meaningful units.
2.3.2. Process II
Cascade B is parallel to A, but leads to factors that promote transcription and translation of ICER. The mathematical representation of Cascade B is simpler, though, represented by a single first-order equation:
| (2) |
The parameter KB was adjusted to achieve relative ICER and FSHβ levels that match the experimental results. The chosen value was KB = 0.004/min, resulting in a time constant of 250 min and a half-life of 173 min.
2.3.3. Process III
Process III is the phosphorylation of CREB. In this model, the temporal characteristics of CREB phosphorylation are inherited from those of Cascade A. Phosphorylation and its reverse are represented by a simple first-order lag:
| (3) |
The rate of increase of phosphorylation is proportional to MA, while dephosphorylation of pCREB is proportional to the instantaneous level of pCREB. That is, pCREB decays exponentially.
Experimental measurements of CREB phosphorylation in response to GnRH pulses include measurements at 5, 10, and 15 min after a pulse [29]. From those measurements, we estimated the coefficient KC to be 0.1 min−1resulting in a decay time constant of 10 min or a half-life of 7 min.
2.3.4. Process IV
Process IV represents the production of ICER. There are several steps in the synthesis of ICER and its transport into the nucleus where it can modulate FSHβ transcription. ICER production is modeled here with a single equation describing the level of ICER protein in the nucleus, though it implicitly includes transcription, translation, and post-translational transport into the nucleus. The specific pathway through which GnRH stimulates ICER has not been identified. In this model, the production rate of ICER is a function of the signal produced by Process II.
Based on the results of Bintu et al. [30], we use a logistic function to describe ICER transcription in response to MB. In fact, all transcription events modeled in this paper use these dose/response characteristics. The authors of that paper show through statistical mechanics that the probability of promoter occupation can be described by such a curve.
The differential equation that models ICER production is
| (4) |
and
| (5) |
The first term on the right-hand side of Eq. (4) is the input term that causes ICER production (QI is a logistic function of MB). The second term represents the removal of ICER according to Michaelis– Menten enzyme kinetics. The net rate of increase of ICER is the difference between the effect of MB driving ICER production and the rate of breakdown or removal of ICER.
In simulations, we also tested linear removal (proportional to I) and determined that the change had little effect as long as the decay time was about the same as that for the Michaelis–Menten model.
The parameters L1 and L2 were set so that the level of MB was near the lower saturation of the logistic regression at low pulse frequencies, and just above upper saturation at high pulse frequencies. The result is low ICER levels at low pulse rates, and high ICER with limited amplitude for high pulse frequencies.
The Michaelis–Menten parameters were chosen so that the half-life of ICER is between 4 and 5 h, consistent with published in vitro measurements of ICER decay [24, 25]. Those measurements were made under different conditions and may not represent the dynamics within a gonadotroph in response to pulsatile GnRH stimulation, but more appropriate experimental data are not available.
2.3.5. Process V
Process V represents occupation of the FSHβ promoter and thus the competition of ICER and pCREB for the site. It consists of two equations representing the kinetics of the two transcription factors.
| (6) |
and
| (7) |
In this equation, promoter activity is driven by the concentrations of ICER and pCREB. There are several other possible occupying molecules, including non-phosphorylated CREB and other bZIP proteins, but they are not represented in this simple model. The actual rate at which each factor occupies the CRE sites is proportional to the product of the number of available sites and a logistic function of the factor. The logistic functions are
| (8) |
The total number of occupied CRE sites is:
| (9) |
The conditional term establishes a maximum level for promoter binding, i.e., a finite number of available sites in the population of cells. The first term on the right-hand side of (6) and (7) represents the release of bound sites. The input term QPC (and hence P) has a small nonzero value when its input (CP) is zero. This results in transcription of FSHβ (basal transcription rate) when there is no GnRH input.
KP,CI was chosen to smooth the resulting FSHβ response. It was set to 0.05, giving Process V a characteristic time constant of 20 min. The parameter α indicates the relative capacity of pCREB and ICER to bind at the promoter. A value of α greater than 1 indicates that ICER has a stronger affinity for the promoter than pCREB. It (α) was adjusted to give the proper relative response at 30 and 120 min pulse intervals. KP was adjusted relative to KP,CI to yield a peak occupation of CRE sites close to 1, the normalized maximum number of promoters. In the simulations described below, KP was 5*KP,CI.
2.3.6. Process VI
The final process represents several steps in the production of FSH, including transcription and translation. The input is occupation of the promoter by the transcription activator, and the output of the process is the FSHβ subunits. The process equation is:
| (10) |
and
| (11) |
The rate of production is controlled largely by PC, the number of promoter sites bound by pCREB. However, FSHβ responds to administration of GnRH even when a mutation that prevents CREB or ICER binding is introduced in the CRE site within the promoter. The response is considerably weaker than when the CRE site is intact. The mechanism for this is not yet completely understood, but there are several additional sites within the promoter that could bind transcription factors. Eq. (10) includes a term, QGthrough which FSHβ transcription responds to GnRH. For simplicity, the response is tied to Path A of the G protein cascade, though this should not be interpreted as an assertion of a specific mechanism or pathway for CRE-independent response to GnRH. The third term results in exponential decay of the FSHβ that has already been produced.
3. Simulation results
The model just described was implemented in MATLAB/Simulink (The Math Works, Natick, MA). The differential equations were solved with the 4th/5th-order Runge–Kutta [31] solver, ode45.
The logistic functions for processes II and V, and VI are shown in Fig. 4. Process descriptions above gave parameter values for the simulation and discussed the way they were determined. The absolute values of the variables are reported in arbitrary units, but relative levels and absolute time scales are meaningful. The variables can be easily scaled to match in vivo or in vitro units.
Fig. 4.
Logistic functions are used to represent the response to a factor when binding to a gene promoter is involved. This includes binding to the CREM gene promoter represented by QI, the FSHβ promoter by QPC, the inhibitory binding of ICER to the FSHβ promoter by QIC, and the binding of an unidentified GnRH-responsive molecule to another region of the FSHβ promoter by QG.
3.1. Published experiments can be repeated virtually in our simulation
To test the validity of the model, we applied GnRH input signals identical to the inputs used in cell culture perfusion experiments [9]. These experiments were conducted in the murine gonadotroph- derived LβT2 cell line. The experiments involved stimulation with 5-min, 10 nM GnRH pulses at intervals of 30 min or 120 min. In these experiments, as in live animals, FSHβ was produced in higher concentrations at the lower pulse frequency. Also, the pCREB levels reached in response to pulsatile GnRH at 30-min pulse intervals were lower than for 120-min intervals. After introducing a mutation into the cyclic AMP response element (CRE) in the FSHβ gene promoter, which abrogated both CREB and ICER binding, the preferential FSHβ expression at lower pulse frequencies was lost. We sought to show that the model exhibits these three behaviors.
The model equations characterize FSHβ gene expression. The experiments assessed relative levels of production using luciferase as a reporter. The dynamics of luciferase (e.g., half-life) should not influence these results, because the measurements were made in a steady-state pulsed condition at a fixed time (20 min) after the final pulse. So, though the absolute levels of luciferase activity could be lower than immediately at the end of the last pulse, the ratio of two different cases is unaffected by the decay dynamics of the reporter.
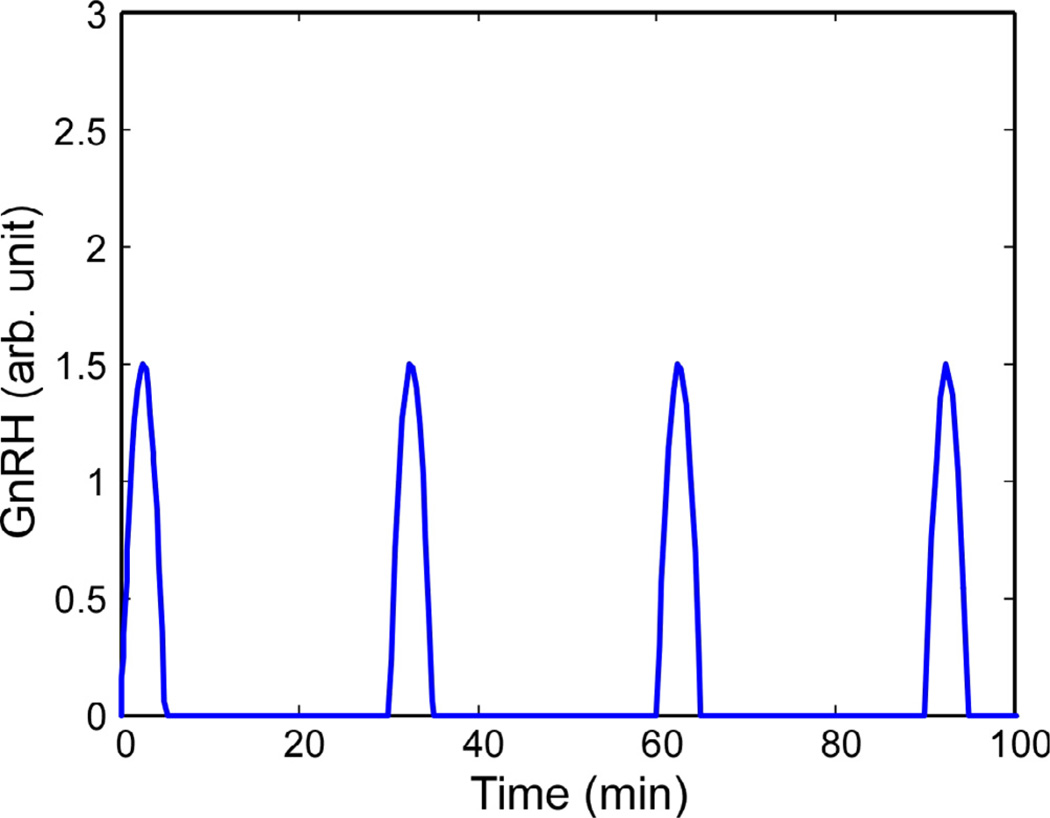
First, two different simulations were compared: one with 120- min interval pulses of GnRH and one with 30-min pulse intervals. The pulse duration was 5 min in all cases – the same as that used in the experiments by Ciccone et al. [9] – and the pulse shape was a half-cycle of a cosine function (See Fig. 5). This smooth pulse shape was used instead of a square pulse because dilution of the GnRH in the experimental culture media also tapers the pulse shapes.
Fig. 5.
GnRH pulses, separated by 120 min or 30 min, are the input to the model.
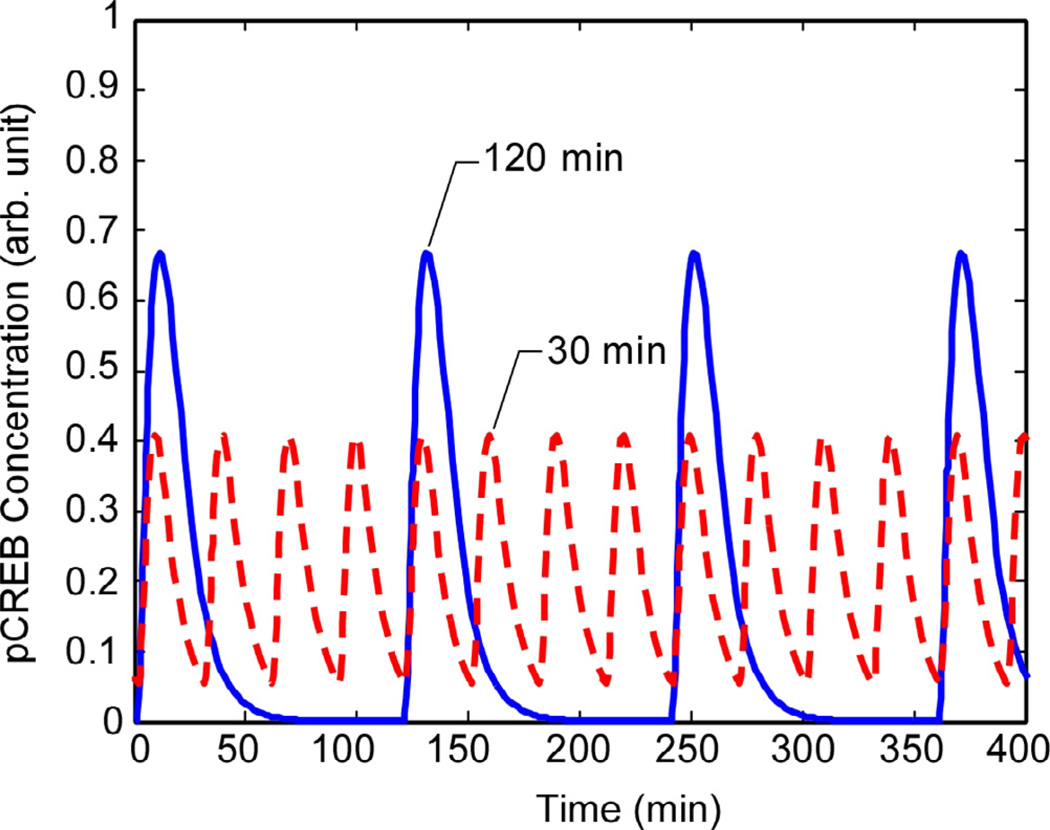
Figs. 6 and 7 show how pCREB pulse amplitudes are reduced at fast pulse frequencies. In the simulation, the effect is produced entirely in the signal Path A, with the phosphorylation process responding with the same characteristics. The mean levels of the pCREB are higher, though, at the faster pulse rate.
Fig. 6.
Cascade terminus signals for Path A are shown at two different GnRH pulse intervals. The faster pulsing rate results in lower pulse amplitudes of the signal pathway activated in Path A, a characteristic observed experimentally in the pCREB response and in Fig. 7.
Fig. 7.
CREB phosphorylation decays after each pulse so the pulse shape is preserved in the pCREB trace. The peak levels of pCREB during each pulse are lower at shorter pulse intervals, but the mean level is higher at short intervals than long intervals.
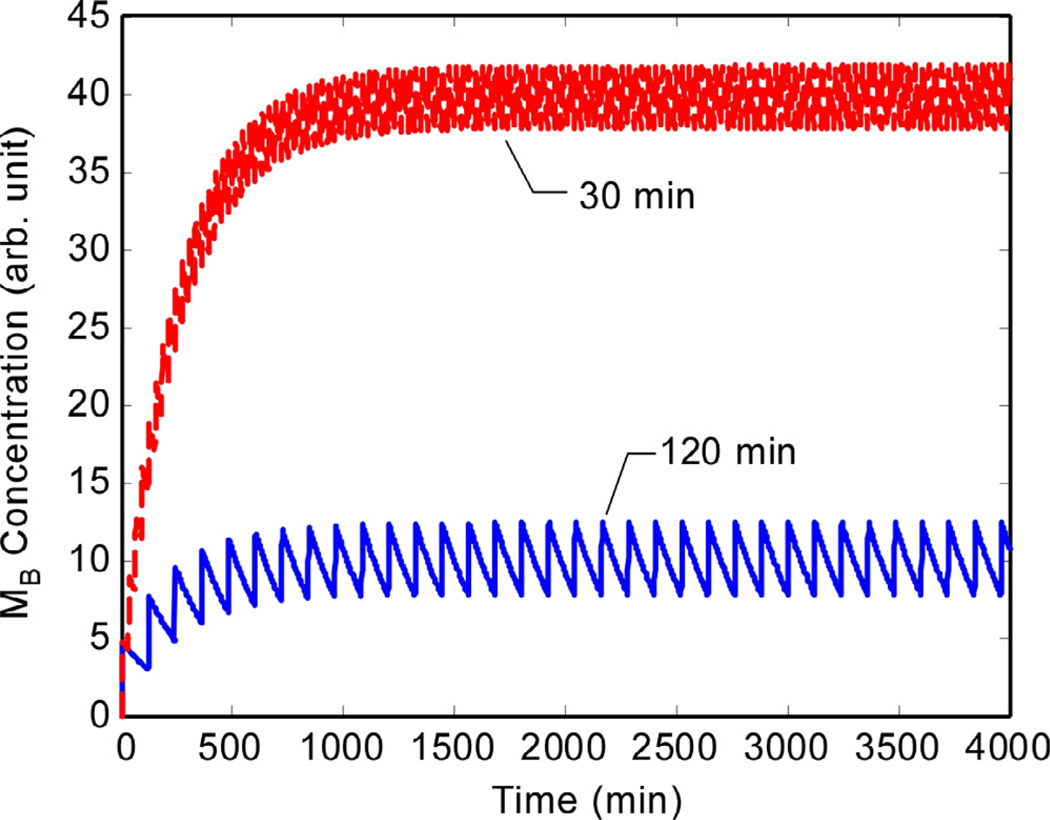
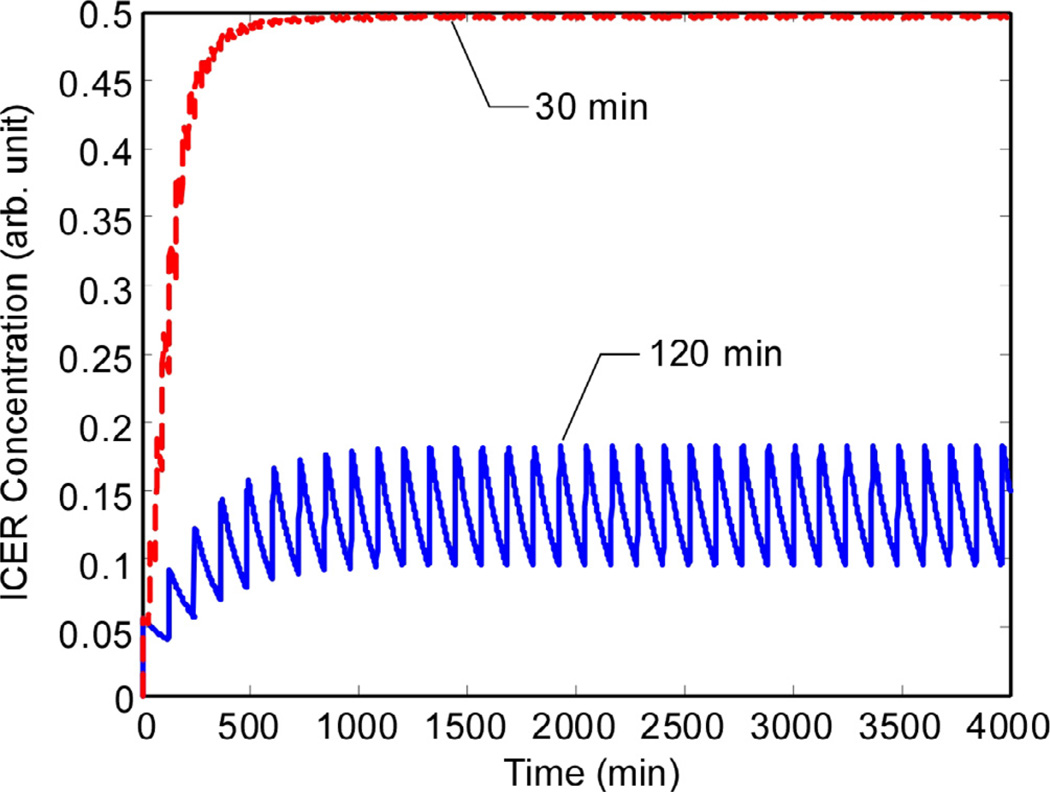
Fig. 8 shows how MB responds to pulsatile GnRH input at the two pulse frequencies. With longer times between pulses, the level of MB decays between pulses, resulting in a lower mean level than in response to shorter pulse intervals. Consequently, as shown in Fig. 9, the ICER levels are much lower for long pulse intervals than for short pulse intervals.
Fig. 8.
MB is produced at higher rates when the GnRH pulses are at shorter intervals. This leads to higher ICER levels at shorter pulse intervals. (Vertical axis is in arbitrary units.).
Fig. 9.
ICER levels decay substantially between pulses separated by 120 min, but not when the pulse interval is only 30 min. (Vertical axis is in arbitrary units.).
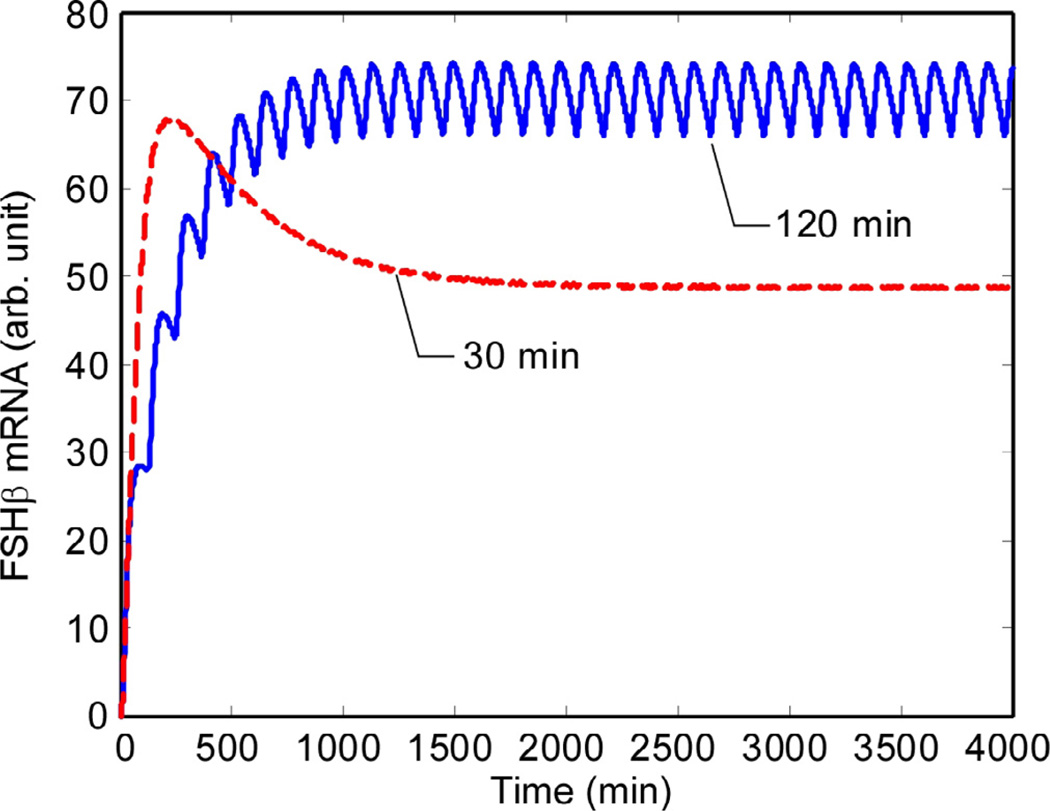
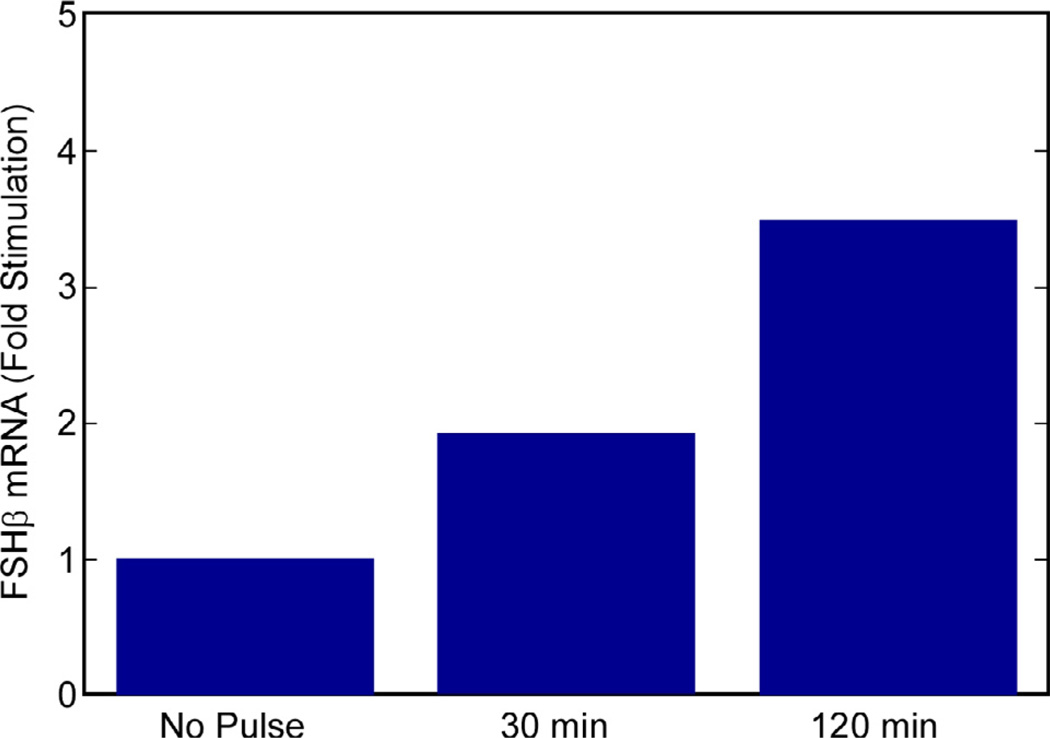
The final result of the simulation – FSHβ synthesis – is shown in Figs. 10 and 11. In the steady state, there is a 42% higher rate of FSHβ gene expression at the 120-min pulse interval in comparison to 30-min interval.
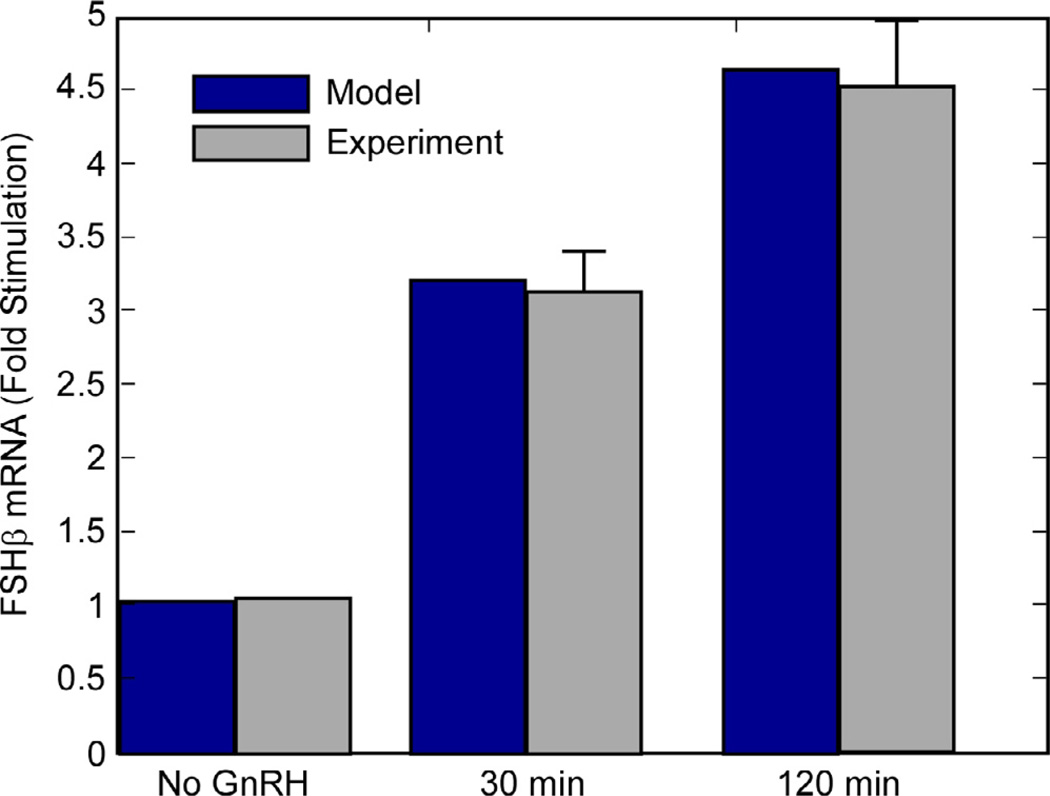
The results reported in Ciccone et al. (Fig. 1A in [9]) were not a time series but were measurements of total FSHβ luciferase reporter levels twenty minutes after the final pulse. This measurement was made after 20 h of pulsatile GnRH stimulation. For comparison with experimental results (Fig. 3 in [9]), Fig. 11 shows the predicted levels of FSHβ mRNA 20 min after a pulse during the steady- state period. Like the time series, the graph in Fig. 11 indicates a ratio of 1.42:1 after slow GnRH pulsing compared to fast pulsing.
3.2. Simulated mutation at the CRE site
Ciccone et al. reported on the effect of a mutation introduced at the CRE site in the FSHβ gene promoter where ICER binds. The mutation prevents effective binding of both CREB and ICER at this site and the result is the loss of preferential FSHβ synthesis at lower pulse frequencies.
We simulated the mutation by setting PC = 0 in Eq. (10).
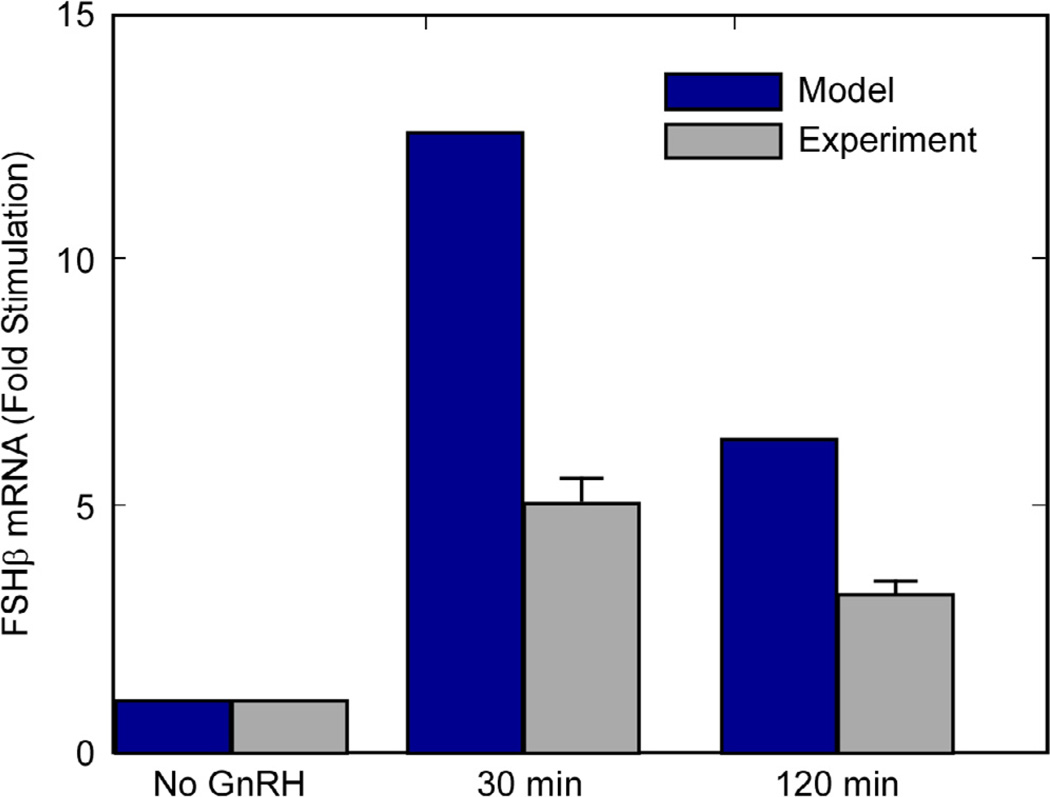
The simulated mutation results in a loss of preferential stimulation of FSHβ at lower frequencies. The model parameters for the wild-type FSHβ were based on the experimental data, so both simulation and experiment had FSHβ mRNA levels that were 42% higher at 120-min pulses than at 30-min pulses. In contrast, the model with the simulated mutation exhibited a 33% lower level of FSHβ mRNA synthesis at 120-min pulsing than at 30-min pulsing. The experimental measurements with mutated FSHβ CRE site had a 39% lower level of FSHβ mRNA synthesis at 120-min pulsing than at 30-min pulsing. The results of the mutation in simulation and experiment can be seen in Fig. 12. The absolute levels of FSHβ mRNA are different between experiments and simulations when expressed as a fold-increase over the no-GnRH case. The trend, however, is the same. The preferential synthesis of FSHβ mRNA at lower frequencies has been lost and the synthesis at the 120- min pulse interval is 33% (model) or 39% (experiment) lower than at 30-min pulses.
3.3. Dose and frequency effects
Because the pulse amplitude and width was the same across the range of pulse frequencies simulated, the total dose for 30-min interval pulsing is four times the total dose for 120-min intervals. Experimentally, the effect was shown to be one of frequency rather than total dose [7]. Regardless of whether the pulses were administered as a 10nM GnRH solution for both pulse rates, or the 120- min pulses used a 20 nM and the 30-min pulses a 5 nM GnRH solution, the FSHβ transcription was higher at the lower pulse frequency in both cases.
A similar virtual experiment showed that the model also responds largely to pulse frequency. The demonstration entailed a doubling of the concentration of GnRH (compared to the previous simulations) for 120-min-interval pulses and reduction of GnRH by half for the 30-min pulse intervals. Thus, the pulses at 30 min had the same duration as those at 120 min, but they carried 25% of the GnRH, so the total cumulative GnRH dose was constant. Fig. 13 contains a bar graph showing that, while the absolute levels of FSHβ mRNA are slightly changed from the fixed-concentration case, the trend of more FSH production at lower pulse frequency persists.
3.4. Predictions of frequency response and phase delay
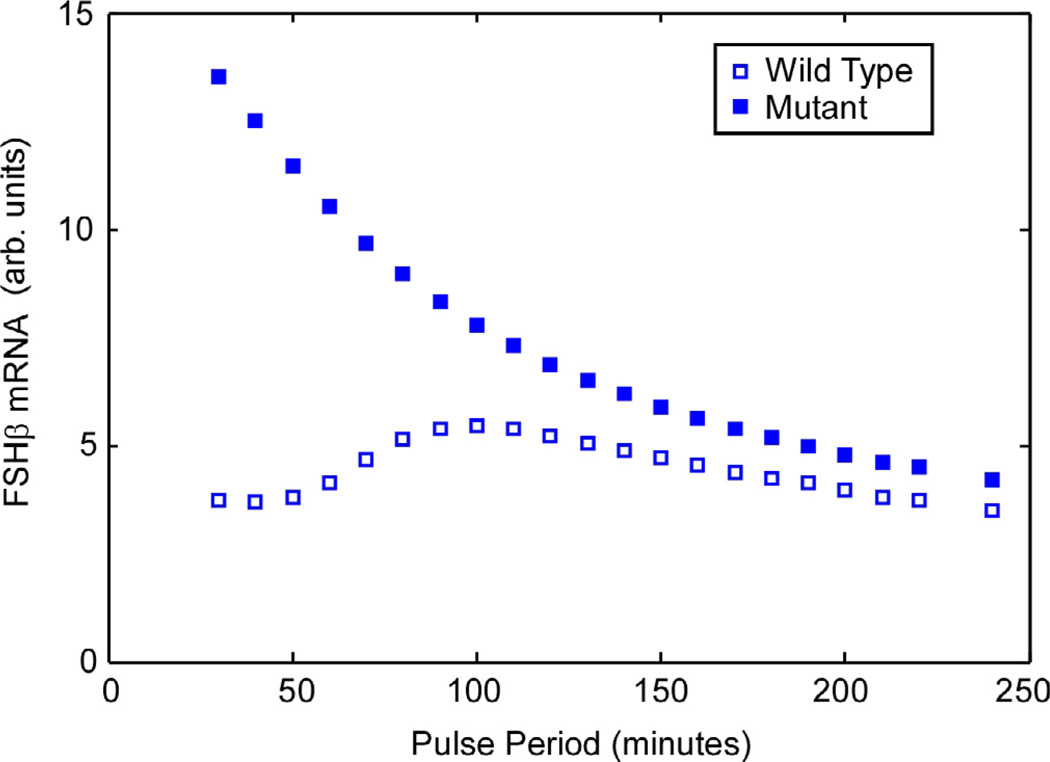
After simulation of previously published experiments, we computed the response of our model across a range of pulse intervals from a 30-min pulse interval to a 250-min pulse interval. For each pulse interval, we simulated the response for 4000 min and averaged the last 1500 minutes to construct the plot in Fig. 14. The plot includes the frequency response curves for both cells carrying the wild-type FSHβ gene promoter and cells carrying the FSHβ gene with the CRE-site mutation mentioned previously.
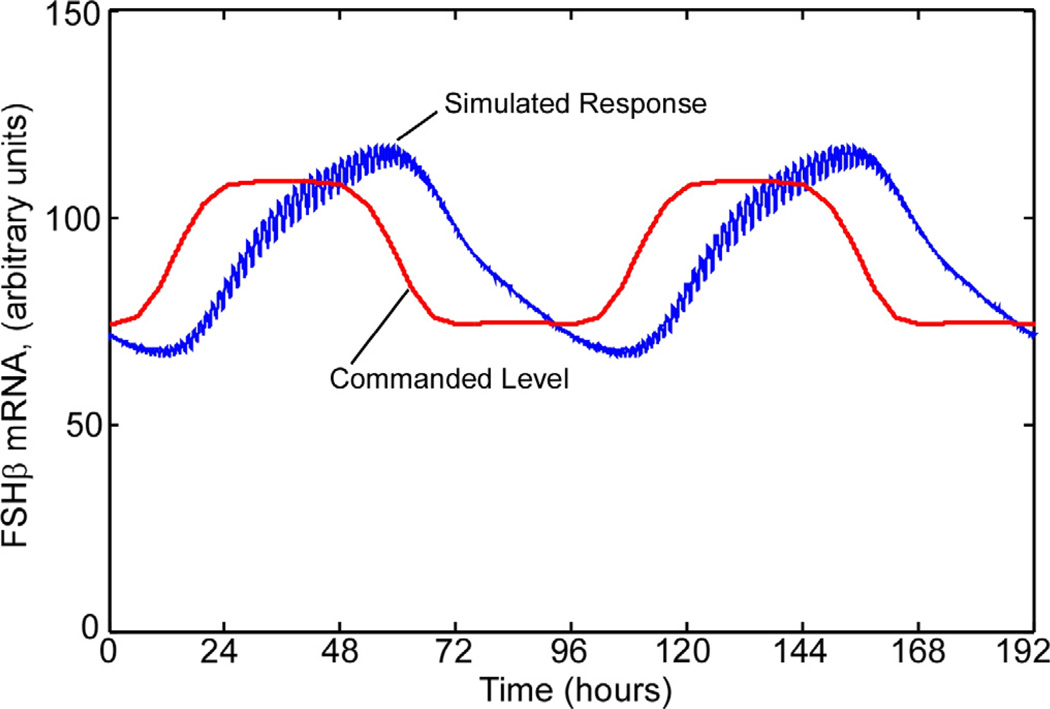
During the course of an estrous cycle, the pulse interval cycles between the minimum and maximum values, though the pulse interval profile for an entire cycle has not been recorded. To simulate the rat estrous cycle with this model, the pulse interval was cycled sinusoidally, with a 96-h period, between 30 and 100 min. That is, between the fastest pulse interval from the experiments and the maximum response interval from Fig. 14. The results are shown in Fig. 15. The red trace indicates the steady-state FSHβ mRNA level corresponding to the instantaneous pulse interval. The blue trace, showing the FSHβ mRNA level computed in the simulation, lags the equivalent steady-state level by 90 degrees, or 24 h.
4. Discussion
The simulations produced a set of outputs that are consistent with experimental data, though the experiments have not yet measured all of the signals in the simulations. Furthermore, we know that other processes influence FSHβ gene expression in response to GnRH stimulation and other GnRH-independent stimuli. Nonetheless, the simulations of our model show how a cascade of simple, realistic, physically-meaningful elements can decode the frequency of a pulsed molecular signal and synthesize proteins accordingly.
The simulation is supported by data from several cell culture experiments, with three components of cellular response to pulse frequency matching the experiments well. First, both FSHβ mRNA levels and the activity of a luciferase reporter under control of the FSHβ promoter are higher when the pulse frequency is lower. Also, the pCREB pulse amplitudes at 30-min pulse intervals are lower than for 120-min intervals. Finally, the mutation of the site where ICER binds the CRE in the response element results in loss of preference for FSHβ synthesis at lower pulse frequencies.
At the heart of the frequency differentiation is the modulation of ICER levels, shown in Fig. 9. In response to a GnRH pulse, signal transduction pathway B is activated and, ultimately, ICER is produced. The magnitude of activity in the cascade (MB) increases during a GnRH pulse. Following the pulse, MB begins to decay immediately, reaching near zero levels at about 100 minutes after the pulse. If a new pulse begins during this interval, the newly-synthesized signaling molecules add to those remaining after the previous pulse. So, at intervals shorter than the 100-min decay time, the mean ICER level rises above the low-frequency pulse level.
Mean pCREB levels in this model are higher when GnRH pulses are spaced at shorter intervals. This occurs despite the higher pCREB pulse amplitude for the longer-interval GnRH pulses. It is the rise of ICER levels at higher GnRH pulse frequencies that modulates FSHβ transcription.
Figs. 10 and 11 contain the key results of the model – that FSHβ production is attenuated at higher GnRH pulse frequencies. At 120- min pulse intervals, the FSHβ production is 1.42 times its level with 30-min intervals. This is consistent with Fig. 1 in Ref. [9]. Fig. 11 displays the predicted cellular levels of FSHβ as a bar graph, with measurements taken 20 min after a pulse in the steady state part of the plots in Fig. 10. The basal FSHβ is shown. It was calculated by running the simulation with no GnRH input. The levels are reported as ‘fold increases’ over this. Figs. 11 and 13 (the conserved- dose simulation), taken together, show that the observed relationship between pulse interval and FSH concentration is indeed a response to the frequency, not the total GnRH delivered.
Fig. 10.
Consistent with experimental measurements, the simulation yields about 42% more FSHβ at 120-min interval pulses than it does when the GnRH pulses are spaced at 30-min. The experiment actually measured the luminescence of a luciferase reporter driven by the FSHβ promoter. (Vertical axis is in arbitrary units.).
Fig. 11.
Ciccone et al. [9] reported luminescence of luciferase driven by the FSHβ promoter, measured 20 min after the final pulse in 20-h experiments. An identical ‘virtual experiment’ conducted with the simulation showed FSHβ mRNA levels in approximately the same ratio (1.42:1) as luciferase levels measured in the actual experiment.
Fig. 13.
When the total GnRH dose is the same for the two pulse rates, the model still exhibits the same trend in FSHβ mRNA with frequency.
In both experiment and simulation, a mutation was introduced to the CRE (where both CREB and ICER bind) in the FSHβ promoter. Both the experimental and simulated results show a loss of preferential stimulation of FSHβ at lower GnRH pulse frequencies. In the simulation, this is facilitated by the additional pathway introduced in process VI, represented by QG in Eq. (10). In fact, this pathway was incorporated into the model because when the CRE site is made inactive, the pCREB and ICER factors could not influence transcription through this CRE site, yet the experiments still demonstrated some persistent GnRH-dependent transcription.
When the mutation is introduced, the simulation of the 30-min pulse interval yielded more FSHβ mRNA than the 120-min interval. This is a reversal of the frequency dependence of the wild-type FSHβ and is the same trend observed in the mutation experiment. The ratio of FSHβ mRNA at the two pulse intervals is similar in the experiment and simulation of the mutation, though absolute fold-increases over the case with no GnRH are different for the experiment and the model.
Once the model was tested against the experimental measurements, it was used to explore transient behavior of the simulated gonadotroph. The comparison to experimental data showed the response at only two frequencies. The frequency response plot in Fig. 14 shows the response over a broader range of pulse intervals. The simulation exhibits a smooth amplitude response across the plotted range (a factor of eight in pulse period), and has a maximum at 100 min pulse interval. The peak location depends on the GnRH pulse amplitude. For example, in additional simulations (not shown), a reduction in amplitude of 30% reduced the peak location to 70 min pulse interval.
The bar graph in Fig. 11 shows how the decoding process responds to a steady pulsing of GnRH, but the response just after a pulse train begins or changes frequency are quite different from the steady levels. This is interesting because it provides a means of phase or time lag at the long time scale. In general, periodic oscillators consist of a feedback-loop with phase lag in some elements, such that the total phase lag around the loop at the oscillation frequency is 180 degrees. Identifying sources of phase lag is essential to understanding how the frequency of the menstrual cycle is established. Measurements of pulse frequency at various points in the human menstrual cycle show that FSH levels do not exhibit instant changes in level when pulse frequency changes. This is especially clear with the pulse frequency acceleration at the luteal-follicular transition.
The present model exhibits a lag as a result of the required ICER accumulation, as can be seen in the startup transient in Fig 10 and the cyclic response in Fig. 15. We do not yet have transient measurements in the gonadotroph against which to compare this characteristic of the model, though the 20-h duration for the experiments was chosen because experiments showed that to be the minimum time to reach a steady state [7]. In that sense, the lag predicted by the simulation is consistent with experience in the cell line. These results, together with the importance of phase lag in setting overall estrous or menstrual cycle duration, suggests a new line of experiments to advance the model, wherein the pulse interval would be cycled over the range of interest (30–120 minutes) and the response observed.
5. Conclusions
Prior experiments in cultures of a murine pituitary gonadotroph- derived cell line identified several mechanisms and molecules that shape the FSH response to GnRH pulse frequency. The dynamic interactions of these components must be structured in a way that produces the observed temporal response. The model described here is an attempt to understand the kinds of structured relationships that are required, describing the relationships with a set of nonlinear, first-order differential equations. While validation is not definitive, the results show that a simple interaction of a few processes can produce the observed physiological output that governs intermittent FSHβ transcription and subsequent FSH release in response to pulsatile GnRH input.
Fig. 12.
When a simulated mutation is introduced at the CRE site where CREB and ICER bind, there is a loss of preferential induction of FSHβ at the long GnRH pulse intervals. The same trend is seen in the experiment, though the fold-increases for the pulsed cases are about half that indicated in the simulation.
Fig. 14.
Based on the model, the GnRH pulse frequency response of FSHβ is predicted to be maximal at a pulse interval of 100 min.
Fig. 15.
To simulate the rat estrous cycle, the pulse period was cycled with a 96-h period. The red trace indicates the steady-state FSH mRNA level corresponding to the instantaneous pulse frequency. The blue trace, showing the computed FSH mRNA level, lags the equivalent steady-state level by 90 degrees, or 24 h.
Abbreviations
- CRE
cAMP response element, a site in a gene promoter associated with the response to cyclic adenosine monophosphate (cAMP)
- CREB
CRE binding protein, a transcription factor that binds to a CRE site, modulating transcription of the associated gene
- CREM
gene that codes for the ICER family of proteins
- SH
follicle-stimulating hormone, a hormone produced by the pituitary that promotes the growth and development of follicles. The hormone is composed of two subunits, α and β
- GnRH
gonadotrophin-releasing-hormone
- ICER
inducible cAMP early repressor, a protein involved in the regulation of FSHβ transcription
- LH
luteinizing hormone, a hormone produced by the pituitary that triggers ovulation.
References
- 1.Ogata K. System Dynamics. 4th ed. Prentice-Hall: 2003. [Google Scholar]
- 2.Ciccone NA, Kaiser UB. The biology of gonadotroph regulation. Curr. Opin. Endocrinol. Diabetes Obes. 2009;16(4):321. doi: 10.1097/MED.0b013e32832d88fb. [DOI] [PMC free article] [PubMed] [Google Scholar]
- 3.Maeda K-i, Ohkura S, Uenoyama Y, Wakabayashi Y, Oka Y, Tsukamura H, Okamura H. Neurobiological mechanisms underlying GnRH pulse generation by the hypothalamus. Brain Res. 2010;1364:103–115. doi: 10.1016/j.brainres.2010.10.026. [DOI] [PubMed] [Google Scholar]
- 4.Khadra A, Li Y-X. A model for the pulsatile secretion of gonadotropin-releasing hormone from synchronized hypothalamic neurons. Biophys. J. 2006;91(1):74. doi: 10.1529/biophysj.105.080630. [DOI] [PMC free article] [PubMed] [Google Scholar]
- 5.Li Y-X, Khadra A. Robust synchrony and rhythmogenesis in endocrine neurons via autocrine regulations in vitro and in vivo. Bull. Math. Biol. 2008;70(8):2103. doi: 10.1007/s11538-008-9328-z. [DOI] [PubMed] [Google Scholar]
- 6.Ferris HA, Shupnik MA. Mechanisms for pulsatile regulation of the gonadotropin subunit genes by GNRH1. Biol. Reprod. 2006;74(6):993. doi: 10.1095/biolreprod.105.049049. [DOI] [PubMed] [Google Scholar]
- 7.Bedecarrats GY, Kaiser U. Differential regulation of gonadotropin subunit gene promoter activity by pulsatile gonadotropin-releasing hormone (GnRH) in perifused LbetaT2 cells: role of GnRH receptor concentration. Endocrinology. 2003;144(5):1802. doi: 10.1210/en.2002-221140. [DOI] [PubMed] [Google Scholar]
- 8.Ciccone NA, Lacza CT, Hou MY, Gregory SJ, Kam KY, Xu S, Kaiser UB. A composite element that binds basic helix loop helix and basic leucine zipper transcription factors is important for gonadotropin-releasing hormone regulation of the follicle-stimulating hormone gene. Mol. Endocrinol. 2008;22(8):1908. doi: 10.1210/me.2007-0455. [DOI] [PMC free article] [PubMed] [Google Scholar]
- 9.Ciccone NA, Xu S, Lacza CT, Carroll RS, Kaiser UB. Frequency-dependent regulation of follicle-stimulating hormone by pulsatile gonadotropin-releasing hormone is mediated by functional antagonism of bZIP transcription factors. Mol. Cell. Biol. 2010;30(4):1028. doi: 10.1128/MCB.00848-09. [DOI] [PMC free article] [PubMed] [Google Scholar]
- 10.Kanasaki H, Bedecarrats GY, Kam K-Y, Xu S, Kaiser UB. Gonadotropinreleasing hormone pulse frequency-dependent activation of extracellular signal-regulated kinase pathways in perifused LbT2 Cells. Endocrinology. 2005;146(12):5503. doi: 10.1210/en.2004-1317. [DOI] [PubMed] [Google Scholar]
- 11.Chen T, He HL, Church GM. Modeling Gene Expression With Differential Equations. 1999 [PubMed] [Google Scholar]
- 12.Clark LH, Schlosser PM, Selgrade JF. Multiple stable periodic solutions in a model for hormonal control of the menstrual cycle. Bull. Math. Biol. 2003;65:157–173. doi: 10.1006/bulm.2002.0326. [DOI] [PubMed] [Google Scholar]
- 13.Pasteur RD, Selgrade JF. A deterministic, mathematical model for hormonal control of the menstrual cycle. In: Dubitzky W, Southgate J, Fuß H, editors. Understanding the dynamics of biological systems. Springer; New York: 2011. pp. 39–58. [Google Scholar]
- 14.Reinecke I, Deuflhard P. A complex mathematical model of the human menstrual cycle. J. Theor. Biol. 2007;247(2):303. doi: 10.1016/j.jtbi.2007.03.011. [DOI] [PubMed] [Google Scholar]
- 15.Keener J, Sneyd J. Mathematical Physiology. 2nd ed. II. Springer; 2008. [Google Scholar]
- 16.Speroff L, Fritz MA. Clinical Gynecologic Endocrinology and Infertility. 7th ed. Lippincott, Williams, and Wilkins; 2005. [Google Scholar]
- 17.Welt CK. Frequency modulation of follicle-stimulating hormone (FSH) during the luteal-follicular transition: evidence for FSH control of inhibin B in normal women. J. Clin. Endocrinol. Metab. 1997;82(8):2645. doi: 10.1210/jcem.82.8.4138. [DOI] [PubMed] [Google Scholar]
- 18.Marshall JC, Dalkin AC, Haisenleder DJ, Paul SJ, Ortolano GA, Kelch RP. Gonadotropin-releasing hormone pulses: regulators of gonadotropin synthesis and ovulatory cycles. Recent Prog. Horm. Res. 1991;47:155–187. doi: 10.1016/b978-0-12-571147-0.50009-3. [DOI] [PubMed] [Google Scholar]
- 19.Kaiser UB, Jakubowiak A, Steinberger A, Chin WW. Regulation of rat pituitary gonadotropin-releasing hormone receptor mRNA levels in vivo and in vitro. Endocrinology. 1993;133(2):931. doi: 10.1210/endo.133.2.8393779. [DOI] [PubMed] [Google Scholar]
- 20.Bauer-Dantoin AC, Hollenberg AN, Jameson JL. Dynamic regulation of gonadotropin-releasing hormone receptor mRNA levels in the anterior pituitary gland during the rat estrous cycle. Endocrinology. 1993;133(4):1911. doi: 10.1210/endo.133.4.8404635. [DOI] [PubMed] [Google Scholar]
- 21.Walker JJ, Terry JR, Tsaneva-Atanasova K, Armstrong SP, McArdle CA, Lightman SL. Encoding and decoding mechanisms of pulsatile hormone secretion. J. Neuroendocr. 2010;22(12):1226. doi: 10.1111/j.1365-2826.2010.02087.x. [DOI] [PubMed] [Google Scholar]
- 22.Shaywitz AJ, Greenberg ME. CREB: a stimulus-induced transcription factor activated by a diverse array of extracellular signals. Annu. Rev. Biochem. 1999;68:821. doi: 10.1146/annurev.biochem.68.1.821. [DOI] [PubMed] [Google Scholar]
- 23.Ayoubi TAY, Van de Ven WJM. Regulation of gene expression by alternative promoters. FASEB J. 1996;10:453. [PubMed] [Google Scholar]
- 24.Mioduszewska B, Jaworski J, Kaczmarek L. Inducible cAMP early repressor (ICER) in the nervous system - a transcriptional regulator of neuronal plasticity and programmed cell death. J. Neurochem. 2003;87(6):1313. doi: 10.1046/j.1471-4159.2003.02116.x. [DOI] [PubMed] [Google Scholar]
- 25.Borlikova G, Endo S. Inducible cAMP early repressor (ICER) and brain functions. Mol. Neurobiol. 2009;40(1):73. doi: 10.1007/s12035-009-8072-1. [DOI] [PMC free article] [PubMed] [Google Scholar]
- 26.Ruf F, Sealfon SC. Genomics view of gonadotrope signaling circuits. Trends Endocrinol. Metab. 2004;15(7):331. doi: 10.1016/j.tem.2004.07.008. [DOI] [PubMed] [Google Scholar]
- 27.Washington TM, Joseph Blum J, Reed Michael C, Michael Conn P. A mathematical model for LH release in response to continuous and pulsatile exposure of gonadotrophs to GnRH. Theor. Biol. Med. Model. 2004;1(1):9. doi: 10.1186/1742-4682-1-9. [DOI] [PMC free article] [PubMed] [Google Scholar]
- 28.Tsutsumi R, Webster NJG. GnRH pulsatility, the pituitary response and reproductive dysfunction. Endocr. J. 2009;56(6):729. doi: 10.1507/endocrj.k09e-185. [DOI] [PMC free article] [PubMed] [Google Scholar]
- 29.Thompson IR, Ciccone NA, Xu S, Zaytseva S, Carroll RS, Kaiser UB. GnRH pulse frequency-dependent stimulation of FSHb transcription is mediated via activation of PKA and CREB EPUB ahead of print. Mol. Endocrinol. 2013 doi: 10.1210/me.2012-1281. [DOI] [PMC free article] [PubMed] [Google Scholar]
- 30.Bintu L, Buchler NE, Garcia HG, Gerland U, Hwa T, Kondev J, Phillips R. Transcriptional regulation by the numbers: models. Curr. Opin. Genet. Dev. 2005;15(2):116. doi: 10.1016/j.gde.2005.02.007. [DOI] [PMC free article] [PubMed] [Google Scholar]
- 31.Edwards CH, Penney DE, Calvis D. Elementary Differential Equations. Prentice Hall: 2007. [Google Scholar]


