Abstract
Using an optical imaging technique with voltage-sensitive dyes (VSDs), we have been investigating the functional organization and architecture of the central nervous system (CNS) during embryogenesis. In the embryonic nervous system, a merocyanine-rhodanine dye, NK2761, has proved to be the most useful absorption dye for detecting neuronal activity because of its high signal-to-noise ratio (S/N), low toxicity, and small dye bleaching. In the present study, we evaluated the suitability of voltage-sensitive fluorescence dyes for optical recording in the embryonic CNS. We screened eight styryl (hemicyanine) dyes in isolated brainstem-spinal cord preparations from 7-day old chick embryos. Measurements of voltage-related optical signals were made using a multiple-site optical recording system. The signal size, S/N, photobleaching, effects of perfusion, and recovery of neural responses after staining were compared. We also evaluated optical responses with various magnifications. Although the S/N was lower than with the absorption dye, clear optical responses were detected with several fluorescence dyes, including di-2-ANEPEQ, di-4-ANEPPS, di-3-ANEPPDHQ, di-4-AN(F)EPPTEA, di-2-AN(F)EPPTEA, and di-2-ANEPPTEA. Di-2-ANEPEQ showed the largest S/N, whereas its photobleaching was faster and the recovery of neural responses after staining was slower. Di-4-ANEPPS and di-3-ANEPPDHQ also exhibited a large S/N, but required a relatively long time for recovery of neural activity. Di-4-AN(F)EPPTEA, di-2-AN(F)EPPTEA, and di-2-ANEPPTEA showed smaller S/Ns than di-2-ANEPEQ, di-4-ANEPPS, and di-3-ANEPPDHQ, but the recovery of neural responses after staining was faster. This study demonstrates the potential utility of these styryl dyes in optical monitoring of voltage changes in the embryonic CNS.
Keywords: optical recording, voltage-sensitive dye, embryo, nervous system, fluorescence, screening
Introduction
Optical recording with voltage-sensitive dyes (VSDs) is a powerful tool with which to monitor transmembrane voltage changes simultaneously in many excitable cells (Grinvald et al., 1977; Salzberg et al., 1977). The combination of a VSD with a multi-channel device, such as a photodiode array or complementary metal oxide semiconductor (CMOS) sensor, has made it possible to investigate the spatiotemporal dynamics of electrical activity in the neural and cardiac systems (for reviews see Cohen & Salzberg, 1978; Salzberg, 1983; Grinvald et al., 1988; Loew, 1988; Kamino, 1991; Ebner & Chen, 1995; Baker et al., 2005; Canepari & Zecevic, 2010).
We have applied optical techniques to the embryonic nervous system and established the feasibility of using VSD recording to analyze neuronal activity in the peripheral and central nervous systems (CNSs) (for reviews see Momose-Sato et al., 2001, 2002; Glover et al., 2008; Momose-Sato & Sato, 2011). The physiological approach to the embryonic nervous system has been greatly advanced by the optical technique because conventional electrophysiological measurements are technically difficult or impossible in the early developing CNS, in which the cells are small and fragile. In our previous studies, we used a merocyanine-rhodanine dye, NK2761, to monitor neuronal activity at the population level because this VSD is an optimal absorption dye (a dye used in the absorption mode in an optical voltage recording experiment) for the embryonic nervous system due to its large response, large S/N, low phototoxicity, and small dye bleaching (Momose-Sato et al., 1995).
Recently, newer optical methods, such as confocal or multi-photon microscopy, have been developed to investigate physiological events at the cellular level. Using these methods together with a voltage-sensitive fluorescence dye (a dye used in the fluorescence mode in an optical voltage recording experiment), some pioneer studies have succeeded in monitoring transmembrane voltage changes in neural and cardiac systems (Saggau et al., 1998; Fisher et al., 2008; Acker et al., 2011; Yan et al., 2012). Although these techniques are potentially useful in the embryo, it is not yet known even by standard microscopic measurement whether fluorescence probes have enough sensitivity to monitor embryonic neuronal activity and which dyes are most suitable for the embryonic nervous system.
In the present study, we examined the performance of eight voltage-sensitive styryl (hemicyanine) dyes, including four commonly-used probes and three recently synthesized dyes, to evaluate the utility of fluorescence dyes for monitoring electrical activity in the embryonic CNS. Preliminary results have appeared previously in abstract form (Sato et al., 2011).
Materials and Methods
Preparations
Experiments were carried out in accordance with the guidelines of the US National Institutes of Health and Komazawa Women’s University for the care and use of laboratory animals. All efforts were made to minimize the number of animals used and their suffering. All of the experiments were performed at Komazawa Women’s University. Fertilized eggs of White Leghorn chickens (Saitama Experimental Animals Supply Co. Ltd., Saitama, Japan) were incubated for 7 days (Hamburger-Hamilton stages 30 to 31: Hamburger & Hamilton, 1951) in a forced-draft incubator (type P-008, Showa Incubator Lab., Urawa, Japan) at 37.5 °C and 60% humidity and were turned once each hour. The embryo was decapitated, and the brainstem-spinal cord preparation was dissected by transecting the spinal cord at the level of the lower cervical segment. The preparation was kept in a physiological solution, which contained (in mM) NaCl, 138; KCl, 5.4; CaCl2, 1.8; MgCl2, 0.5; glucose, 10; and Tris-HCl buffer (pH 7.3), 10. The solution was equilibrated with oxygen.
Staining with VSDs
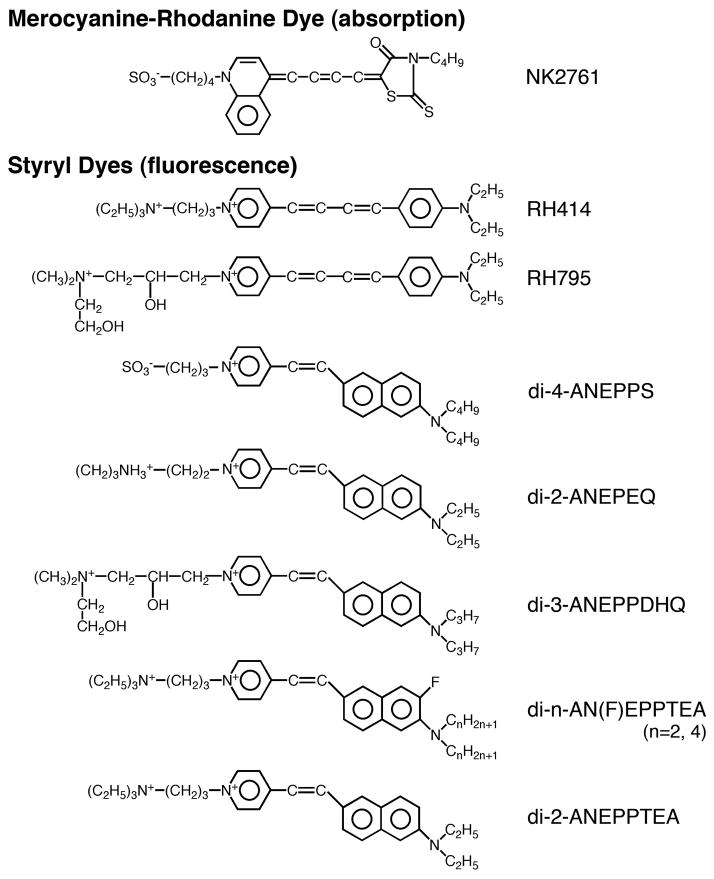
For optical recording, the meningeal tissue surrounding the brain was carefully removed in a bathing solution under a dissection microscope. In this study, we tested eight fluorescence styryl (hemicyanine) dyes, namely, RH414, RH795, di-4-ANEPPS, di-2-ANEPEQ, di-3-ANEPPDHQ, di-2-AN(F)EPPTEA, di-4-AN(F)EPPTEA, and di-2-ANEPPTEA (Fig. 1). The meaning of the short-coded nomenclature such as di-4-ANEPPS is explained in Yan et al. (2012). RH414 and RH795 were acquired from Molecular Probes Inc. (Eugene, OR, USA), and di-4-ANEPPS, di-2-ANEPEQ, and di-3-ANEPPDHQ were from Life Technologies Co. (Carlsbad, CA, USA). Di-2-AN(F)EPPTEA, di-4-AN(F)EPPTEA, and di-2-ANEPPTEA were newly synthesized at the R. D. Berlin Center for Cell Analysis and Modeling, University of Connecticut Health Center, and were kind gift of Prof. Leslie Loew. The fluorescence dyes were dissolved in a small amount of ethanol and stored at −20 °C. The preparation was stained by incubating it for 20 min in a solution containing 0.04 mg/ml of each dye. In photobleaching experiments, however, the dye concentration was 0.1 mg/ml. In the measurements using NK2761 (Hayashibara Biochemical Laboratories Inc. /Kankoh-Shikiso Kenkyusho, Okayama, Japan: Kamino et al., 1981, 1989; Salzberg et al., 1983), the dye was freshly dissolved in dimethylsulfoxide (DMSO), and then diluted with the physiological solution to a concentration of 0.2 mg/ml (20 min staining). The final concentration of ethanol and DMSO in the staining solution was less than 0.1%.
Figure 1.
Chemical structures of the fluorescence VSDs screened in this study, together with the structure of a merocyanine-rhodanine absorption dye, NK2761.
In 7-day old chick embryos, the thickness of the medulla along the ventrodorsal axis is about 1,000 μm. The immature cellular-interstitial structure of the embryonic tissue allowed the dye to diffuse well from the surface and into deeper regions. After staining, the preparation was attached to the silicone bottom of a recording chamber with the ventral side facing up by pinning it with tungsten wires. The preparation was continuously perfused with the bathing solution at 1–2 ml/min at 26–28 °C.
Electrical stimulation for inducing the evoked depolarization wave
The widely-propagating correlated wave, termed the depolarization wave (Momose-Sato et al., 2013a, b), was evoked by applying a single square current pulse to the cervical spinal cord using a concentric bipolar tungsten electrode (TOG204-006, Unique Medical Co., Tokyo, Japan) at 100–200 μA/1 ms, which induced the maximum response.
Optical recording
The methods used for multiple-site optical recording of electrical activity have been described in detail elsewhere (Salzberg et al., 1977; Wu & Cohen, 1993; Momose-Sato et al., 2001; Canepari & Zecevic, 2010). For absorption measurements, light from a 300 W tungsten-halogen lamp (Type JC-24V/300W, Kondo Philips Ltd., Tokyo, Japan) driven by a DC power supply (PAD35-20L, Kikusui Electronic Co., Yokohama, Japan) was collimated, rendered quasi-monochromatic with a heat filter and an interference filter with a transmission maximum at 703 ± 12 nm (Asahi Spectra Co., Tokyo, Japan), and focused onto the preparation. For epi-fluorescence measurements, light from a 300 W tungsten-halogen lamp of the same type as used in the absorption measurements was collimated, rendered quasi-monochromatic with a heat filter and an excitation filter (510–560 nm), and then reflected off a 575nm dichroic mirror. The fluorescence emission from preparations was transmitted first through the dichroic mirror and then through a 590 nm long-pass emission filter.
An objective (Plan Apo 4× (0.2 NA (numerical aperture)), Plan Apo 10× (0.45 NA), or Fluor 20× (0.50 NA)) and a photographic eyepiece (magnification ×1.67) projected a real image of the preparation onto a hexagonally arranged photodiode-fiber optic camera with 464 photodiodes (H-469II, WuTech Instruments, Gaithersburg, MD) mounted on an upright microscope (Eclipse E800, Nikon Co., Tokyo, Japan). Using objectives of 4×, 10×, and 20× with an eyepiece of ×1.67, each detector collected light from a round area having a diameter of 115, 46, and 23 μm, respectively. The output of each detector was amplified individually, digitalized, and stored on a computer (NeuroPlex, RedShirtImaging LLC, Fairfield, CT). The feedback resistance of the first stage amplifier was 20 Mω (for absorption measurements) or 1 Gω (for fluorescence measurements), and the second stage amplifier gain was set to ×200. The amplified outputs were high-pass-filtered with a 2.2 sec time constant and low-pass-filtered with a corner frequency of 1,000 Hz. The amplified signals were acquired at a sampling rate of 0.941 ms per frame using 464 detectors with a 12-bit A/D converter (DAP-3200e/214, Microstar Inc., Bellevue, WA). The optical signals are presented as fractional changes (the changes in transmitted or fluorescence light intensity normalized to resting light intensity: ΔI/I or ΔF/F). During optical recording, perfusion was briefly stopped to minimize motion artifacts. The incident light was turned off using an electronic shutter except during the recording period. VSD signals were analyzed with the computer program NeuroPlex (RedShirtImaging LLC, Fairfield, CT), which runs under IDL (Research Systems, Boulder, CO). To reduce high-frequency noise, detected signals were processed off-line with a low-pass filter (Binomial ×30).
Results
Optical recording of the depolarization wave with absorption/fluorescence dyes
In the chick, rat, and mouse embryos, widely-propagating correlated activity, which we refer to as the depolarization wave, is observed during a specific period of development (for reviews see Momose-Sato & Sato, 2013a, b). This activity occurs spontaneously, but is also induced by electrical stimulation of the sensory nerve or the brain. In the present dye screening, we evaluated optical signals related to the evoked depolarization wave because (1) the signal is large and stable, and (2) it is easy to make preparations and to induce the signal.
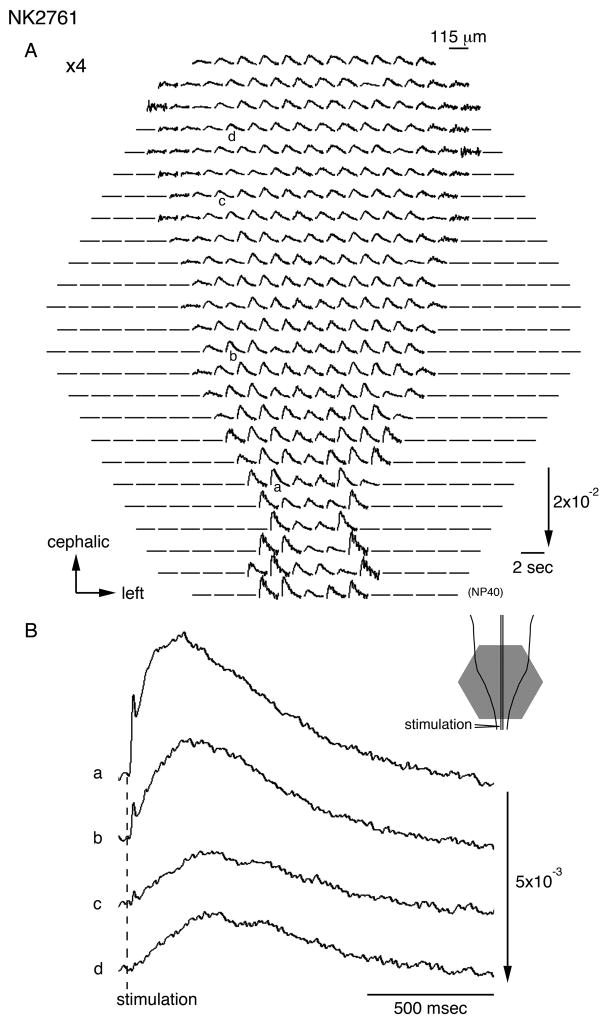
Figure 2A illustrates an example of multiple-site optical recording of the depolarization wave in a 7-day old embryonic chick brainstem-spinal cord preparation stained with a merocyanine-rhodanine dye (an absorption dye), NK2761. The signals were evoked by direct electrical stimulation applied to the upper cervical cord (lower inset), and the recording was made using a 464-element photodiode array in a single sweep. In Fig. 2B, optical signals recorded from four different sites (a–d in Fig. 2A) are enlarged. The polarity of the optical signals was dependent upon the wavelengths of incident light (data not shown), indicating that the detected signals were indeed dye-absorption changes related to the membrane potential and do not correspond to changes in light scattering related to mechanical or other factors. Using NK2761, the depolarization wave was clearly detected in the same manner as we reported previously (Momose-Sato et al., 2003).
Figure 2.
A. Multiple-site optical recording of neural responses to upper spinal cord stimulation in a 7-day old embryonic chick brainstem-spinal cord preparation. The preparation was stained with a merocyanine-rhodanine absorption dye, NK2761. The optical signals evoked by electrical stimulation (200 μA/1 msec) were recorded simultaneously from 464 contiguous regions of the preparation with a magnification of ×4 (an objective) ×1.67 (an eyepiece). The direction of the arrow in the lower right indicates an increase in transmitted light intensity (a decrease in dye absorption), and the length of the arrow represents the stated value of the fractional change (the change in light intensity divided by DC-background intensity). Electrical stimulation elicited a propagating depolarization wave in the spinal cord and the brainstem. An illustration of the preparation is shown in the lower right, in which the detected area is marked with a gray hexagon. The recording was made in a single sweep. B. Enlarged traces of the optical signals detected from four regions indicated by a–d in A.
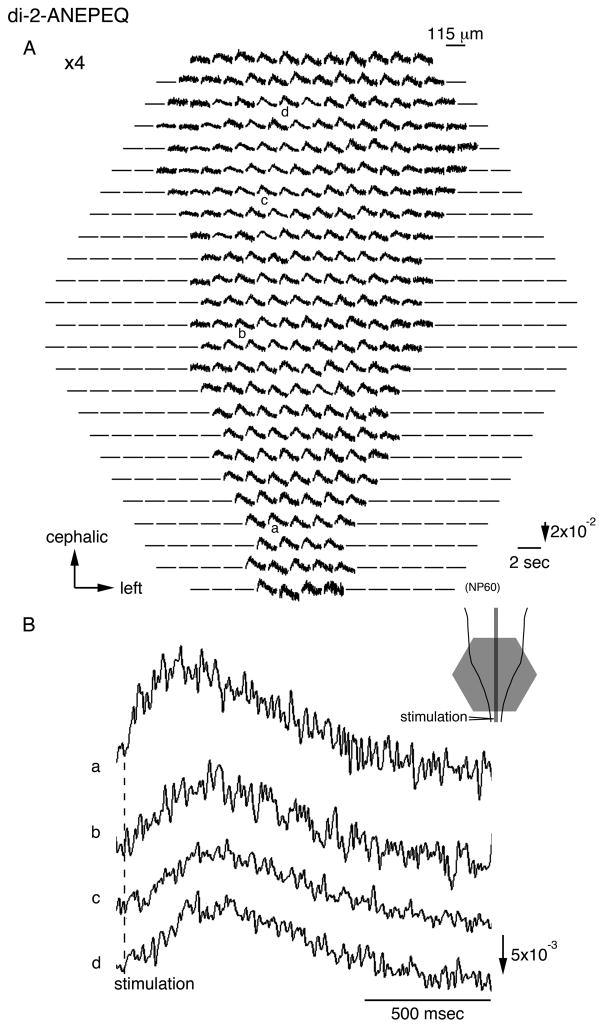
Figure 3A shows an example of multiple-site optical recording of the depolarization wave in a preparation stained with a styryl dye (a fluorescence dye), di-2-ANEPEQ. Optical signals detected in different sites (a–d in Fig. 3A) are enlarged in Fig. 3B. The recording conditions were the same as those in Fig. 2, except for the difference between absorption and fluorescence. Compared with the recording of NK2761 (Fig. 2), the S/N was smaller with di-2-ANEPEQ because of marked noise. Nonetheless, the waveform and distribution pattern of the optical signals were similar between the two recordings. These similarities indicate that neuronal activity in the embryonic brain is detectable with a voltage-sensitive fluorescence dye in a manner reminiscent of that with the absorption dye.
Figure 3.
A. Multiple-site optical recording of neural responses detected with a styryl fluorescence dye, di-2-ANEPEQ. The direction of the arrow in the lower right indicates an increase in fluorescence intensity, and the length of the arrow represents the stated value of the fractional change. Other experimental conditions were the same as those in Fig. 2. The fractional change was about five times larger than that in Fig. 2, but the S/N was lower because of larger noise. B. Enlarged traces of the optical signals detected from four regions indicated by a–d in A.
Comparison of the performance of voltage-sensitive fluorescence dyes
Next, we examined the performance of the eight voltage-sensitive fluorescence dyes shown in Fig. 1.
Signal size and S/N
The signal size and S/N provide good indications of which dyes are likely to be useful for monitoring membrane potential (Cohen et al., 1974; Ross et al., 1977; Gupta et al., 1981; for review see Cohen & Salzberg, 1978). In Table 1, we compared the maximum signal size (maximum ΔF/F, ΔI/I) and S/N of the optical signals obtained from some preparations (magnification: ×4×1.67). With the tested fluorescence dyes, the maximum signal sizes were larger, while S/Ns were 10–20 times smaller than those with an absorption dye, NK2761. Among the fluorescence dyes tested, di-4-ANEPPS, di-2-ANEPEQ, di-4-AN(F)EPPTEA, di-2-AN(F)EPPTEA, and di-2-ANEPPTEA exhibited the largest signals. With regard to the S/N, di-2-ANEPEQ showed the best performance, followed by di-3-ANEPPDHQ, and then di-4-ANEPPS. When RH414 and RH795 were applied, we could obtain very small or undetectable signals.
Table 1.
The signal size (ΔF/F: fractional change in fluorescence intensity) and signal-to-noise ratio (S/N) were evaluated for the largest signal obtained in each preparation. The signal size (ΔI/I: fractional change in transmitted light intensity) and S/N with NK2761 were also compared. The recordings were made with a magnification of ×4×1.67. n.d.: not detectable (S/N < 1.0).
Signal size and signal-to-noise ratio
| Dye | Preparation reference | Objective ×4
|
|
|---|---|---|---|
| Maximum F/F (×10−2) | S/N | ||
| RH414 | NP12 | 0.17 | 1.1 |
| NP13 | 0.18 | 1.1 | |
| NP17 | n. d. | ||
| RH795 | NP14 | 0.40 | 1.4 |
| NP20 | 0.42 | 1.2 | |
| di-4-ANEPPS | NP15 | 1.6 | 1.8 |
| NP16 | 1.5 | 2.1 | |
| NP25 | 1.7 | 2.5 | |
| NP59 | 1.1 | 2.8 | |
| di-2-ANEPEQ | NP23 | 1.4 | 4.3 |
| NP57 | 1.7 | 4.4 | |
| NP60 | 1.3 | 4.0 | |
| di-3-ANEPPDHQ | NP30 | 0.70 | 2.7 |
| NP58 | 0.81 | 3.0 | |
| NP61 | 0.75 | 2.7 | |
| di-4-AN(F)EPPTEA | NP50 | 1.5 | 1.5 |
| NP51 | 1.2 | 1.5 | |
| NP71 | 1.1 | 1.5 | |
| NP72 | 1.2 | 2.5 | |
| NP77 | 1.3 | 1.5 | |
| di-2-AN(F)EPPTEA | NP67 | 1.1 | 1.4 |
| NP68 | 1.1 | 1.5 | |
| NP73 | 1.5 | 1.5 | |
| NP75 | 1.5 | 1.8 | |
| di-2-ANEPPTEA | NP63 | 1.2 | 1.2 |
| NP66 | 1.1 | 1.1 | |
| NP69 | 1.4 | 1.1 | |
| NP74 | 1.5 | 1.8 | |
| NP84 | 1.0 | 1.3 | |
|
| |||
| NK2761 | NP11 | 0.35 | 24 |
| NP32 | 0.33 | 22 | |
| NP38 | 0.34 | 23 | |
| NP40 | 0.36 | 26 | |
High magnification recording
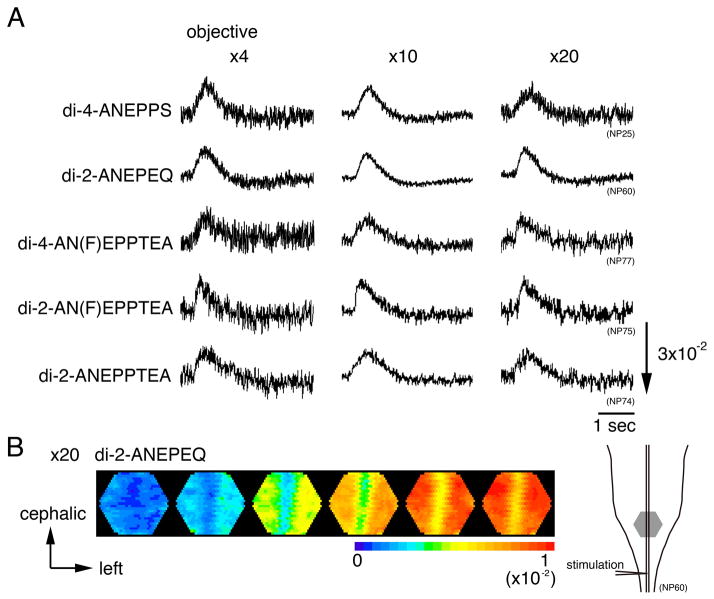
For optical analysis of neural responses at the cellular level, it is necessary to detect optical responses at high magnifications. In Fig. 4, we compared optical responses recorded with ×4, ×10, and ×20 objectives for several dyes. As shown in Fig. 4A, although the S/N was much smaller than with the absorption dye (also see Fig. 2 and Table 1), neural responses were clearly discernable for every fluorescence dye at every magnification. In Table 2, the maximum S/N evaluated for each dye is summarized. In Fig. 4B, we made spatiotemporal color-coded representations of the optical responses recorded with di-2-ANEPEQ using the ×20 objective. This figure, together with the data shown in Table 2, indicates that the quality of fluorescence signals is high enough to resolve neural responses at higher magnifications.
Figure 4.
A. Optical signals at various microscope magnifications. Optical recordings were made with an eyepiece (×1.67) and three objectives (×4, ×10, and ×20) for five fluorescence dyes and an absorption dye. B. An example of color-coded representations of the optical signal related to the depolarization wave. The preparation was stained with di-2-ANEPEQ, and the optical signals were detected with a magnification of ×20×1.67. An illustration of the preparations is shown on the right, and the detected area is marked with a gray hexagon. The frame interval was 50 msec. The stimulation was applied at the first frame.
Table 2.
The maximum S/N obtained with the objectives of ×4, ×10, and ×20.
Signal-to-noise ratio at various magnifications
| Dye | Objective | ||
|---|---|---|---|
| ×4 | ×10 | ×20 | |
|
| |||
| Maximum S/N | Maximum S/N | Maximum S/N | |
| di-4-ANEPPS | 2.8 | 6.0 | 2.4 |
| di-2-ANEPEQ | 4.4 | 9.0 | 7.2 |
| di-4-AN(F)EPPTEA | 2.5 | 3.6 | 2.0 |
| di-2-AN(F)EPPTEA | 1.8 | 3.6 | 2.3 |
| di-2-ANEPPTEA | 1.8 | 3.8 | 2.0 |
Photobleaching
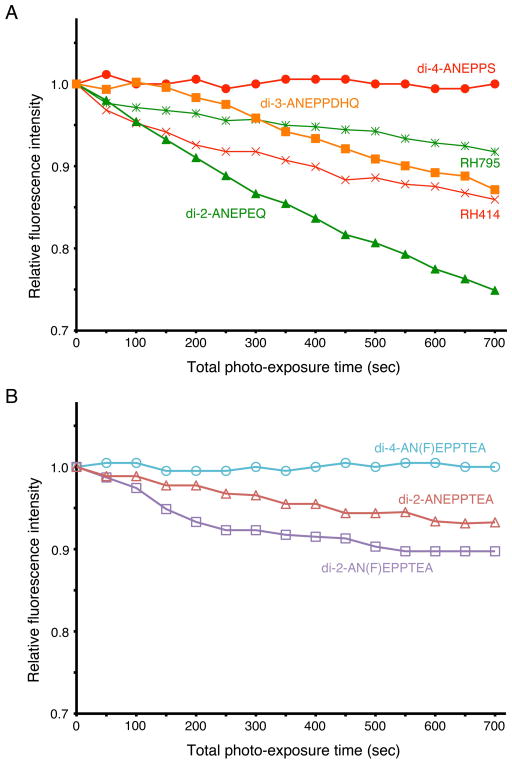
The exposure of stained preparations to illumination with light causes photobleaching. The less a dye bleaches, the longer the time that stable recording is possible. In Fig. 5, the time courses of photobleaching are compared among the dyes. The abscissa is illumination time, and the ordinate is normalized background light intensity monitored without any stimulation under continuous illumination. As shown in Fig. 5A, the time courses of photobleaching differed among the dyes. For example, di-4-ANEPPS showed almost no change in the background fluorescence, whilst the fluorescence intensity of di-2-ANEPEQ was reduced to 75% with 700 sec of continuous illumination. Among the newly synthesized dyes (Fig. 5B), di-4-AN(F)EPPTEA showed the least photobleaching, like di-4-ANEPPS. Di-2-AN(F)EPPTEA and di-2-ANEPPTEA exhibited modest photobleaching.
Figure 5.
Effects of illumination on the fluorescence background intensity of the dye. The ordinate represents the relative fluorescence intensity (DC-background light intensity at each time divided by that at time 0), and the abscissa is time of continuous illumination. In A, the results of five fluorescence dyes are shown. In B, the results of three recently synthesized dyes are shown.
Effects of perfusion
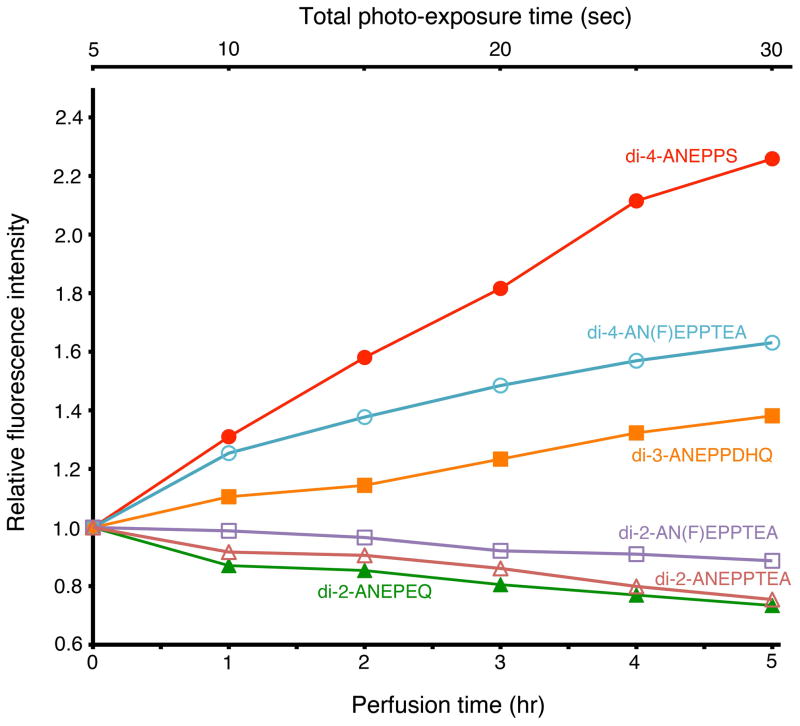
Perfusion with the physiological solution is considered to cause detachment of dye bound to the cell membrane, which results in a reduction in signal amplitude (Momose-Sato et al., 1999). In Fig. 6, we compared the effects of perfusion among several dyes. In this experiment, incident light was turned off except during the measuring period (about 5 sec per hour). Normalized fluorescence intensity is plotted against time of perfusion (1 ml/min; lower abscissa), together with total time of illumination (upper abscissa). For di-2-AN(F)EPPTEA, di-2-ANEPPTEA, and di-2-ANEPEQ, the fluorescence intensity gradually decreased with perfusion, but the relative intensity was more than 75% even after 5 hr, suggesting that the effect was not serious (also see Fig. 7). Unexpectedly, for di-4-ANEPPS, di-4-AN(F)EPPTEA, and di-3-ANEPPDHQ, the fluorescence intensity increased with time. The rate of increase in the fluorescence intensity was in the following order: di-4-ANEPPS > di-4-AN(F)EPPTEA > di-3-ANEPPDHQ. This result might be related to the chemical structure of the dyes, but the underlying mechanism is not understood at present (see Discussion).
Figure 6.
Effects of perfusion on the fluorescence background intensity of the dye. The incident light was turned off except during the measuring period. The ordinate represents the relative fluorescence intensity (DC-background light intensity at each time divided by that at time 0). The lower abscissa is time after staining (perfusion rate: 1 ml/min), and the upper abscissa is the total illumination time.
Figure 7.
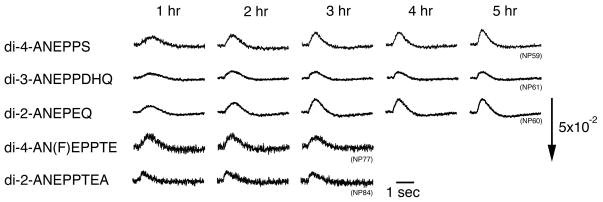
Time-dependent changes in optical signals after staining. The preparations were stained with five fluorescence dyes. Optical signals related to the depolarization wave were detected with a magnification of ×10 ×1.67 in single sweeps at 1, 2, 3, 4, and 5 hr after staining.
Recovery after staining
Some VSDs are toxic to living cells, which causes a transient reduction in neural responses during staining. In Fig. 7, we examined the time course of recovery in optical responses after staining. To exclude the effects of damage caused by dissection, optical signals were evaluated from one hour after staining. In this experiment, the incident light was turned off except during the measuring period (about 10 sec per measurement), so that the effects of photobleaching seemed to be negligibly small.
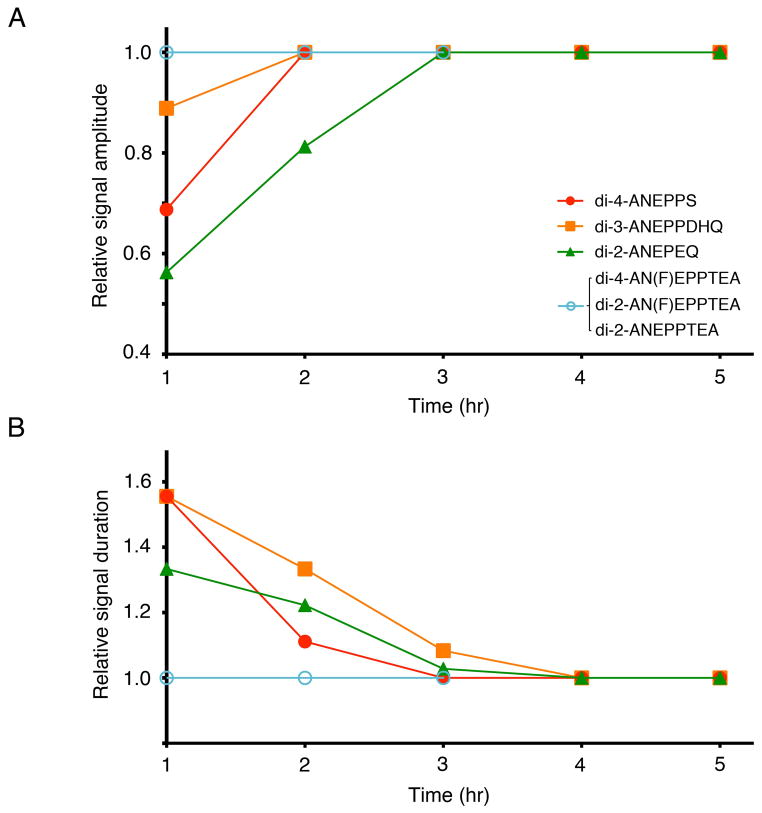
In Fig. 7, the waveforms of the optical signal differed somewhat between 1 hr and 3 hr for several dyes including, di-4-ANEPPS, di-3-ANEPPDHQ, and di-2-ANEPEQ, whilst those of di-4-AN(F)EPPTEA and di-2-ANEPPTEA were relatively stable during 1–3 hours. In Fig. 8, we plot the amplitude (A) and duration (B) of the optical signals against time. The amplitude and duration were normalized to the values at 1 hour after staining. The graphs show that, for di-2-AN(F)EPPTEA, di-4-AN(F)EPPTEA, and di-2-ANEPPTEA, the optical signal fully recovered within 1 hour after staining, whereas, for di-2-ANEPPS, di-3-ANEPPDHQ, and di-4-ANEPPS, the recovery took longer.
Figure 8.
Time-dependent changes in optical signals after staining. Amplitudes (A) and durations (B) of the optical signal normalized to the values at 1 hour after staining are plotted against time. The signal duration was measured at 50% of the maximum signal amplitude.
Discussion
In the present study, we screened several voltage-sensitive styryl dyes with an emphasis on the performance in the embryonic CNS. The tested dyes have been used in various other preparations to monitor transmembrane voltage changes. RH414, RH795, di-4-ANEPPS, and di-2-ANEPEQ are commercially-available dyes, which are frequently-used for monitoring neuronal activity in the adult/postnatal nervous system (Grinvald et al., 1984, 1988; Loew et al., 1992; Zecevic, 1996; Onimaru and Honda, 2003). Di-3-ANEPPDHQ is a naphthylstyryl-pyridinium potentiometric dye, which is a chimera of RH795 and di-3-ANEPPS. This dye is also commercially-available and useful for monitoring neuronal activity in the enteric nervous system (Obaid et al., 2004). Di-2-AN(F)EPPTEA and di-4-AN(F)EPPTEA are recently synthesized fluorinated VSDs, and di-2-ANEPPTEA is a non-fluorinated analog of di-2-AN(F)EPPTEA. Di-2-AN(F)EPPTEA and di-4-AN(F)EPPTEA have been shown to exhibit large optical signals in random access two-photon imaging and multi-wavelength imaging (Acker et al., 2011; Yan et al., 2012).
The ideal VSD is highly sensitive to transmembrane voltage changes and has little or no pharmacological or phototoxic effects (Cohen & Salzberg, 1978). In addition, it is required that photobleaching is small and long-term stable recording is possible. To apply a VSD to a new preparation, dye screening is crucial for obtaining successful results because the characteristics of the dye, such as the signal size, S/N, and toxicity, vary depending on the species and tissues (Ross & Reichardt, 1979; Senseman & Salzberg, 1980; Grinvald et al., 1988). Evaluation of the dye is especially critical in the embryonic nervous system since embryonic neurons are easily damaged because of the fragility and immaturity of the cells. Here, we discuss the relative utility of different fluorescence dyes for monitoring neuronal activity in the embryonic CNS, focusing on the signal size, S/N, photobleaching, effects of perfusion, and chemical toxicity. It should be emphasized, however, that the relative merits of different fluorescence dyes are different for different preparations (e. g., enteric neurons of the guinea pig (Obaid et al., 2004).
Signal size and S/N
In the present study, the tested fluorescence dyes except for RH414 and RH795 exhibited large enough signals to be recorded in single sweeps. In the embryonic nervous system, RH414 and RH795 showed very small or undetectable signals, although it has been reported that these dyes are useful in other preparations (Grinvald et al., 1984, 1988; Obaid et al., 2004). Differences in the performance of the VSD between embryonic and adult tissues have also been observed in absorption dyes, such as an oxonol dye, NK3041 (RH155), which provides large absorption signals in adult hippocampal slices, while it gives small signals in the embryonic CNS (Momose-Sato et al., 1995, 1999).
In the embryonic CNS, the synapses are functionally immature and easy to fatigue, even with 0.1 Hz repetitive stimulation (Sato et al., 1999; Mochida et al., 2001; Momose-Sato et al., 2001, 2009). Thus, it is usually necessary to record neural responses in single sweeps. In the present study, although the S/N of the fluorescence dyes was smaller than that of NK2761, it was sufficient for the analysis without averaging, even at high magnifications (Fig. 4, Table 2). Using the ×20 objective with the ×1.67 eyepiece, each detector collects light from a round area with a diameter of 23 μm, suggesting that cellular level analysis might be possible.
Photobleaching
For all of the tested fluorescence dyes except for di-2-ANEPEQ, the change in background fluorescence intensity was less than 15% after 700 sec of continuous illumination. This result suggests that the effect of photobleaching is not serious in experiments, in which the incident light is turned off between the recordings. The largest change in the background light intensity was observed for di-2-ANEPEQ, which might be problematic when long-term recording is performed.
Washout by perfusion
In our previous study of absorption dye screening, we reported that background light intensity changed with perfusion, which is possibly caused by detachment of dye molecules from the cell membrane (Momose-Sato et al., 1999), or by internalization of the dye molecules. In the present study, we observed that fluorescence intensity slightly decreased with perfusion for di-2-AN(F)EPPTEA, di-2-ANEPPTEA, and di-2-ANEPEQ. Although speculative, a similar mechanism as suggested for the absorption dye might underlie the present result. Surprisingly, for di-4-ANEPPS, di-4-AN(F)EPPTEA, and di-3-ANEPPDHQ, the fluorescence intensity gradually increased with time in the order of di-4-ANEPPS > di-4-AN(F)EPPTEA > di-3-ANEPPDHQ. The styryl dye is anchored to the membrane with a pair of alkyl groups on the amino end, and the longer chain alkyl groups bind more tightly to the membrane (Yan et al., 2012). But the dyes with longer alkyl chains are less soluble in the aqueous solution, may associate with the walls of the chamber and may take longer to equilibrate through the tissue and bind to the neuron membranes. Since only the membrane-bound form of the dyes are fluorescent, this may explain the increase in fluorescence for the dye molecules with longer alkyl chains.
Toxicity
In the embryonic CNS, optical signals for di-2-AN(F)EPPTEA, di-4-AN(F)EPPTEA, and di-2-ANEPPTEA recovered within 1 hour after staining. However, di-4-ANEPPS, di-3-ANEPPDHQ, and di-2-ANEPPS required a longer time for recovery. These results suggest that the former dyes are less toxic than the latter ones in the embryonic CNS.
In the present study, it has been shown that some of the voltage-sensitive fluorescence dyes are potentially useful for monitoring neuronal activity in the embryonic CNS. Among the dyes tested, di-2-ANEPEQ exhibited the largest S/N. However, its photobleaching was faster, and the recovery of neural activity after staining was slower. This dye seems to be useful for short-term recording, when enough time is allowed for the recovery. Di-4-ANEPPS and di-3-ANEPPDHQ also showed large S/Ns, together with less photobleaching. However, these dyes also required a relatively long time for the recovery of neural activity after staining. Furthermore, the background fluorescence intensity changed unstably with time, the mechanism of which is unknown. Newly synthesized styryl dyes, di-4-AN(F)EPPTEA, di-2-AN(F)EPPTEA, and di-2-ANEPPTEA, exhibited smaller S/Ns than di-2-ANEPEQ, but their photobleaching was slower, and the recovery after staining was faster. These dyes appear to be suitable for long-term recording or recording in which only a short time is available for recovery after staining.
The early embryonic brain has a histologically loose structure with immature neurons/glia and undifferentiated connective tissue. In addition, the brain is small and thin. The high translucency of the embryonic brain gives large S/N in absorption measurements, and thus absorption dyes, rather than fluorescence dyes have usually been used as molecular voltmeters in embryonic preparations. Indeed, in the 7-day old chick brainstem, the S/N of the fluorescence signal was inferior to that of the absorption signal, even with di-2-ANEPEQ, which showed the best performance in the present study. Nevertheless, the translucency of the tissue becomes low as development proceeds, and fluorescence dyes might be a better choice when optical recording is performed at the late embryonic stage or using postnatal/post hatching animals. Also, fluorescence dyes are far superior when used in an epi-illumination configuration (i.e., whole brain).
In general, the S/N in fluorescence is degraded by non-specific binding of the dye to extraneous material, such as in the case of brain slices. However, in situations where the dye is bound only to the cell membrane, and there is only one cell in the light path (for example, in the case of tissue-cultured neurons), the S/N in fluorescence can be much larger than that in absorption (Wu & Cohen, 1993). Considering this, it is possible that the fluorescence dyes tested in the present study give better performance in optical recording at the single cell level. Continuing efforts are being made to develop and screen dyes with larger S/Ns, which may ultimately lead to improvements in optical analyses of the developmental progress of the CNS.
Acknowledgments
This research was supported by grants from the Monbu-Kagaku-sho of Japan, the Human Frontier Science Program (grant no. RGP0027/2009) and the U.S. National Institutes of Health (grant no. R01EB001963). Saad Habib-E-Rasul Mullah was supported by the Opto-Medical Institute as a postdoctoral fellowship.
References
- Acker CD, Yan P, Loew LM. Single-voxel recording of voltage transients in dendritic spines. Biophys J. 2011;101:L11–L13. doi: 10.1016/j.bpj.2011.06.021. [DOI] [PMC free article] [PubMed] [Google Scholar]
- Baker BJ, Kosmidis EK, Vucinic D, Falk CX, Cohen LB, Djurisic M, Zecevic D. Imaging brain activity with voltage- and calcium-sensitive dyes. Cell Mol Neurobiol. 2005;25:245–282. doi: 10.1007/s10571-005-3059-6. [DOI] [PMC free article] [PubMed] [Google Scholar]
- Canepari M, Zecevic D. Membrane potential imaging in the nervous system. Springer; New York: 2010. [Google Scholar]
- Cohen LB, Salzberg BM. Optical measurement of membrane potential. Rev Physiol Biochem Pharmacol. 1978;83:35–88. doi: 10.1007/3-540-08907-1_2. [DOI] [PubMed] [Google Scholar]
- Cohen LB, Salzberg BM, Davila HV, Ross WN, Landowne D, Waggoner AS, Wang CH. Changes in axon fluorescence during activity: Molecular probes of membrane potential. J Membr Biol. 1974;19:1–36. doi: 10.1007/BF01869968. [DOI] [PubMed] [Google Scholar]
- Ebner TJ, Chen G. Use of voltage-sensitive dyes and optical recordings in the central nervous system. Prog Neurobiol. 1995;46:463–506. doi: 10.1016/0301-0082(95)00010-s. [DOI] [PubMed] [Google Scholar]
- Fisher JAN, Barchi JR, Welle CG, Kim G-H, Kosterin P, Obaid AL, Yodh AG, Contreras D, Salzberg BM. Two-photon excitation of potentiometric probes enables optical recording of action potentials from mammalian nerve terminals in situ. J Neurophysiol. 2008;99:1545–1553. doi: 10.1152/jn.00929.2007. [DOI] [PubMed] [Google Scholar]
- Glover JC, Sato K, Momose-Sato Y. Using voltage-sensitive dye recording to image the functional development of neuronal circuits in vertebrate embryos. Dev Neurobiol. 2008;68:804–816. doi: 10.1002/dneu.20629. [DOI] [PubMed] [Google Scholar]
- Grinvald A, Anglister L, Freeman JA, Hildesheim R, Manker A. Real-time optical imaging of naturally evoked electrical activity in intact frog brain. Nature. 1984;308:848–850. doi: 10.1038/308848a0. [DOI] [PubMed] [Google Scholar]
- Grinvald A, Frostig RD, Lieke E, Hildesheim R. Optical imaging of neuronal activity. Physiol Rev. 1988;68:1285–1366. doi: 10.1152/physrev.1988.68.4.1285. [DOI] [PubMed] [Google Scholar]
- Grinvald A, Salzber BM, Cohen LB. Simultaneous recording from several neurones in an invertebrate central nervous system. Nature. 1977;268:140–142. doi: 10.1038/268140a0. [DOI] [PubMed] [Google Scholar]
- Gupta RK, Salzberg BM, Grinvald A, Cohen LB, Kamino K, Lesher S, Boyle MB, Waggoner AS, Wang CH. Improvements in optical methods for measuring rapid changes in membrane potential. J Membr Biol. 1981;58:123–137. doi: 10.1007/BF01870975. [DOI] [PubMed] [Google Scholar]
- Hamburger V, Hamilton HL. A series of normal stages in the development of the chick embryo. J Morphol. 1951;88:49–92. [PubMed] [Google Scholar]
- Kamino K. Optical approaches to ontogeny of electrical activity and related functional organization during early heart development. Physiol Rev. 1991;71:53–91. doi: 10.1152/physrev.1991.71.1.53. [DOI] [PubMed] [Google Scholar]
- Kamino K, Hirota A, Fujii S. Localization of pacemaking activity in early embryonic heart monitored using voltage-sensitive dye. Nature. 1981;290:595–597. doi: 10.1038/290595a0. [DOI] [PubMed] [Google Scholar]
- Kamino K, Katoh Y, Komuro H, Sato K. Multiple-site optical monitoring of neural activity evoked by vagus nerve stimulation in the embryonic chick brain stem. J Physiol (Lond) 1989;409:263–283. doi: 10.1113/jphysiol.1989.sp017496. [DOI] [PMC free article] [PubMed] [Google Scholar]
- Loew LM. How to choose a potentiometric membrane probe. In: Loew LM, editor. Spectroscopic Membrane Probes. II. CRC Press; Boca Raton, Florida: 1988. pp. 139–151. [Google Scholar]
- Loew LM, Cohen LB, Dix J, Fluhler EN, Montana V, Salama G, Wu JY. A naphthyl analog of the aminostyryl pyridinium class of potentiometric membrane dyes shows consistent sensitivity in a variety of tissue, cell, and model membrane preparations. J Membr Biol. 1992;130:1–10. doi: 10.1007/BF00233734. [DOI] [PubMed] [Google Scholar]
- Mochida H, Sato K, Arai Y, Sasaki S, Kamino K, Momose-Sato Y. Optical imaging of spreading depolarization waves triggered by spinal nerve stimulation in the chick embryo: Possible mechanisms for large-scale coactivation of the CNS. Eur J Neurosci. 2001;14:809–820. doi: 10.1046/j.0953-816x.2001.01692.x. [DOI] [PubMed] [Google Scholar]
- Momose-Sato Y, Miyakawa N, Mochida H, Sasaki S, Sato K. Optical analysis of large-scale depolarization waves in the embryonic brain: a dual network of gap junctions and chemical synapses. J Neurophysiol. 2003;89:600–614. doi: 10.1152/jn.00337.2002. [DOI] [PubMed] [Google Scholar]
- Momose-Sato Y, Sato K. The embryonic brain and development of vagal pathways. Resp Physiol Neurobiol. 2011;178:163–173. doi: 10.1016/j.resp.2011.01.012. [DOI] [PubMed] [Google Scholar]
- Momose-Sato Y, Sato K. Optical imaging of the spontaneous depolarization wave in the mouse embryo: Origins and pharmacological natures. Ann NY Acad Sci. 2013a;1279:60–70. doi: 10.1111/j.1749-6632.2012.06806.x. [DOI] [PubMed] [Google Scholar]
- Momose-Sato Y, Sato K. Large-scale synchronized activity in the embryonic brainstem and spinal cord. Frontiers Cell Neurosci 7: Article. 2013b;36:1–15. doi: 10.3389/fncel.2013.00036. [DOI] [PMC free article] [PubMed] [Google Scholar]
- Momose-Sato Y, Sato K, Arai Y, Yazawa I, Mochida H, Kamino K. Evaluation of voltage-sensitive dyes for monitoring for long-term recording of neural activity in the hippocampus. J Membr Biol. 1999;172:145–157. doi: 10.1007/s002329900592. [DOI] [PubMed] [Google Scholar]
- Momose-Sato Y, Sato K, Kamino K. Optical approaches to embryonic development of neural functions in the brainstem. Prog Neurobiol. 2001;63:151–197. doi: 10.1016/s0301-0082(00)00023-x. [DOI] [PubMed] [Google Scholar]
- Momose-Sato Y, Sato K, Kamino K. Application of voltage-sensitive dyes to the embryonic central nervous system. In: Fagan J, Davidson JN, Shimizu N, editors. Recent Research Developments in Membrane Biology. Research Signpost; Kerara: 2002. pp. 159–181. [Google Scholar]
- Momose-Sato Y, Sato K, Sakai T, Hirota A, Matsutani K, Kamino K. Evaluation of optimal voltage-sensitive dyes for optical monitoring of embryonic neural activity. J Membr Biol. 1995;144:167–176. doi: 10.1007/BF00232802. [DOI] [PubMed] [Google Scholar]
- Obaid AL, Loew LM, Wuskell JP, Salzberg BM. Novel naphthylstyryl-pyridinium potentiometric dyes offer advantages for neural network analysis. J Neurosci Meth. 2004;134:179–190. doi: 10.1016/j.jneumeth.2003.11.011. [DOI] [PubMed] [Google Scholar]
- Onimaru H, Homma I. A novel functional neuron group for respiratory rhythm generation in the ventral medulla. J Neurosci. 2003;23:1478–1486. doi: 10.1523/JNEUROSCI.23-04-01478.2003. [DOI] [PMC free article] [PubMed] [Google Scholar]
- Ross WN, Reichardt LF. Species-specific effects on the optical signals of voltage-sensitive dyes. J Membr Biol. 1979;48:343–356. doi: 10.1007/BF01869445. [DOI] [PubMed] [Google Scholar]
- Ross WN, Salzberg BM, Cohen LB, Grinvald A, Davila HV, Waggoner AS, Wang CH. Changes in absorption, fluorescence, dichroism, and birefringence in stained giant axons: optical measurement of membrane potential. J Membr Biol. 1977;33:141–183. doi: 10.1007/BF01869514. [DOI] [PubMed] [Google Scholar]
- Saggau P, Bullen A, Patel SS. Acoustic-optic random-access laser scanning microscopy: fundamentals and applications to optical recording of neuronal activity. Cell Mol Biol. 1998;44:827–846. [PubMed] [Google Scholar]
- Salzberg BM. Optical recording of electrical activity in neurons using molecular probes. In: Barker JL, McKelvy JF, editors. Current Methods in Cellular Neurobiology, vol 3. Electrophysiological Techniques. Wiley; New York: 1983. pp. 139–187. [Google Scholar]
- Salzberg BM, Grinvald A, Cohen LB, Davila HV, Ross WN. Optical recording of neuronal activity in an invertebrate central nervous system: Simultaneous monitoring of several neurons. J Neurophysiol. 1977;40:1281–1291. doi: 10.1152/jn.1977.40.6.1281. [DOI] [PubMed] [Google Scholar]
- Salzberg BM, Obaid AL, Senseman DM, Gainer H. Optical recording of action potentials from vertebrate nerve terminals using potentiometric probes provides evidence for sodium and calcium components. Nature. 1983;306:36–40. doi: 10.1038/306036a0. [DOI] [PubMed] [Google Scholar]
- Sato K, Komuro R, Momose-Sato Y. Screening of fluorescent voltage-sensitive dyes for detecting neural activity in the embryonic brain. J Physiol Sci. 2011;61(suppl 1):S168. [Google Scholar]
- Sato K, Momose-Sato Y, Mochida H, Arai Y, Yazawa I, Kamino K. Optical mapping reveals the functional organization of the trigeminal nuclei in the chick embryo. Neurosci. 1999;93:687–702. doi: 10.1016/s0306-4522(99)00114-1. [DOI] [PubMed] [Google Scholar]
- Senseman DM, Salzberg BM. Electrical activity in an exocrine gland: optical recording with a potentiometric dye. Science. 1980;208:1269–1271. doi: 10.1126/science.7375937. [DOI] [PubMed] [Google Scholar]
- Wu JY, Cohen LB. Fast multisite optical measurement of membrane potential. In: Mason WT, editor. Fluorescent and Luminescent Probes for Biological Activity. Academic Press; Boston: 1993. pp. 389–404. [Google Scholar]
- Yan P, Acker CD, Zhou W-L, Lee P, Bollensdorff C, Negrean A, Lotti J, Sacconi L, Antic SD, Kohl P, Mansvelder HD, Pavone FS, Loew LM. Palette of fluorinated voltage-sensitive hemicyanine dyes. Proc Natl Acad Sci USA. 2012;109:20443–20448. doi: 10.1073/pnas.1214850109. [DOI] [PMC free article] [PubMed] [Google Scholar]
- Zecevic D. Multiple spike-initiation zones in single neurons revealed by voltage-sensitive dyes. Nature. 1996;381:322–325. doi: 10.1038/381322a0. [DOI] [PubMed] [Google Scholar]


