

Abstract
Background
The metabolic preference of malignant glioma for glycolysis as an energy source is a potential therapeutic target. As a result of the cellular heterogeneity of these tumors, however, the relation between glycolytic preference, tumor formation, and tumor cell clonogenicity has remained unknown. To address this issue, we analyzed the metabolic profiles of isogenic glioma-initiating cells (GICs) in a mouse model.
Methods
GICs were established by overexpression of H-RasV12 in Ink4a/Arf–null neural stem cells. Subpopulations of these cells were obtained by single-cell cloning, and clones differing in extracellular acidification potential were assessed for metabolic characteristics. Tumors formed after intracranial implantation of these clones in mice were examined for pathological features of glioma and expression of glycolytic enzymes.
Results
Malignant transformation of neural stem cells resulted in a shift in metabolism characterized by an increase in lactic acid production. However, isogenic clonal populations of GICs manifested pronounced differences in glucose and oxygen consumption, lactate production, and nucleoside levels. These differences were paralleled by differential expression of glycolytic enzymes such as hexokinase 2 and pyruvate kinase M2, with this differential expression also being evident in tumors formed by these clones in vivo.
Conclusions
The metabolic characteristics of glioma cells appear early during malignant transformation and persist until the late stages of tumor formation. Even isogenic clones may be heterogeneous in terms of metabolic features, however, suggesting that a more detailed understanding of the metabolic profile of glioma is imperative for effective therapeutic targeting.
Keywords: glioma-initiating cell, GIC, glioma stem cell, metabolism, Warburg effect
See the editorial by Conrad et al, on pages 1025–1026.
The metabolic preference for and capacity to use glycolysis as an energy source under aerobic conditions is a defining characteristic of cancer cells. This preference, known as the Warburg effect, has been confirmed in various types of cancer,1,2 and it is both widely exploited as a diagnostic tool3 and considered an attractive therapeutic target, especially for tumors refractory to radio- and chemotherapy.4
The prognosis of malignant glioma remains poor in spite of the implementation of multimodality treatments.5,6 Glioma cells also tend to present with a metabolic preference for glycolysis, with this feature having served as the basis for the development of PET-based diagnosis.7 In addition, the high rate of lactic acid production by gliomas facilitates noninvasive differential diagnosis by magnetic resonance spectroscopy.8 Furthermore, metabolic targeting strategies are already under development.9,10 However, recent studies have revealed that the metabolic characteristics of glioma cells are not as uniform as initially thought.
Genetic aberrations are a main cause of metabolic heterogeneity. Oncogene-specific differences in glucose uptake and dependency have been demonstrated in glioma cell lines.11 Furthermore, genetically diverse human glioblastomas that exhibited a high rate of glucose uptake on fluorodeoxyglucose-PET were found to use glycolysis or mitochondrial glucose oxidation as an energy source.12 Experimental evidence also suggests that differentiation status might correlate with glucose dependency, with glioma stem cells being less reliant on glycolysis than their differentiated counterparts.13
Given that malignant gliomas, especially glioblastomas, present with a high level of cellular and histological heterogeneity at the time of diagnosis,14 it has been difficult to identify specific metabolic signatures of these tumors. Likewise, it is difficult to determine at which point during tumorigenesis the pathogenic metabolic changes occur, with this issue also not being readily amenable to investigation with well-established cell lines.15 To overcome these problems, we have taken advantage of our syngeneic mouse model of malignant glioma,16,17 which relies on oncogene-specific transformation of neural stem cells to yield genetically similar but phenotypically heterogeneous glioma-initiating cells (GICs). We asked how metabolic preference changes during malignant transformation as well as how such preference relates to the phenotype of the transformed cells and to the histopathology of the final tumor.
We found that neural stem cells transformed by the same oncogenic lesion can give rise to clones that manifest high rates of either glucose or oxygen consumption. These two types of clones similarly retain stem cell–like characteristics such as self-renewal and differentiation ability, and they manifest an equally high tumor-initiating capacity. The tumors formed by these clones after intracranial implantation present a similar histopathology of glioblastoma, but they can be distinguished by the differential expression of glycolytic enzymes that is also apparent in the corresponding GICs.
Materials and Methods
Brain Tumor–initiating Cells
Primary Ink4a/Arf–null neural stem cells (NSCs) and neural progenitor cells (NPCs) were isolated as previously described.16 Human H-RasV12 cDNA (provided by P. P. Pandolfi) was cloned into a modified form of the retroviral vector pMXs-IG (provided by T. Kitamura) in which the coding sequence for green fluorescent protein had been replaced with that for dsRed. Retroviral supernatants were prepared and used to infect the isolated NSCs/NPCs. Cells sorted for dsRed fluorescence were designated RasR, cultured as spheres, and used for subsequent experiments.
Cell Culture
Primary NSCs/NPCs and RasR were maintained as sphere cultures under a humidified atmosphere of 5% CO2 at 37°C in neurosphere medium (NSM), which consists of Dulbecco's modified Eagle's medium (DMEM)–F12 (Sigma) supplemented with recombinant human epidermal growth factor at 20 ng/mL (PeproTech), recombinant human basic fibroblast growth factor at 20 ng/mL (PeproTech), B27 supplement without vitamin A (Invitrogen), heparan sulfate at 200 ng/mL (Sigma), as well as penicillin at 100 U/mL and streptomycin at 100 ng/mL (Nacalai Tesque).
Orthotopic Implantation
Orthotopic implantation of cells was performed as previously described.16 All animal experiments were approved by the Institutional Animal Care and Use Committee of Keio University School of Medicine.
Single-cell Cloning
RasR spheres were dissociated mechanically and enzymatically to yield a single-cell suspension, which was then passed through a filter (pore size, 40 µm) and subjected to limiting dilution. Spheres positive for dsRed that formed in wells that had been allocated one cell were cultured as clonal populations for further experiments.
Determination of Cell Doubling Time
Cells were plated at a density of 1 × 10⁵ per well in 6-well plates and manually counted with the use of a hemocytometer at 0, 24, 48, and 72 h. Doubling time (Td) was calculated from the equation Td = (t2 – t1) × log(2)/log(q2/q1), where q1 and q2 represent the number of cells at times t1 and t2, respectively. Experiments were performed in triplicate.
Immunostaining
For immunohistochemical analysis, tissue was fixed overnight with 4% paraformaldehyde, embedded in paraffin, and sectioned at a thickness of 4 µm. Sections depleted of paraffin were stained with rabbit polyclonal antibodies to Ki67 (NeoMarkers), CD31(Abcam), pyruvate kinase M2 isoform (PKM2), or hexokinase 2 (HK2) (Cell Signaling Technology). Immune complexes were detected with the use of Histofine (Nichirei Bioscience) and ImmPACT diaminobenzidine (Vector Laboratories). For immunocytofluorescence analysis, spheres or cells were fixed with 4% paraformaldehyde and stained with mouse monoclonal antibodies to nestin (Millipore) or to βIII-tubulin (neuron-specific class III beta-tubulin; Covance) or with rabbit polyclonal antibodies to glial fibrillary acidic protein (GFAP; Dako). Immune complexes were detected with Alexa Fluor 488–conjugated secondary antibodies (Molecular Probes). Nuclei were counterstained with 4′,6-diamidino-2-phenylindole (DAPI) (VectaStain). Images were acquired with a BZ9000 inverted fluorescence microscope (Keyence) and digitally processed with Keyence Analysis Software.
Sphere Formation Assay
Cells were plated in 96-well plates at a density of one cell per well either manually or by flow cytometry (MoFlo cytometer, DakoCytomation). The number of spheres formed was counted 14 days after plating. Three plates were counted for each independent experiment.
Metabolite Analysis
Cells were plated at equal numbers and cultured for 48 h in NSM. They were then washed twice with 0.5% mannitol before the addition of 1.3 mL methanol containing internal standards (methionine sulfone and 2-(N-morpholino)-ethanesulfonic acid, each at 10 µM). The cells were immediately frozen and stored at –80°C until further analysis. Metabolite extraction and capillary electrophoresis–time-of-flight mass spectrometry (CE-TOFMS) were performed as previously described.18 Metabolite levels were determined in triplicate samples, normalized by the concentration of the internal standards, and adjusted for cell number. Average adenylate charge was calculated as: (ATP + ADP/2)/(ATP + ADP + AMP).
Measurement of Lactate Production and Glucose Consumption
Cellular lactate production was measured under normoxia with the use of a Lactate Assay Kit II (BioVision). For measurement of glucose consumption, cells were plated at a density of 1 × 10⁶/mL/well in 6-well plates and incubated in glucose-free NSM for 2 h at 37°C. After the addition of 2-[N-(7-nitrobenz-2-oxa-1,3-diazol-4-yl)amino]-2-deoxy-D-glucose (2-NBDG) to a final concentration of 0.1 mM, the cells were incubated for an additional 1 h, washed twice with phosphate buffered saline, and analyzed by flow cytometry (Calibur flowcytometer, Becton-Dickinson). Samples stored on ice immediately after the addition of 2-NBDG were used as controls.
Oxygen Consumption and Extracellular Acidification Rate
The oxygen consumption rate (OCR) and extracellular acidification rate (ECAR) were determined using the Seahorse XF Extracellular Flux Analyzer and XF Cell Mito Stress Test Kit (Seahorse Bioscience), according to manufacturer's protocol. Briefly, 24-well plates (Seahorse Bioscience) were coated with Matrigel (BD Biosciences) diluted 1 : 10 in extracellular flux (XF) assay medium (Seahorse Bioscience). Cells were dissociated and plated at densities of 80 000 or 100 000 cells per well in NSM and allowed to attach overnight. Prior to the assay, cells were incubated in Seahorse XF assay medium supplemented with 17.5 mM glucose and 2 mM pyruvate for 1 h. For evaluation of mitochondrial function, 3 metabolic inhibitors were sequentially dispensed as follows: oligomycin (inhibitor of ATP synthase, 500 nM), followed by carbonylcyanide-p-trifluoromethoxyphenylhydrazone (FCCP, uncoupler of mitochondrial oxidative phosphorylation, 1 µM) and a combination of rotenone (mitochondrial complex I inhibitor, 100 nM) and antimycin A (complex III inhibitor, 100 nM). Basal OCR, ECAR, and changes induced by the above inhibitors were measured. Experiments were performed in triplicate.
Immunoblot Analysis
Total protein was extracted from cells by their repeated passage through a 25-gauge needle in radioimmunoprecipitation assay buffer (Sigma-Aldrich). Extracts were fractionated by sodium dodecylsulfate–polyacrylamide gel electrophoresis, and the separated proteins were transferred to a polyvinylidene difluoride membrane (Bio-Rad) with the use of a Trans-Blot Turbo Transfer Starter System (Bio-Rad). Immunoblot analysis was performed with antibodies to p16 (rabbit), H-Ras (rabbit), and β-actin (mouse) from Santa Cruz; HK2 (rabbit), phospho-PKM2 (rabbit), and PKM2 (rabbit) from Cell Signaling Technology; lactate dehydrogenase A (LDHA; rabbit) from Epitomics; and pyruvate dehydrogenase kinase isozyme 1 (PDK1; rabbit) from Abcam. Immune complexes were detected with horseradish peroxidase–conjugated secondary antibodies and an enhanced chemiluminescence detection system (Nacalai Tesque).
Statistical Analysis
Quantitative data are presented as means ± SD where indicated and were compared with an unpaired Student's t test. Kaplan–Meier survival analysis was performed with the use of JMP7 software (SAS Institute). P < .05 was considered statistically significant.
Results
H-Ras–transduced Neural Stem Cells/Neural Progenitor Cells Give Rise to Glioma-initiating Cells With Different Glucose Metabolic Characteristics
To investigate changes in energy metabolism during glioma formation, we studied our previously described murine glioblastoma model,16,17 which allows the establishment of fluorescently labeled tumorigenic cells with a homogeneous genetic background. In this model, GICs are obtained by transduction of Ink4a/Arf–null NSCs/NPCs with a retroviral vector for the oncoprotein H-RasV12. The H-Ras–transduced cells retain stem cell characteristics such as self-renewal and differentiation ability, and they form tumors that are highly similar to human glioblastoma when implanted into the forebrain of wild-type mice.16 In the present study, we transduced Ink4a/Arf–null NSCs/NPCs with a retroviral vector encoding both H-RasV12 and the fluorescent protein dsRed. The resulting population of cells was designated RasR. Single-cell cloning revealed that ∼50% of RasR cells were able to form spheres. The clonal subpopulations varied in their capacity to acidify the extracellular environment, as demonstrated by a significant color change in the culture medium. Approximately 70% of the clones had an estimated high extracellular acidification capacity (Supplementary Fig. S1). Propagation of the fluorescent clonal subpopulations obtained from single cells resulted in isolation of several clones with different adhesive, tumor-initiating, and proliferative properties. Two clones (A and B) with the most distinct acidifying capacities were selected for subsequent metabolic analysis.
Both clones could be propagated in floating culture under neurosphere culture conditions (Fig. 1A). As expected, they were both null for p16Ink4a, a product of the Ink4a/Arf locus, and they both expressed Ras at a higher level compared with the parental RasR cells (Fig. 1B). To determine whether both clones were able to function as GICs, we implanted the cells into the forebrains of immunocompetent mice. Both clones formed aggressive brain tumors with a penetrance of 100% (Fig. 1C). The median survival time of mice injected with either clone was shorter than that of those injected with RasR cells, but it did not differ significantly between the 2 clones (Fig. 1C). As observed during selection of the clones, clone A exhibited a significantly higher capacity for extracellular acidification as a result of an increased rate of lactic acid production (Fig. 1D). Nontransformed Ink4a/Arf–null NSCs/NPCs produced lactic acid at a rate lower than that for either clone. We next determined the glucose consumption rate of the 2 clones under normoxic conditions. Clone A exhibited a higher rate of uptake for the fluorescently labeled D-glucose analog 2-NBDG compared with both clone B and parental nontransformed NSCs/NPCs (Fig. 1E).
Fig. 1.

Establishment of GICs with different metabolic properties. (A) Spheres formed by clones A and B under neurosphere culture conditions. Scale bars, 50 μm. (B) Immunoblot analysis of p16Ink4a, H-Ras, and β-actin (loading control) in nontransformed NSCs/NPCs from wild-type (WT) or Ink4a/Arf–null mice, in clones A and B and in RasR cells. (C) Survival curves for wild-type mice (n = 6) after orthotopic implantation of clones A or B or RasR cells (1 × 10⁵ cells each). NS, not significant. (D) Lactate production by Ink4a/Arf–null NSCs/NPCs as well as by clones A and B. Data are means ± SD from 3 independent experiments. *P < .05. Images of the corresponding cell culture medium are shown above the bar graph. (E) Flow cytometric analysis of 2-NBDG uptake (solid traces) by Ink4a/Arf–null NSCs/NPCs as well as by clones A and B. Open traces, control. Data are representative of 3 independent experiments. Quantification of 2-NBDG uptake as difference in mean fluorescence intensity (MFI) between samples and controls. NS, not significant, *P < .05.
Preferential Utilization of Different Metabolic Pathways in Distinct Glioma-initiating Cells
To investigate further the metabolic characteristics of clones A and B, we analyzed intracellular metabolites by CE-TOFMS. Clone A had significantly higher intracellular levels of lactic acid and fructose 6-phosphate than clone B (Fig. 2A). Furthermore, glycolysis intermediates such as glucose 6-phosphate and glucose 1-phosphate were also higher in clone A, although this difference failed to reach statistical significance. Another pronounced difference was observed in the abundance of nucleosides, levels of which were significantly higher in clone A (Fig. 2B). The levels of other metabolite groups, such as the tricarboxylic acid cycle intermediates, showed no consistent tendency (data not shown). Interestingly, the only significant difference between nontransformed NSCs/NPCs and both clones as well as the polyclonal transformed population, was in the levels of lactic acid, which were higher in malignant cells (Fig. 2A). In contrast, total adenylate energy charge, a measure of the energy level of the cells, was no conclusive indicator for the malignant change (Fig. 2C). Levels of creatine and creatinine were significantly lower in both clones than in the nontransformed NSCs/NPCs (Fig. 2D), consistent with reports that creatine levels are lower in glioblastoma cells compared with normal cells. This difference was not detectable in the polyclonal population. These results thus revealed that while transformation does alter the metabolic status of NSCs/NPCs, clonal analysis is required to identify early changes.
Fig. 2.

Metabolome analysis of GIC clones. (A) Intracellular levels of glycolytic intermediates, (B) intermediates of nucleoside metabolism, (C) total adenylate charge, and (D) creatine metabolism were determined by CE-TOFMS. Data represent metabolite levels in nmol/per 106 cells (A, B, D) and are means ± SD of triplicate samples. NS, not significant. #, ##, ** P < .05 relative to Ink4a/Arf–null NSCs/NPCs; * P < .05 relative to clone A.
To further examine the differences in the operation of metabolic pathways between the isogenic clonal populations, we performed extracellular metabolic flux analysis. The ECAR, considered a proxy for glycolysis, was significantly higher in clone A (P < .05; Fig. 3A), validating the selection method and suggesting glycolysis as a main energy source in this clone. Quantification of the OCR revealed that, at basal level, clone B consumed significantly more oxygen than clone A (P < .05), suggesting a robust mitochondrial respiration (Fig. 3A). Loss of mitochondrial ATP-generating capacity after oligomycin treatment resulted in glycolytic compensation in both clones, with a more pronounced increase in ECAR for clone B (Fig. 3B and S2). Uncoupling of oxidative phosphorylation using FCCP revealed a significantly higher reserve mitochondrial capacity for clone B than for clone A (P < .05; Fig. 3B and S2).
Fig. 3.

Extracellular flux analysis of GICs. (A) OCR and ECAR at basal levels (80 000 cells/well) and (B) OCR and ECAR after treatment with indicated inhibitors (100 000 cells/well) were assessed by extracellular flux analysis. Data are means ± SD from a representative experiment. (C) Immunoblot analysis of glycolysis-related enzymes in Ink4a/Arf–null NSCs/NPCs, RasR, clones A and B.
To investigate the molecular basis for the difference in metabolic preference between the 2 clones, we performed immunoblot analysis of enzymes related to glycolysis. The abundance of HK2, PKM2, LDHA, and PDK1 was greater in clone A than in clone B (Fig. 3C), results consistent with a higher utilization of glycolysis.
Clone A and Clone B Are Immature Cells With Stem Cell–like Properties
We next examined whether the differences in energy metabolism between clones A and B reflected a specific phenotypic characteristic, such as proliferation or differentiation status. The doubling time of both clones was shorter than that of the Ink4a/Arf–null NSCs/NPCs of origin, with values of 12.80 ± 1.34 h for clone A, 16.84 ± 1.15 h for clone B, and 21.78 ± 2.15 h for the nontransformed parental cells (Fig. 4A). As a proxy for self-renewal ability, we measured sphere formation by each clone. Both clones showed a sphere formation rate of 50%–60% (Fig. 4B). Immunocytofluorescence analysis also revealed that both clones consisted of cells positive for the immature cell marker nestin and were able to differentiate into cells of the neuronal (βIII-tubulin positive) and astrocytic (GFAP positive) lineages on exposure to serum (Fig. 4C). These results thus indicated that clones A and B retain certain stem cell–like properties, including sphere-forming ability and the ability to differentiate, with clone A representing a slightly more proliferative subpopulation.
Fig. 4.
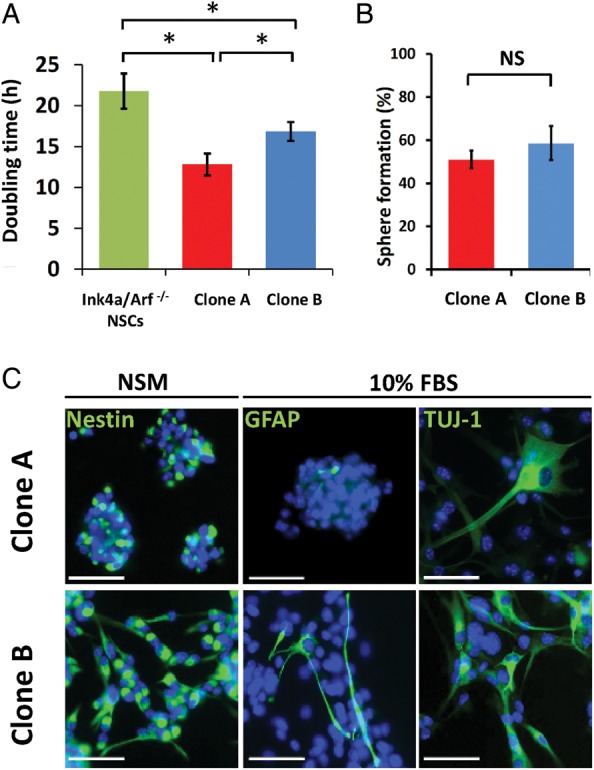
Phenotypical analysis of isogenic GIC clones. (A) Doubling time of Ink4a/Arf–null NSCs/NPCs as well as of clones A and B. Data are means ± SD from 3 independent experiments. *P < .05. (B) Rate of sphere formation by clones A and B. Data are means ± SD from a representative experiment. *P < .05. (C) Immunofluorescence staining (green fluorescence) of clones A and B for markers of immature cells (nestin), astrocytes (GFAP), and neurons (βIII-tubulin as recognized by antibody for neuron-specific class III β-tubulin [TUJ-1]). Cells stained for nestin were cultured in NSM, whereas those stained for GFAP and βIII-tubulin were cultured in DMEM-F12 supplemented with 10% FBS for 2 weeks. Nuclei were counterstained with DAPI (blue fluorescence). Scale bars, 50 μm.
Clones A and B Form Tumors Similar to Human Glioblastoma
Finally, we investigated whether the differences in metabolism between GIC clones might affect the pathological phenotype of formed tumors. When implanted into the forebrain of wild-type mice, both clones formed highly aggressive tumors (Fig. 1C) with a distinct invasive front (Fig. 5A). Tumors formed from both clones showed a high level of cellular and histological pleomorphism (Fig. 5B) and manifested pseudopalisading (Fig. 5C) and microvascular proliferation (Fig. 5D), characteristics similar to those of human glioblastoma. Furthermore, immunohistochemical staining of Ki67 revealed the tumor cells to be highly proliferative (Fig. 5E). Overall, both clones formed highly malignant brain tumors with no marked differences in histopathology and very similar to those formed by the polyclonal RasR. Further immunohistochemical evaluation revealed that the levels of both PKM2 and HK2 were markedly higher in the tumors formed by clone A than in those formed by clone B (Fig. 6), suggesting that the metabolic characteristics of the 2 subpopulations are maintained throughout tumor formation.
Fig. 5.

Histological analysis of tumors formed by clones A and B. Tumors formed 5 weeks after orthotopic implantation of RasR and 3 weeks after implantation of clones A or B into wild-type mice were evaluated by (A–C) hematoxylin-eosin (HE) staining as well as by (D) immunohistochemical staining of CD31 to detect blood vessels and (E) of Ki67 to detect proliferating cells. Invasion fronts are shown in (A), cellular pleomorphism in (B), and pseudopalisading in (C). The percentage of tumor cells positive for Ki67 is indicated in (E). Scale bars: 50 μm (A, D, E) and 100 μm (B and C).
Fig. 6.
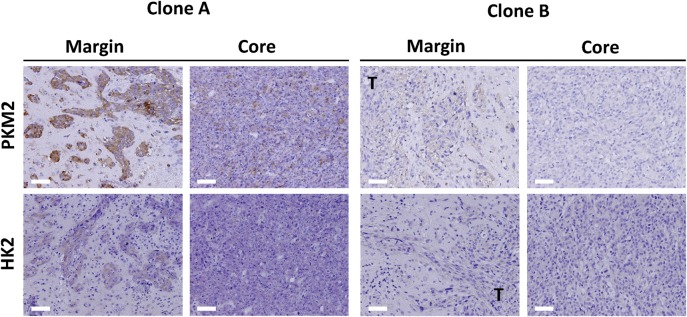
Immunohistological evaluation of glycolytic enzymes in tumors formed by GIC clones. Tumors formed 3 weeks after orthotopic implantation of clones A or B into wild-type mice were subjected to immunohistochemical staining of PKM2 or HK2 at the invasion front (margin) or tumor core. T, tumor. Scale bars, 50 μm.
Discussion
In the present study, we asked how the energy metabolism of NSCs/NPCs changes during the early stages of malignant transformation by a specific oncogene and how such changes relate to cellular phenotype as well as to tumor formation and pathology. Our results showed that, as expected, transformation changed the metabolic profile of NSCs/NPCs. However, while an increase in lactic acid production was apparent for all transformed cells, the source of energy production was not uniform among the malignant cells, with isogenic clones showing preferences for either glucose or oxygen consumption. We further found that H-Ras–transformed clones similarly retained stem cell–like properties, such as self-renewal and differentiation ability, and manifested similar tumorigenic potential independent of their metabolic preference, forming pathologically similar, but metabolically distinguishable, glioblastoma-like tumors.
In terms of metabolic preference, clone A relies mainly on glucose uptake and glycolysis for energy production, but also possesses a certain degree of reserve mitochondrial capacity. In contrast, clone B relies more on mitochondrial respiration, has a high reserve mitochondrial capacity, and can switch to glycolytic compensation. The existence of such clones within a polyclonal population with an apparently glycolytic profile could have profound implications on treatment outcomes. Our findings suggest a metabolic resilience of the transformed GICs, which could result in resistance to drugs targeting glycolysis or mitochondrial respiration, as well as to combinations of those drugs. Indeed, it has been suggested that human glioma stem cells and progenitor cells also display such compensation in metabolism, and it has been shown that even the combined use of 2-deoxyglucose and oligomycin could not completely deplete cellular ATP.13
Phenotypically, the metabolic features of clone A—increased rates of glucose consumption, lactate production, and nucleoside abundance—correspond to a metabolic profile traditionally attributed to highly cycling cancer cells.19 At a functional level, given the stepwise increase in proliferation rate from NSCs/NPCs to clone B and to clone A, it is possible that clone B represents a population more similar to slow-cycling stem cells, whereas clone A is more similar to a transit-amplifying progenitor. In this case, our results would be in agreement with existing data showing that glioma stem cells established from several glioma cell lines are less glycolytic than their differentiated progeny.13 Given that normal stem cells, such as hematopoietic and pluripotent stem cells, are glycolytic20,21 and shift to oxidative phosphorylation on differentiation,22 our results may reveal a characteristic pertinent to glioma stem cells only.
An alternative explanation might be that in spite of the difference in doubling time, both clones A and B simply represent 2 different subpopulations of immature cells with a similar differentiation status, as suggested by their equally high rate of sphere formation and ability to differentiate into more than one lineage after exposure to serum. Indeed, cells with stem cell–like characteristics isolated from human glioblastoma specimens have been found to fall into distinct subgroups based on molecular and phenotypic criteria.23 Finally, given that neither the Ki67 index of tumors formed in vivo nor the survival curves of host mice differed substantially between clones A and B, the difference in proliferation apparent in vitro might reflect a higher sensitivity of clone A to epidermal and fibroblast growth factors, which sustain growth in the sphere culture system. In both latter cases, further investigation is required to show which metabolic phenotype represents a better target in glioblastoma as well as to identify the key target molecules.
At the molecular level, clones A and B differ in their expression of enzymes related to glycolysis. The abundance of HK2, PKM2, and LDHA was thus increased in clone A. The expression of all of these enzymes is known to be upregulated by hypoxia-inducible factor 1 (HIF1), a transcription factor, under hypoxic conditions and by c-Myc under normoxic conditions.24,25 Furthermore, the expression of both c-Myc and HIF1 is upregulated and correlates with the grade of malignancy in gliomas, with c-Myc being especially abundant in glioma stem cells.26,27 Whereas further studies are necessary to identify the targetable factor for each metabolic profile, the metabolic differences they induce in our model represent a valid starting point for further investigations.
An important next step will be to characterize the metabolic profiles of tumor cells obtained from the clonal allografts. Our results show that tumors established from clones A and B retain at least some of the differences apparent in the respective GICs, such as differential immunoreactivity for PKM2 and HK2, on a background of similar histopathology. Tumor cells were readily detectable even at the invasive front, suggesting that metabolic features might be exploited to complement the pathological diagnostic. In our experimental model, the isolation and propagation of stem cells from the tumors formed by each clone will allow investigation of the stability or, conversely, the plasticity of these phenotypes, their response to in vivo modulation, and their sensitivity to currently available or metabolism-targeted therapies.
In conclusion, our results show that metabolic characteristics of glioma cells appear early during malignant transformation and persist until the late stages of tumor formation, validating metabolic targeting as a promising new therapeutic approach. However, given that even isogenic clones can manifest heterogeneous metabolic features, a more detailed understanding of subpopulations with different metabolic profiles is imperative for effective metabolic targeting in malignant glioma.
Supplementary Material
Funding
This work was supported by the Ministry of Education, Culture, Sports, Science, and Technology of Japan (MEXT) Kakenhi grant nos. 22249055 and 24700986, and the Japan Society for the Promotion of Science (research fellowship to S.O.).
Supplementary Material
Acknowledgments
We thank Y. Matsuzaki and S. Suzuki (Keio University) for cell sorting by flow cytometry; I. Ishimatsu for preparing samples for histopathology; K. Arai for help in preparation of the manuscript; and the Collaborative Research Resources, School of Medicine, Keio University, for technical assistance.
Conflict of interest statement. None declared.
References
- 1.Warburg O. On the origin of cancer cells. Science. 1956;123(3191):309–314. doi: 10.1126/science.123.3191.309. [DOI] [PubMed] [Google Scholar]
- 2.Dang CV, Semenza GL. Oncogenic alterations of metabolism. Trends Biochem Sci. 1999;24(2):68–72. doi: 10.1016/s0968-0004(98)01344-9. [DOI] [PubMed] [Google Scholar]
- 3.Gambhir SS, Czernin J, Schwimmer J, et al. A tabulated summary of the FDG PET literature. J Nucl Med. 2001;42(5 Suppl):1S–93S. [PubMed] [Google Scholar]
- 4.Porporato PE, Dhup S, Dadhich RK, et al. Anticancer targets in the glycolytic metabolism of tumors: a comprehensive review. Front Pharmacol. 2011;2:49. doi: 10.3389/fphar.2011.00049. doi:10.3389/fphar.2011.00049. [DOI] [PMC free article] [PubMed] [Google Scholar]
- 5.Stupp R, Hegi ME, Neyns B, et al. Phase I/IIa study of cilengitide and temozolomide with concomitant radiotherapy followed by cilengitide and temozolomide maintenance therapy in patients with newly diagnosed glioblastoma. J Clin Oncol. 2010;28(16):2712–2718. doi: 10.1200/JCO.2009.26.6650. [DOI] [PubMed] [Google Scholar]
- 6.Huse JT, Holland EC. Targeting brain cancer: advances in the molecular pathology of malignant glioma and medulloblastoma. Nat Rev Cancer. 2010;10(5):319–331. doi: 10.1038/nrc2818. [DOI] [PubMed] [Google Scholar]
- 7.la Fougere C, Suchorska B, Bartenstein P, et al. Molecular imaging of gliomas with PET: opportunities and limitations. Neuro Oncol. 2011;13(8):806–819. doi: 10.1093/neuonc/nor054. [DOI] [PMC free article] [PubMed] [Google Scholar]
- 8.Di Costanzo A, Scarabino T, Trojsi F, et al. Proton MR spectroscopy of cerebral gliomas at 3 T: spatial heterogeneity, and tumour grade and extent. Eur Radiol. 2008;18(8):1727–1735. doi: 10.1007/s00330-008-0938-5. [DOI] [PubMed] [Google Scholar]
- 9.Michelakis ED, Sutendra G, Dromparis P, et al. Metabolic modulation of glioblastoma with dichloroacetate. Sci Transl Med. 2010;2(31):31ra34. doi: 10.1126/scitranslmed.3000677. [DOI] [PubMed] [Google Scholar]
- 10.Park JM, Recht LD, Josan S, et al. Metabolic response of glioma to dichloroacetate measured in vivo by hyperpolarized (13)C magnetic resonance spectroscopic imaging. Neuro Oncol. 2013;15(4):433–441. doi: 10.1093/neuonc/nos319. [DOI] [PMC free article] [PubMed] [Google Scholar]
- 11.Elstrom RL, Bauer DE, Buzzai M, et al. Akt stimulates aerobic glycolysis in cancer cells. Cancer Res. 2004;64(11):3892–3899. doi: 10.1158/0008-5472.CAN-03-2904. [DOI] [PubMed] [Google Scholar]
- 12.Marin-Valencia I, Yang C, Mashimo T, et al. Analysis of tumor metabolism reveals mitochondrial glucose oxidation in genetically diverse human glioblastomas in the mouse brain in vivo. Cell Metab. 2012;15(6):827–837. doi: 10.1016/j.cmet.2012.05.001. [DOI] [PMC free article] [PubMed] [Google Scholar]
- 13.Vlashi E, Lagadec C, Vergnes L, et al. Metabolic state of glioma stem cells and nontumorigenic cells. Proc Natl Acad Sci U S A. 2011;108(38):16062–16067. doi: 10.1073/pnas.1106704108. [DOI] [PMC free article] [PubMed] [Google Scholar]
- 14.Verhaak RG, Hoadley KA, Purdom E, et al. Integrated genomic analysis identifies clinically relevant subtypes of glioblastoma characterized by abnormalities in PDGFRA, IDH1, EGFR, and NF1. Cancer Cell. 2010;17(1):98–110. doi: 10.1016/j.ccr.2009.12.020. [DOI] [PMC free article] [PubMed] [Google Scholar]
- 15.Griguer CE, Oliva CR, Gillespie GY. Glucose metabolism heterogeneity in human and mouse malignant glioma cell lines. J Neurooncol. 2005;74(2):123–133. doi: 10.1007/s11060-004-6404-6. [DOI] [PubMed] [Google Scholar]
- 16.Sampetrean O, Saga I, Nakanishi M, et al. Invasion precedes tumor mass formation in a malignant brain tumor model of genetically modified neural stem cells. Neoplasia. 2011;13(9):784–791. doi: 10.1593/neo.11624. [DOI] [PMC free article] [PubMed] [Google Scholar]
- 17.Osuka S, Sampetrean O, Shimizu T, et al. IGF1 receptor signaling regulates adaptive radioprotection in glioma stem cells. Stem Cells. 2013;31(4):627–640. doi: 10.1002/stem.1328. [DOI] [PubMed] [Google Scholar]
- 18.Urakami K, Zangiacomi V, Yamaguchi K, et al. Quantitative metabolome profiling of Illicium anisatum by capillary electrophoresis time-of-flight mass spectrometry. Biomed Res. 2010;31(2):161–163. doi: 10.2220/biomedres.31.161. [DOI] [PubMed] [Google Scholar]
- 19.DeBerardinis RJ, Lum JJ, Hatzivassiliou G, et al. The biology of cancer: metabolic reprogramming fuels cell growth and proliferation. Cell Metab. 2008;7(1):11–20. doi: 10.1016/j.cmet.2007.10.002. [DOI] [PubMed] [Google Scholar]
- 20.Suda T, Takubo K, Semenza GL. Metabolic regulation of hematopoietic stem cells in the hypoxic niche. Cell Stem Cell. 2011;9(4):298–310. doi: 10.1016/j.stem.2011.09.010. [DOI] [PubMed] [Google Scholar]
- 21.Takubo K, Nagamatsu G, Kobayashi CI, et al. Regulation of glycolysis by Pdk functions as a metabolic checkpoint for cell cycle quiescence in hematopoietic stem cells. Cell Stem Cell. 2013;12(1):49–61. doi: 10.1016/j.stem.2012.10.011. [DOI] [PMC free article] [PubMed] [Google Scholar]
- 22.Zhang J, Nuebel E, Daley GQ, et al. Metabolic regulation in pluripotent stem cells during reprogramming and self-renewal. Cell Stem Cell. 2012;11(5):589–595. doi: 10.1016/j.stem.2012.10.005. [DOI] [PMC free article] [PubMed] [Google Scholar]
- 23.Gunther HS, Schmidt NO, Phillips HS, et al. Glioblastoma-derived stem cell–enriched cultures form distinct subgroups according to molecular and phenotypic criteria. Oncogene. 2008;27(20):2897–2909. doi: 10.1038/sj.onc.1210949. [DOI] [PubMed] [Google Scholar]
- 24.Kim JW, Gao P, Liu YC, et al. Hypoxia-inducible factor 1 and dysregulated c-Myc cooperatively induce vascular endothelial growth factor and metabolic switches hexokinase 2 and pyruvate dehydrogenase kinase 1. Mol Cell Biol. 2007;27(21):7381–7393. doi: 10.1128/MCB.00440-07. [DOI] [PMC free article] [PubMed] [Google Scholar]
- 25.Dang CV, Kim JW, Gao P, et al. The interplay between MYC and HIF in cancer. Nat Rev Cancer. 2008;8(1):51–56. doi: 10.1038/nrc2274. [DOI] [PubMed] [Google Scholar]
- 26.Wang J, Wang H, Li Z, et al. c-Myc is required for maintenance of glioma cancer stem cells. PLoS One. 2008;3(11):e3769. doi: 10.1371/journal.pone.0003769. [DOI] [PMC free article] [PubMed] [Google Scholar]
- 27.Herms JW, von Loewenich FD, Behnke J, et al. c-Myc oncogene family expression in glioblastoma and survival. Surg Neurol. 1999;51(5):536–542. doi: 10.1016/s0090-3019(98)00028-7. [DOI] [PubMed] [Google Scholar]
Associated Data
This section collects any data citations, data availability statements, or supplementary materials included in this article.