

Abstract

Systems analysis of chromatin has been constrained by complex patterns and dynamics of histone post-translational modifications (PTMs), which represent major challenges for both mass spectrometry (MS) and immuno-based approaches (e.g., chromatin immuno-precipitation, ChIP). Here we present a proof-of-concept study demonstrating that crosstalk among PTMs and their functional significance can be revealed via systematic bioinformatic and proteomic analysis of steady-state histone PTM levels from cells under various perturbations. Using high resolution tandem MS, we quantified 53 modification states from all core histones and their conserved variants in the unicellular eukaryotic model organism Tetrahymena. By correlating histone PTM patterns across 15 different conditions, including various physiological states and mutations of key histone modifying enzymes, we identified 5 specific chromatin states with characteristic covarying histone PTMs and associated them with distinctive functions in replication, transcription, and DNA repair. In addition to providing a detailed picture on histone PTM crosstalk at global levels, this work has established a novel bioinformatic and proteomic approach, which can be adapted to other organisms and readily scaled up to allow increased resolution of chromatin states.
Keywords: posttranslational modification, mass spectrometry, histone code, histone H3 lysine 27 methylation, histone methyltransferase, histone demethylase, ubiquitin E3 ligase, chromatin states
Introduction
Nuclear DNA is packaged into chromatin with histones and other substoichiometric protein components. Necessitated by its involvement in essentially all aspects of DNA transactions, including replication, transcription, and repair,1 chromatin is a very complex molecular system, with numerous associated proteins and even more posttranslational modifications (PTM). Of particular interest are a large number of histone PTMs, which combinatorially regulate diverse nuclear functions, as outlined by the histone code hypothesis.2,3 Histone PTMs are specifically recognized by effectors connecting to downstream pathways,4 and their addition and removal by histone modifying enzymes are crucial for chromatin functions.5 Histone PTMs are often not independent. In its simplest form, specific residues (e.g., lysine) may be alternatively modified by several types of PTMs (e.g., acetylation, methylation, glycosylation, ubiquitinylation, and formylation), making these PTMs mutually exclusive at particular positions of proteins.6,7 Positive and negative correlations among PTMs at different residues within a histone (cis) and even across different histones (trans), generally referred to as crosstalk, have also been revealed by analyzing substrate specificities of histone modifying enzymes and genome-wide distribution patterns of histone PTMs.6−10 The cis- and trans-crosstalk reflects communication within and between nucleosomes mediated by effectors and histone modifying enzymes. These communication networks result in discrete chromatin states, which enable selective nuclear functions.
Characterizing this crosstalk is challenging, given the long and still growing list of PTMs, as well as their cognate enzymes and effectors. This is further compounded by the astronomically large probability space generated by combinatorial patterns of modifications. Systems biology approaches that extract correlative patterns of histone PTMs (as well as chromatin associated proteins) in their genomic distribution greatly simplify the problem and have gained popularity due to the increasing availability of microarray and deep-sequencing based techniques for massively parallel queries (exemplified by the ENCODE and modENCODE projects, see the Discussion section). Nonetheless, our ability to model crosstalk is still hampered by the scope of data sets, which are limited predominantly to those candidate PTMs specifically recognized by available antibodies. Here we test an alternative systems biology approach, which characterizes histone PTMs whose global levels change in correlative ways in response to internal and external perturbations, based upon accurate MS quantification (Figure 1). Our results demonstrate that this unbiased and highly scalable search for clusters of crosstalking histone PTMs can effectively reveal hidden chromatin features and provide important clues to their biological functions.
Figure 1.

Overall workflow. Wild-type or knockout cells collected under growing, starving, or conjugating conditions were unlabeled, while one wild-type cell line was 15N-metabolically labeled. Histones from all cell lines were acid extracted and separated by C8 reversed-phase HPLC. Each type of core histones was equally mixed with the same type of 15N-labeled core histones, which served as global internal standards. Protein digests were analyzed by nanoflow liquid chromatography coupled with a high-resolution LTQ Orbitrap-XL mass spectrometer. A PTM quantification matrix reflecting perturbed chromatin profiles was generated. Multivariate statistical models were employed to reveal hidden chromatin features and PTM crosstalk.
Materials and Methods
Cell Growth, 15N Metabolic Labeling, and Histone Preparation
Histone modifying enzyme knockout strains were derived from wild-type Tetrahymena CU428 cells. Their potential modification sites are listed in Supplementary Table 1. All knockout strains were verified by quantitative PCR.
All media, procedures, and protocols used for cell growth, 15N uniform labeling, and histone separation and purification were as previously described.11 For actively growing cells, all strains were grown in 1× SPP medium at 30 °C with gentle shaking to logarithmic phase (2 × 10⁵/mL). For starvation, growing cells were collected and washed once with 10 mM Tris, pH 7.4, and then starved in the Tris buffer for 24 h at 30 °C. Conjugation was initiated by mixing equal numbers of cells with different mating types, after 24 h starvation at 30 °C. Cells were collected 4 h after the initiation of conjugation, with ∼80% pairing efficiency.
Crude histones were acid-extracted and prepared from macronuclei prior to HPLC purification. A C8 reversed-phase column was used to separate individual histones. LC fractions were evaluated by 15% SDS-PAGE, and identical histone fractions from multiple runs were subsequently combined. Concentrations of core histones were determined by the Bradford method. The general strategy and experimental design are illustrated in Figure 1.
Quantitative Analysis of Histone PTMs by Mass Spectrometry
Histone samples were analyzed in biological duplicates or triplicates. Detailed sample information is listed in Supplementary Table 2. Propionylation, trypsinization, and nanoLC–MS analysis of histone samples were all performed as previously described.11,12 Raw data processing, database searching, and peptide quantification were all performed in Mascot Distiller (Matrix Sciences, Version 2.4 for distiller and Version 2.2.07 for search engine). In performing the database searching, an in-house Tetrahymena database was created from NCBI on 5/25/2010 with a total of 51,502 sequence entries. The ion tolerance was 10 ppm for MS1 and 0.8 Da for MS2. N-terminal propionylation was considered a fixed modification. Variable modifications were Acetylation (Protein N-terminus, K), Methylation (Protein N-terminus, KR), Propionylation (K, unmodified or monomethylated). Five missed cleavages were allowed for trypsin digestion due to the high number of lysyl residue modifications in histones from PTMs or propionylation. The following peptides from core histones were selected for normalization on the basis of their stable ratios and low variations in all strains: TASSKQVSR, GQASQDL, FLKHGR in H2A; IALESSKLVR, RTLSSR in H2B; FRPGTVALR, VTIMTKDMQLAR, YQKSTDLLIR in H3; and ISSFIYDDSR, RKTVTAMDVVYALKR in H4. We assumed that the levels of those peptides were consistently unchanged and their ratios (L/H) were very close to 1 in all experiments. All biological and technical replicates were combined for database searching and peptide quantification in order to minimize the proteomics missing data problem. Thus, the final ratio is the average ratio of all replicates. Furthermore, PTMs were all averaged over the same modification found in multiple charge states, different propionylation degrees, or multiple peptides. All spectra assigned with PTMs were manually validated on the basis of the same criteria we published previously.11,13
The data sets associated with this study are deposited in PeptideAtlas (http://www.peptideatlas.org/) with Identifier: PASS00506 and Password: MD4544qct.
Multivariate Statistical Analysis of Histone PTM Data
Clustering analysis and factor analysis (FA) were performed with routines written in the statistical programming language R (http://www.r-project.org/). All normalized PTM ratios were base-2 log transformed. For clustering analysis, the Partitioning Around Medoids (PAM) algorithm, a robust version of the K-means clustering statistical technique, or Ward’s hierarchical clustering method was used to search for functionally related histone modifications. More details are provided in the appendix “R code” in Supporting Information. Factor analysis is a model based version of Principal Component Analysis whose essential purpose is to describe the relationships between variables based on a data covariance matrix. The primary concern in the FA model is whether the observed variables can be reduced to a lower number of unobserved underlying variables called common factors based on the data correlation structure. In detail, it is assumed that X is a p-variate random vector and each observation satisfies the following equation:
where λ are factor loadings, Fk are common factors, and μj are errors. Alternatively in matrix notation, X = ΛF + U. In this model, F and U are independent and are multivariate normal both with expectations equal to zero. The number of factors was estimated by PCA screeplot according to the following rules: (1) number of eigenvalues greater than one and (2) % of variance explained by factors. The largest fractional change in the variance occurred between 5 and 6 factors.
Results
Global Analysis of Histone PTMs in Perturbed Chromatin States
Our study was performed in Tetrahymena, a well established unicellular eukaryotic model organism for research in epigenetics and chromatin biology.14 As external perturbations, we examined Tetrahymena cells under three different physiological conditions: (1) mid log phase growth, featuring active replication and transcription; (2) starvation, featuring replication arrest and an alternate transcription profile; and (3) early conjugation (the sexual phase of Tetrahymena life cycle, induced by mixing starved cells of two different mating types), featuring meiosis and an alternate transcription profile. As internal perturbations, we examined Tetrahymena mutants affecting five key genes encoding conserved histone modifying enzymes. In this study we focused primarily on genes potentially affecting histone H3 methylation, including two histone methyltransferases (TXR1, TTHERM_00256950 and EZL2, TTHERM_00300320), two histone demethylases (JMJ1, TTHERM_00185640 and JMJ2, TTHERM_00467690), and a ubiquitin E3 ligase (RIN1, TTHERM_00263030) (Supplementary Table 1). We have previously shown that the primary products for EZL2, homologous to E(z) in the Polycomb Repressive Complex 2 (PRC2) of metazoa,15 are H3K27me2 and H3K27me3,11 while TXR1 predominantly produces H3K27me1.11,16 JMJ1 and JMJ2 are both jumonji family lysine demethylases, closely related to the JMJD3 (specific for H3K27 demethylation) and JMJD2 (H3K9/H3K36 demethylation) subfamily proteins in metazoa, respectively.17 JMJ1 expression is highly induced in Tetrahymena early conjugating cells.18 JMJ2 is suspected to functionally overlap with JMJ1, due to the simultaneous accumulation of H3K27 and H3K9 methylation during conjugation.19 RIN1 is required for histone H2A monoubiquitylation (H2AK123ub1), playing a role equivalent to that of ring-finger proteins in Polycomb Repressive Complex 1 (PRC1) of metazoa.20 In metazoa, PRC1 and PRC2 often play redundant (and possibly synergistic) roles in transcriptional repression, and there is significant overlap in their genomic distribution.21
To simplify the experiment, the mutants were further divided into two groups (Supplementary Figure 1). In the group containing ΔTXR1, ΔEZL2, and ΔRIN1, we collected samples only from vegetatively growing and starved cells, as these mutants do not affect normal conjugation progression and can yield viable progeny (S.G. and Y.L., unpublished observations). In the group containing ΔJMJ1, ΔJMJ2, and ΔJMJ1/ΔJMJ2 (double KO), we collected samples only from vegetatively growing and conjugating cells, as it is during conjugation that these two genes are highly expressed and defects of the mutants are predominantly manifested.18
To quantify chromatin modifications, core histones were acid-extracted from Tetrahymena macronuclei, purified by reversed-phase HPLC, mixed with equal amounts of 15N-labeled counterparts as the internal control for quantification, and subjected to tandem mass spectrometry.11 Sequence coverage was effective (H2A: 61%, H2B: 68%, H3: 76%, and H4: 97%), especially in the PTM-rich N-terminal domains (100%), with a low false discovery rate (FDR < 1%). Histone variants were also observed along with the major histones, including H2A.1, H2A.X; H2B.1, H2B.2; and H3, H3.3, H3.4 (Supplementary Figure 2). Overall, we quantified the bulk levels of 53 histone modification states with relatively small experimental errors (9.8% average coefficients of variance) (Figure 2, Supplementary Table 2), which account for 40 individual PTMs and their unmodified counterparts, as well as local combinations in a single tryptic peptide. All of these modifications and their tandem spectra have been manually validated in our previous studies.13 Generally, the average ratios of these modification states in each condition are fairly close to zero after data normalization and log2 transformation (unchanged), while the outliers in the boxplot represent the significantly affected PTMs, as expected of perturbation studies (Supplementary Figure 3).
Figure 2.
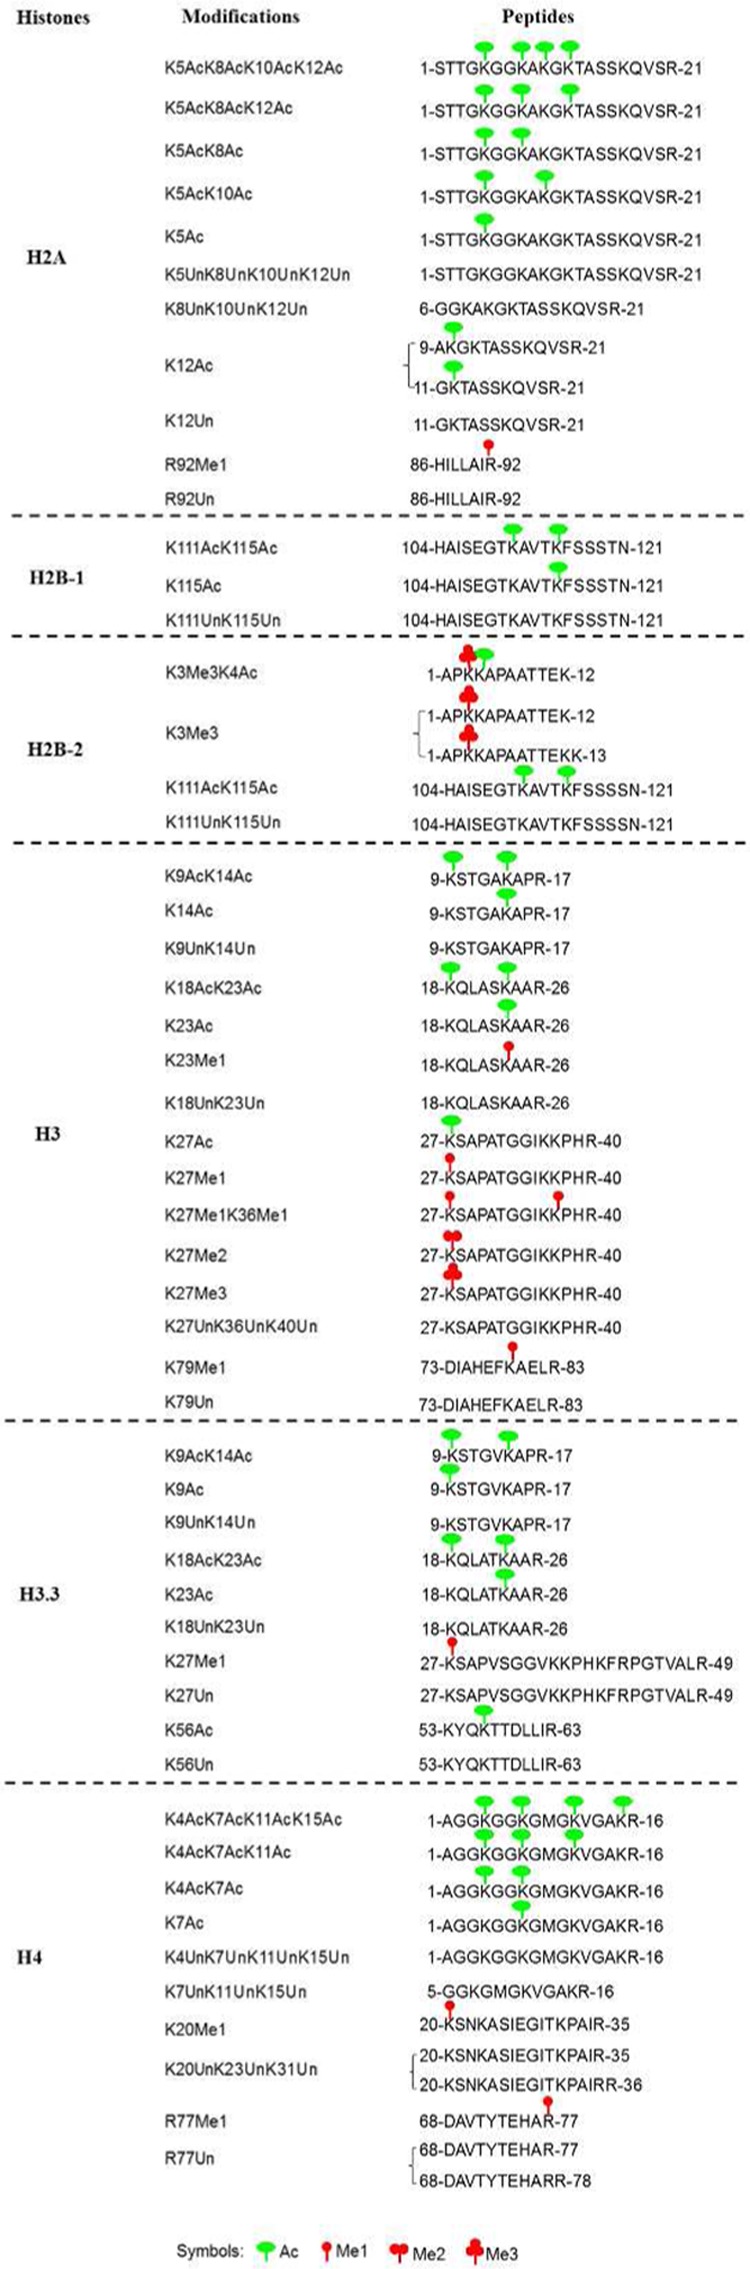
Identification and quantification of 53 histone modification states in all cell lines. We identified 40 individual histone marks and quantified 53 modification states in all phenotypes from individual core histones averaged over replicates, multiple charge states, different propionylation degrees, or multiple tryptic cleavage sites.
Main Factors Modulating Histone PTMs
In order to identify histone modification patterns associated with the systematic perturbations (permutations of different physiological conditions and mutants, 15 total), we performed FA based on the data summarized in Supplementary Table 2. To uncover the optimal number of common factors, we systematically manipulated the number of factors and analyzed the effects on the PCA scree plot (Figure 3a). Fitting our data with a 2-factor model (Supplementary Figure 4) captured only 44.6% of data variance (the variance shared with other variables via common factors). Many variables were found to have large errors or uniquenesses (i.e., the variance not shared with other variables). Further analysis showed that the 5-factor model captured about 84.5% of the cumulative variance (Figure 3b), while a further increase in the number of factors resulted in dramatically diminished return in terms of captured variance (Figure 3a). Close examination shows that the 5-factor model fits the data quite well and has fairly small uniqueness values, indicating that the 5-factor model is optimal for variable reduction under this set of conditions.
Figure 3.

Factor analysis of histone modifications reveals 5 hidden chromatin features. (a) A PCA screeplot of the data correlation matrix was used to determine how many factors are required for the FA model based on the following rules: (1) number of eigenvalues greater than one; (2) percent of variance explained by first several factors. (b) Details of 5-factor model from R software: FA model identified 5 chromatin features known as “growth”, “replication”, “transcription”, and two other factors with less clear biological significance. The first 5 factors account for up to 84.5% of variance and most factors have low uniqueness. The loadings with large numbers are identified with red numbers. Note: Factor loadings are very similar to regression coefficients in the Generalized Linear Model. They represent how well variables are correlated with each of the factors. The loadings with large numbers usually provide meaningful interpretations of factors.
We next analyzed factor loadings for the 5-factor model, which represent how well variables are correlated with each of the 5 factors. Those loadings with large values (high correlation) can often provide clues to the biological significance of individual factors (Figure 3b). Factor 1, for example, has large factor loadings for the mid-log phase growth conditions in genetic backgrounds other than ΔEZL2 and ΔTXR1. As a major component capturing variance, Factor 1 may represent cell growth as a condition defining patterns of histone PTMs. Factor 3 has large factor loadings for ΔEZL2, which likely reflects the roles played by EZL2 in regulating H3K27me2/H3K27me3 and transcriptional repression in Tetrahymena. Factor 4 has large factor loadings for ΔTXR1, which likely reflects the roles played by TXR1 in regulating H3K27me1 and DNA replication in Tetrahymena.11,16 The biological significance of the remaining factors 2 and 5 is less obvious. We speculate that Factor 5 with large loadings for ΔJMJ1 in conjugation may reflect conjugation-induced expression of JMJ1,18 even though we did not detect significant changes of H3K27 methylation levels (Supplementary Table 2). Factor 2 features large factor loadings for the starvation and conjugation conditions in genetic backgrounds other than ΔEZL2, ΔTXR1, and ΔJMJ1, implying starvation-defined patterns of histone PTMs.
Functional Clustering of Histone PTM Patterns
We next explored the extent of crosstalk among histone PTMs using clustering analysis of the 53 quantifiable modification states in 15 conditions (external and internal perturbations). A top-down clustering method (Partitioning Around Medoids (PAM) algorithm) and a bottom-up approach (Ward’s hierarchical clustering algorithm) were used to correlate PTMs that respond in similar ways to perturbations. These cohorts of histone PTMs are likely to be connected by crosstalk and functionally related. Both methods partitioned the data into 5 clusters with acceptable silhouette coefficients, a statistical method that measures cluster quality according to cluster homogeneity and separation (Supplementary Figure 5). Common PTMs and clusters identified by both methods are shown in Figure 4. Note that identification of the same number of clusters as factors (5, see section above) using these methods is most likely coincidental. Cluster 1 represents hyper-acetylation events in N-terminal tails of histones H2A, H3. and H4, which were predominantly up-regulated in the growth conditions and down-regulated in the starvation and conjugation conditions. Cluster 3 contains mostly unacetylated peptides (in H3K23me1, acetylation is further blocked by monomethylation), which are predominantly up-regulated in the starvation and conjugation conditions and down-regulated in the growth conditions. The presence of these two clusters is consistent with reduction in global acetylation levels and transcription levels upon starvation,22 as well as the direct connection between histone acetylation and gene activation.23 Cluster 4 represents monomethylation events on K27 and K36 of histone H3, which are dramatically reduced in ΔTXR1. Cluster 5 represents di- and trimethylation events on K27 of histone H3, which are dramatically reduced in ΔEZL2. The presence of these two clusters validates the division of labor between TXR1 and EZL2. Cluster 2 contains certain histone PTMs or unmodified counterparts that were mostly unaffected by our perturbations. They include acetylated and unacetylated H2A N-terminal domain, as well as the less conserved H2B C-terminal acetylation events. We speculate that their insensitivity to perturbations may be attributed to having other roles not queried in this study, their small impact on chromatin structure and functions, or their high occurrence in bulk histones.
Figure 4.

Five functionally related histone PTM subgroups. Common PTMs and clusters identified by both PAM and Ward’s hierarchical clustering algorithm. Cluster 1: N-terminal acetylation of H2A, H3 and H4. Cluster 2: Some unchanged levels of PTMs and unmodified forms. Cluster 3: PTMs in this group are H3:K23Me1 and unacetylated forms in H3.3. Cluster 4: Monomethylation of H3K27 and K36. Cluster 5: Di/trimethylation of K27. Note: For clustering analysis, dissimilarity matrix is used as input in PAM, and Euclidean distance is measured in hierarchical clustering.
The histone code hypothesis posits that chromatin structure and functions are determined by various patterns of histone modifications.2,3 These crosstalking PTM subgroups identified in our study are consistent with the combinatorial nature properties implied by the histone code hypothesis. The results also brought some specific insights on histone modifications: (1) The great contrast between cluster 1 and 2 suggests that acetylation, particularly at high degrees (triple- or tetra-acetylated forms) in the N-terminal domains, plays more important roles in chromatin functions than the single acetylated N-terminal tails or multiple acetylations at the histone C-terminal tails. (2) Changes in degrees of lysine methylation (mono, di, and tri), exemplified by Clusters 4 and 5 (as well as Factors 3 and 4 in FA), can have significantly different biological outcomes. In this context, two conserved pathways have been identified in multiple evolutionarily distant species.11,13,15 The first is the E(Z)/EZH2-mediated pathway associated with transcription by controlling the di- and trimethylation levels of H3K27.15,19 The second ATXR5/ATXR6-related pathway regulates DNA replication by controlling the monomethylation levels of H3K27.11,16,24,25
Discussion
Chromatin has been traditionally demarcated into two structurally and functionally antagonistic states, euchromatin and heterochromatin.26 This simple concept is being challenged by rapid progress in the field of epigenetics and chromatin biology. Based upon analyses of genomic distribution data of histone PTMs and chromatin-associated proteins, multiple chromatin states, in numbers ranging from a few to a few dozen, have very recently been revealed in diverse eukaryotes including C. elegans, Drosophila, mammals, and Arabidopsis.27−31 All of these studies point to a more fine-grained classification of principal chromatin states, while the exact number may vary depending on species, observables, data properties, statistical methods, and criteria for resolving states.
Using completely different methodologies and strategies from these recent studies, we performed mass spectrometry based quantitative proteomics analysis of 40 histone modifications individually or combinatorially across 15 cell states to generate a high-quality data set reflecting the perturbed histone modification patterns. This work represents the most comprehensive exploration of histone PTMs in Tetrahymena, a well-established model organism for studying epigenetics and chromatin biology.14 We assume that knockout of key histone modifying enzymes and changes in growth conditions will be reflected in perturbations to histone PTM patterns and chromatin structures, which are underlain by a limited number of chromatin classes and certain key hidden features. Through this proof of concept study, we demonstrate that high-thoughput quantitative MS analysis of steady-state bulk histones in different cell states, integrated with systems biology analysis, can identify correlated changes in histone PTM patterns and associate them with discrete biological functions. In our current experimental setup, our FA model reveals that 5 major factors have dominant effects on histone PTMs, attributable to both internal and external perturbations, while our clustering analyses demonstrate dynamic correlation among histone PTMs in different cell states, which are organized into 5 major clusters. Importantly, knowledge and insight can be readily extracted from these 5 clusters of histone PTMs, to guide further biological experiments. Positive correlation between hyper-acetylation and the growth condition (Factor 1 and Cluster 1) validates this general feature of transcriptionally active chromatin. Inversely, hypo-acetylation is connected with the starved condition (Factor 2 and Cluster 3), though to a lesser degree. Division of labor between TXR1 and EZL2 is demonstrated by their assignment to different factors (4 and 3, respectively) and clusters (4 and 5, respectively), which is consistent with their distinct products (H3K27me1 and H3K27me2/3, respectively) and specialized roles (replication and transcription, respectively).11,16 Our study also suggests that RIN1, as well as the H2A monoubiquitylation catalyzed by it, is most likely functionally independent from H3K27 methylation, due to the minor effect, if any, of its deletion on other histone PTMs. This is further supported by our observation that H3K27 methylation levels were not affected in ΔRIN1, while H2AK123ub1 levels were not affected in ΔTXR1 and ΔEZL2 (S.G., Z.W., M.A.G., Y.L., unpublished results). Our data also provide evidence for a significant impact of JMJ1 during conjugation (Factor 5), as well as a relatively minor impact for JMJ2. This is further supported by the moderate heterochromatin spreading phenotype observed in conjugating progeny of ΔJMJ1, but not ΔJMJ2 cells (S.G. and Y.L., unpublished results). Overall, our data are consistent with a dynamic, combinatorial code linking histone PTMs to biological functions.
It is obvious that localized changes of histone PTMs may not be reflected at global levels, an issue that can be particularly prominent for highly abundant histone PTMs. Some perturbations may cause changes in distribution patterns of certain histone PTMs, without affecting their global levels. These limitations and caveats should be kept in perspective when employing this approach. In many ways, our approach is complementary to the genome-wide distribution studies (such as ChIP-seq), which can specifically resolve genomic dsitribution patterns of any given histone PTMs and chromatin associated proteins, with appropriate antibodies or tags. For both approaches, additional information about the mutant phenotype, gene ontology, and genetic/proteomic networks are needed to fully interpret biological functions.
Our study demonstrates the feasibility of this novel approach and provides important leads for further experiments. It is worth noting that the number of chromatin states or epigenetic features resolved by our analyses will be significantly increased, as the MS coverage of histone PTMs are further expanded and, more importantly, additional internal and external perturbations are included. The quantitative MS-based PTM perturbation study has the advantage of being unbiased, comprehensive, scalable, and readily adaptable to other model systems. It meets a mounting demand for dissecting crosstalk between protein PTMs and understanding their biological functions, as protein PTM data increase exponentially with improvement in MS instrumentation and bioinformatics algorithms.
Acknowledgments
This work was supported by NIH Grants 1P41RR018627 (P.C.A.) and R01GM087343 (Y.L.). We thank Maureen Sartor for her critical readings and suggestions.
Glossary
Abbreviations
- PTM
posttranslational modification
- MS
mass spectrometry
- HMT
histone methyltransferase
- HDM
histone demethylase
- SET
Suppressor of variegation, Enhancer of Zeste, and Trithorax domain
- H3K27me1/2/3
histone H3 lysine 27 mono-, di-, trimethylation
- H2AK123ub1
histone H2A lysine 123 monoubiquitylation
Supporting Information Available
Supplementary Figure 1: Experimental design. Supplementary Figure 2: Histone variants and sequence coverage. Supplementary Figure 3: Boxplot analysis of histone PTM data in 15 strains. Supplementary Figure 4: Output of 2-factor model from R. Supplementary Figure 5: Two clustering algorithms were used to search functionally related histone modifications. Supplementary Table 1: Tetrahymena genes and their potential biological functions. Supplementary Table 2: List of 53 histone modification states and their ratios in 15 phenotypes. This material is available free of charge via the Internet at http://pubs.acs.org.
The authors declare no competing financial interest.
Funding Statement
National Institutes of Health, United States
Supplementary Material
References
- Allis C. D.; Jenuwein T.; Reinberg D.. Epigenetics; Cold Spring Harbor Laboratory Press: Cold Spring Harbor, NY, 2007. [Google Scholar]
- Jenuwein T.; Allis C. D. Translating the histone code. Science 2001, 29355321074–80. [DOI] [PubMed] [Google Scholar]
- Strahl B. D.; Allis C. D. The language of covalent histone modifications. Nature 2000, 403676541–5. [DOI] [PubMed] [Google Scholar]
- Taverna S. D.; Li H.; Ruthenburg A. J.; Allis C. D.; Patel D. J. How chromatin-binding modules interpret histone modifications: lessons from professional pocket pickers. Nat. Struct. Mol. Biol. 2007, 14111025–40. [DOI] [PMC free article] [PubMed] [Google Scholar]
- Greer E. L.; Shi Y. Histone methylation: a dynamic mark in health, disease and inheritance. Nat. Rev. Genet 2012, 135343–57. [DOI] [PMC free article] [PubMed] [Google Scholar]
- Hunter T. The age of crosstalk: phosphorylation, ubiquitination, and beyond. Mol. Cell 2007, 285730–8. [DOI] [PubMed] [Google Scholar]
- Latham J. A.; Dent S. Y. Cross-regulation of histone modifications. Nat. Struct. Mol. Biol. 2007, 14111017–24. [DOI] [PubMed] [Google Scholar]
- Fischle W.; Wang Y.; Allis C. D. Histone and chromatin cross-talk. Curr. Opin. Cell Biol. 2003, 152172–83. [DOI] [PubMed] [Google Scholar]
- Suganuma T.; Workman J. L. Crosstalk among Histone Modifications. Cell 2008, 1354604–7. [DOI] [PubMed] [Google Scholar]
- Zippo A.; Serafini R.; Rocchigiani M.; Pennacchini S.; Krepelova A.; Oliviero S. Histone crosstalk between H3S10ph and H4K16ac generates a histone code that mediates transcription elongation. Cell 2009, 13861122–36. [DOI] [PubMed] [Google Scholar]
- Zhang C.; Molascon A. J.; Gao S.; Liu Y.; Andrews P. C. Quantitative proteomics reveals that the specific methyltransferases Txr1p and Ezl2p differentially affect the mono-, di- and trimethylation states of histone H3 lysine 27 (H3K27). Mol. Cell Proteomics 2013, 1261678–88. [DOI] [PMC free article] [PubMed] [Google Scholar]
- Garcia B. A.; Mollah S.; Ueberheide B. M.; Busby S. A.; Muratore T. L.; Shabanowitz J.; Hunt D. F. Chemical derivatization of histones for facilitated analysis by mass spectrometry. Nat. Protoc. 2007, 24933–8. [DOI] [PMC free article] [PubMed] [Google Scholar]
- Zhang C.; Gao S.; Molascon A. J.; Liu Y.; Andrews P. C. Quantitative proteomics reveals histone modifications in crosstalk with H3 lysine 27 methylation. Mol. Cell Proteomics 2014, 133749–59. [DOI] [PMC free article] [PubMed] [Google Scholar]
- Chalker D. L.; Meyer E.; Mochizuki K. Epigenetics of ciliates. Cold Spring Harbor Perspect, Biol. 2013, 512a017764. [DOI] [PMC free article] [PubMed] [Google Scholar]
- Cao R.; Zhang Y. The functions of E(Z)/EZH2-mediated methylation of lysine 27 in histone H3. Curr. Opin. Genet. Dev. 2004, 142155–64. [DOI] [PubMed] [Google Scholar]
- Gao S.; Xiong J.; Zhang C.; Berquist B. R.; Yang R.; Zhao M.; Molascon A. J.; Kwiatkowski S. Y.; Yuan D.; Qin Z.; Wen J.; Kapler G. M.; Andrews P. C.; Miao W.; Liu Y. Impaired replication elongation in Tetrahymena mutants deficient in histone H3 Lys 27 monomethylation. Genes Dev. 2013, 27151662–79. [DOI] [PMC free article] [PubMed] [Google Scholar]
- Mosammaparast N.; Shi Y. Reversal of histone methylation: biochemical and molecular mechanisms of histone demethylases. Annu. Rev. Biochem. 2010, 79, 155–79. [DOI] [PubMed] [Google Scholar]
- Chung P. H.; Yao M. C. Tetrahymena thermophila JMJD3 homolog regulates H3K27 methylation and nuclear differentiation. Eukaryotic Cell 2012, 115601–14. [DOI] [PMC free article] [PubMed] [Google Scholar]
- Liu Y.; Taverna S. D.; Muratore T. L.; Shabanowitz J.; Hunt D. F.; Allis C. D. RNAi-dependent H3K27 methylation is required for heterochromatin formation and DNA elimination in Tetrahymena. Genes Dev. 2007, 21121530–45. [DOI] [PMC free article] [PubMed] [Google Scholar]
- Di Croce L.; Helin K. Transcriptional regulation by Polycomb group proteins. Nat. Struct. Mol. Biol. 2013, 20101147–55. [DOI] [PubMed] [Google Scholar]
- Morey L.; Helin K. Polycomb group protein-mediated repression of transcription. Trends Biochem. Sci. 2010, 356323–32. [DOI] [PubMed] [Google Scholar]
- Parker K.; Maxson J.; Mooney A.; Wiley E. A. Class I histone deacetylase Thd1p promotes global chromatin condensation in Tetrahymena thermophila. Eukaryotic Cell 2007, 6101913–24. [DOI] [PMC free article] [PubMed] [Google Scholar]
- Brownell J. E.; Zhou J.; Ranalli T.; Kobayashi R.; Edmondson D. G.; Roth S. Y.; Allis C. D. Tetrahymena histone acetyltransferase A: a homolog to yeast Gcn5p linking histone acetylation to gene activation. Cell 1996, 846843–51. [DOI] [PubMed] [Google Scholar]
- Jacob Y.; Stroud H.; Leblanc C.; Feng S.; Zhuo L.; Caro E.; Hassel C.; Gutierrez C.; Michaels S. D.; Jacobsen S. E. Regulation of heterochromatic DNA replication by histone H3 lysine 27 methyltransferases. Nature 2010, 4667309987–91. [DOI] [PMC free article] [PubMed] [Google Scholar]
- Jacob Y.; Feng S.; LeBlanc C. A.; Bernatavichute Y. V.; Stroud H.; Cokus S.; Johnson L. M.; Pellegrini M.; Jacobsen S. E.; Michaels S. D. ATXR5 and ATXR6 are H3K27 monomethyltransferases required for chromatin structure and gene silencing. Nat. Struct. Mol. Biol. 2009, 167763–8. [DOI] [PMC free article] [PubMed] [Google Scholar]
- van Steensel B. Chromatin: constructing the big picture. EMBO J. 2011, 30101885–95. [DOI] [PMC free article] [PubMed] [Google Scholar]
- Kharchenko P. V.; Alekseyenko A. A.; Schwartz Y. B.; Minoda A.; Riddle N. C.; Ernst J.; Sabo P. J.; Larschan E.; Gorchakov A. A.; Gu T.; Linder-Basso D.; Plachetka A.; Shanower G.; Tolstorukov M. Y.; Luquette L. J.; Xi R.; Jung Y. L.; Park R. W.; Bishop E. P.; Canfield T. K.; Sandstrom R.; Thurman R. E.; MacAlpine D. M.; Stamatoyannopoulos J. A.; Kellis M.; Elgin S. C.; Kuroda M. I.; Pirrotta V.; Karpen G. H.; Park P. J. Comprehensive analysis of the chromatin landscape in Drosophila melanogaster. Nature 2011, 4717339480–5. [DOI] [PMC free article] [PubMed] [Google Scholar]
- Filion G. J.; van Bemmel J. G.; Braunschweig U.; Talhout W.; Kind J.; Ward L. D.; Brugman W.; de Castro I. J.; Kerkhoven R. M.; Bussemaker H. J.; van Steensel B. Systematic protein location mapping reveals five principal chromatin types in Drosophila cells. Cell 2010, 1432212–24. [DOI] [PMC free article] [PubMed] [Google Scholar]
- Ernst J.; Kellis M. Discovery and characterization of chromatin states for systematic annotation of the human genome. Nat. Biotechnol. 2010, 288817–25. [DOI] [PMC free article] [PubMed] [Google Scholar]
- Roudier F.; Ahmed I.; Berard C.; Sarazin A.; Mary-Huard T.; Cortijo S.; Bouyer D.; Caillieux E.; Duvernois-Berthet E.; Al-Shikhley L.; Giraut L.; Despres B.; Drevensek S.; Barneche F.; Derozier S.; Brunaud V.; Aubourg S.; Schnittger A.; Bowler C.; Martin-Magniette M. L.; Robin S.; Caboche M.; Colot V. Integrative epigenomic mapping defines four main chromatin states in Arabidopsis. EMBO J. 2011, 30101928–38. [DOI] [PMC free article] [PubMed] [Google Scholar]
- Gerstein M. B.; Lu Z. J.; Van Nostrand E. L.; Cheng C.; Arshinoff B. I.; Liu T.; Yip K. Y.; Robilotto R.; Rechtsteiner A.; Ikegami K.; Alves P.; Chateigner A.; Perry M.; Morris M.; Auerbach R. K.; Feng X.; Leng J.; Vielle A.; Niu W.; Rhrissorrakrai K.; Agarwal A.; Alexander R. P.; Barber G.; Brdlik C. M.; Brennan J.; Brouillet J. J.; Carr A.; Cheung M. S.; Clawson H.; Contrino S.; Dannenberg L. O.; Dernburg A. F.; Desai A.; Dick L.; Dose A. C.; Du J.; Egelhofer T.; Ercan S.; Euskirchen G.; Ewing B.; Feingold E. A.; Gassmann R.; Good P. J.; Green P.; Gullier F.; Gutwein M.; Guyer M. S.; Habegger L.; Han T.; Henikoff J. G.; Henz S. R.; Hinrichs A.; Holster H.; Hyman T.; Iniguez A. L.; Janette J.; Jensen M.; Kato M.; Kent W. J.; Kephart E.; Khivansara V.; Khurana E.; Kim J. K.; Kolasinska-Zwierz P.; Lai E. C.; Latorre I.; Leahey A.; Lewis S.; Lloyd P.; Lochovsky L.; Lowdon R. F.; Lubling Y.; Lyne R.; MacCoss M.; Mackowiak S. D.; Mangone M.; McKay S.; Mecenas D.; Merrihew G.; Miller D. M. 3rd; Muroyama A.; Murray J. I.; Ooi S. L.; Pham H.; Phippen T.; Preston E. A.; Rajewsky N.; Ratsch G.; Rosenbaum H.; Rozowsky J.; Rutherford K.; Ruzanov P.; Sarov M.; Sasidharan R.; Sboner A.; Scheid P.; Segal E.; Shin H.; Shou C.; Slack F. J.; Slightam C.; Smith R.; Spencer W. C.; Stinson E. O.; Taing S.; Takasaki T.; Vafeados D.; Voronina K.; Wang G.; Washington N. L.; Whittle C. M.; Wu B.; Yan K. K.; Zeller G.; Zha Z.; Zhong M.; Zhou X.; Ahringer J.; Strome S.; Gunsalus K. C.; Micklem G.; Liu X. S.; Reinke V.; Kim S. K.; Hillier L. W.; Henikoff S.; Piano F.; Snyder M.; Stein L.; Lieb J. D.; Waterston R. H. Integrative analysis of the Caenorhabditis elegans genome by the modENCODE project. Science 2010, 33060121775–87. [DOI] [PMC free article] [PubMed] [Google Scholar]
Associated Data
This section collects any data citations, data availability statements, or supplementary materials included in this article.