Abstract
The bacterial pathogen Klebsiella pneumoniae is a cause of community- and hospital-acquired lung, urinary tract, and blood stream infections. A common contaminant of indwelling catheters, it is theorized that a common infection pathway for this organism is via shedding of aggregates off of biofilm colonies.
In an effort to better understand bacterial proliferation in the host bloodstream, we develop a PDE model for the flocculation dynamics of Klebsiella pneumoniae in suspension. Existence and uniqueness results are provided, as well as a brief description of the numerical approximation scheme. We generate artificial data and illustrate the requirements to accurately identify proliferation, aggregation, and fragmentation of flocs in the experimental domain of interest.
Keywords: Klebsiella pneumoniae, Aggregation, Flocculation, Parameter Identification
1 Introduction
Klebsiella pneumoniae is a member of the family Enterobacteriaceae and an important human bacterial pathogen. As causes of both pneumonia and urinary tract infections, Klebsiella are among the most common Gram-negative organisms isolated from the blood stream of critically ill patients [15]. Important virulence factors for this organism include two surface exopolysaccharides, the O-antigen and the capsule, which lie on the exterior face of the pathogen and may impart pathogenicity by interfering with host defense strategies involving the complement system, phagocytosis, and antibacterial peptides. These carbohydrates, particularly the capsule, are also believed to contribute to the formation of extended extracellular structures known as biofilms. Biofilms serve as structural anchors, barriers to contact with host defenses, and as impediments to antibiotics [4]. As with many other bacteria, biofilm production by Klebsiella is not a passive process, rather one genetically regulated, in part, through active sampling of the external environment by a process known as quorum sensing [5].
Flocculation, whereby planktonic organisms coalesce in suspension into multicellular aggregates, may be a process homologous to biofilm formation on a substrate. Preliminary experimental evidence in our laboratory suggests that Klebsiella may flocculate under conditions closely mimicking flowing blood. As all flowing blood must pass through capillaries of a fixed diameter (~ 10 μm), the final distribution of bacteria in tissues may be governed by multicellular aggregates becoming lodged in capillaries (a process called septic embolization). These bacterial aggregates, whether free-floating or entrapped in a capillary network, exhibit growth kinetics different than organisms growing in isolation as well as those in biofilms. An improved understanding of the discrepancies is an important step in studying the behavior of the pathogen when it resides in the blood stream of a host. That bacteria might exist and proliferate in aggregate while circulating in the bloodstream has implication for their ultimate clearance from the blood stream and their susceptibility to humoral and cellular defenses and to antibiotics.
The focus of this paper, therefore, is in studying the bacterial aggregation phenomenon, and is organized as follows. Section 2 describes the PDE model development. Section 3 addresses the mathematical issues of existence and uniqueness. Section 4 describes the numerical scheme used to approximate the solution. Section 5 discusses the modeling of the aggregation and fragmentation kernels. Section 6 tabulates the results of the numerical experiments. Section 7 summarizes and discusses the conclusions from the work.
2 Model Development
There is a rich and well developed literature on biofilm formation and bacterial growth on a substrate, even for K. pneumoniae [4, 27, 28]. We are interested, however, in studying bacterial aggregates in suspension, as an important infection pathway involves seeding a patient’s vasculature with flocs off of biofilms.
Aggregation phenomena occur in a wide range of fields and the basic mathematical model for such phenomena, the Smoluchowski coagulation equations 1, has been employed in such disparate fields as aerosols [7], meteorology [17], chemically dispersive systems [24], algal dynamics [2, 18], immunology [13], and planetesimal evolution [11]. The seminal ideas were originally developed in the early 1900’s by von Smoluchowski to model the rapid aggregation of colloids. Smoluchowski considered a static dispersing medium, assuming that all interactions (particle-particle, particle-aggregate, and aggregate-aggregate) were binary and driven by Brownian motion. This research [25, 26] resulted in a governing equation for discrete kinetic aggregation
| (1) |
where pk represents the density of aggregates of volume k and K(i, j) is a kernel describing the collision rate of aggregates of volume i and j. Under further approximations (such as assuming that the van der Waals forces have an effective radius equal to the radius of the aggregate), Smoluchowski was able to solve the infinite system of discrete equations (1). Later work by Müller [12] (and others) extended this equation to the continuum PDE
| (2) |
where p is now a continuous aggregate size density function and K(x1, x2) is a kernel describing the rate with which particles of size x1 coalesce with particles of size x2.
As discussed in Section 5, the equations themselves have been the focus of intense mathematical study. While closed form solutions exist for simple (constant, additive, and multiplicative) kernels, solutions for more complicated forms have proven elusive. For multiplicative kernels, moreover, the second moment of p is known to blow up in finite time. That is, for K(x, y) = xy, there is a finite time, called a gelation time, at which there are a positive number of aggregates with infinite volume. The conventional interpretation is that a phase change has occurred in the media. For a review of further mathematical results, we direct the interested reader to [8].
Lastly, we note that there are probabilistic models of aggregation (coalescent) phenomena as well. The coalescence process can also be modeled using a Marcus-Lushnikov (ML) stochastic process; and in finite volumes, the limiting distribution of the ML process is the solution to (2). A good review of stochastic models of aggregation and their relation to deterministic models can be found in [3].
2.1 Experimental Methods
We present the experimental methods here, since the details strongly inform our modeling approach.
An encapsulated strain of Klebsiella pneumoniae (serotype O1:K2, American Type Culture Collection number 43816) was plated on Luria Bertani agar and grown at 37°C overnight. The following morning, individual colonies, with the underlying agar plug, were sharply excised and placed, one colony per flask, in 200ml Erlenmeyer flasks containing 15 ml of minimal media with 1% glucose (Difco, Detroit, Michigan). Agar plugs with no bacterial colony were added to control flasks. Flasks were placed in an orbital shaker at 37°C rotating at 100 rpm. Samples were taken at various time points, and experimental conditions (including control conditions) were always studied in triplicate.
Suspended particles were assayed using a Z1 cell and particle counter (Beckman Coulter, Fullerton, California). Each sample was assayed for particles contained in 5 windows (5–50 fL, 50–100 fL, 100–200 fL, 200–300 fL, and 300–400 fL).
2.2 Model Equations
The microscopy images in Figure 1 depict K. pneumoniae in fetal calf serum and we interpret the bacteria and the extracellular structure surrounding it as a floc. The electrical sensing zone method particle sizer in our lab can measure the total volume of biomass in a floc. Accordingly, our equations characterize the continuous distribution of biomass volume and not a discrete distribution of the number of bacteria in an individual floc. Since bacteria add to the extracellular carbohydrate structures in a continuous manner, a discrete approach, while attractive because of the simpler analysis and numerical schemes, is thus not appropriate here.
Figure 1.
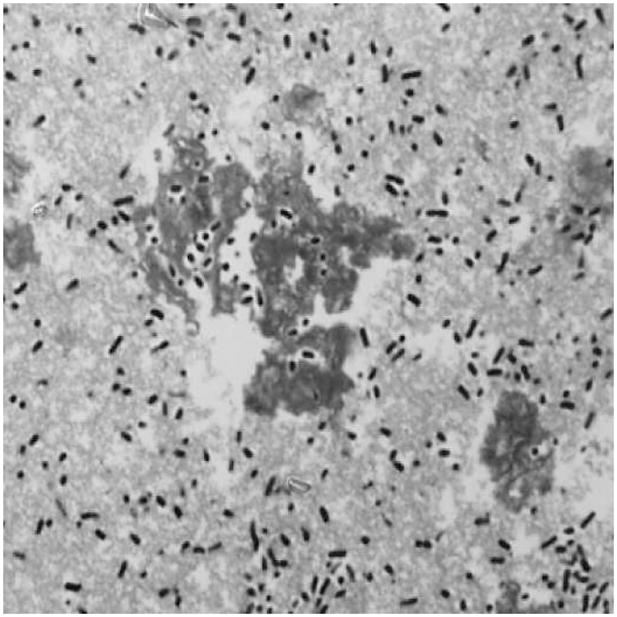
Light micrographs of aggregating Klebsiella pneumoniae in fetal calf serum. Small dark rods are bacteria and stained aggregates are flocs.
We define
In volumes between x1 and x2, the total number of flocs B0 (zeroth moment of b) is
and the total flocculated bacterial biomass B1 (first moment of b) is
for [x1, x2] ⊂ [x, x̄], where x and x̄ are the minimum and maximum aggregate volume sizes, respectively. While in principle, there is no upper limit for floc volume, in practice, the finite nutrient supply and the duration of the experiment allow us to assume that x̄ is finite. We also assume that the extracellular structures must be actively maintained and thus the minimal size x is the volume of one bacteria.
To obtain a governing equation for b, we will employ a conservation of mass derivation. 2 As depicted in Figure 2, we consider three phenomena by which a floc could enter or exit a window of volumes x to x + Δx, bacterial growth, aggregation, and fragmentation. The mathematical model is thus
Figure 2.
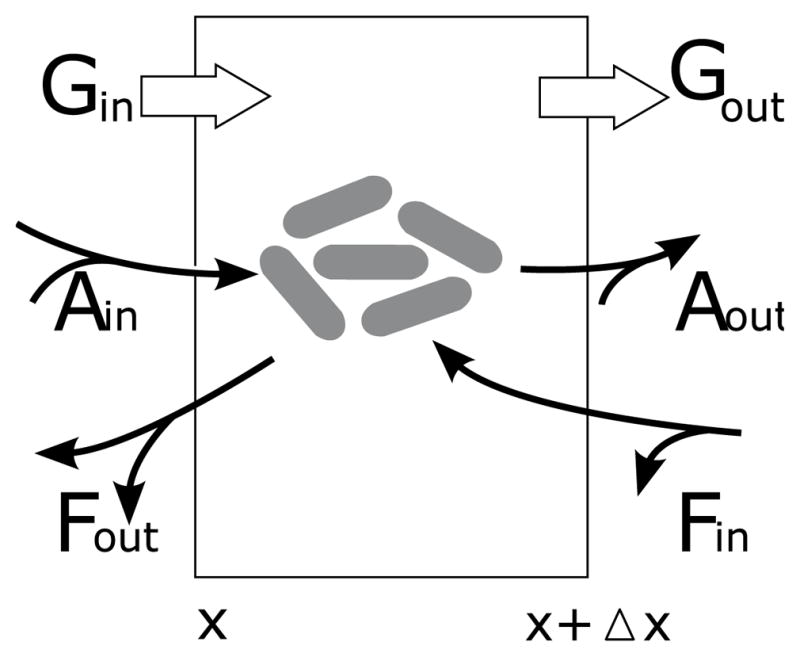
Processes affecting bacterial clusters with volumes between x and x + Δx.
| (3) |
| (4) |
| (5) |
| (6) |
where the subscripts describe the effect upon the floc. Since there is a finite nutrient supply, our initial efforts use a logistic growth term, with growth rate γG and carrying capacity κG, similar to the limiting growth function for an avascular tumor
The function Ain is the rate with which flocs of size in [x, x + Δx] are created
while Aout is the rate a floc of size in [x, x + Δx] joins with another floc, to form a volume greater than x + Δx
The function KA is the aggregation kernel, describing the rate with which flocs of volume x and y combine to form a floc of volume x + y.
The function Fin is the rate with which fragmentation of a floc results in at least one daughter floc being of size in [x, x + Δx]
while Fout is the rate a floc of size [x, x + Δx] fragments
| (7) |
Analogously, we define KF (x) to be the fragmentation kernel, which calculates the rate with which a floc fragments. We also define Γ(x; y) as the function describing the distribution of daughter flocs for the fragmentation of a parent floc of size y. Note that, given a parent floc of size y, Γ is just a probability density function of x (hence it can be integrated out of (7)).
If we divide (4)–(6) by Δx and denote A = Ain − Aout and F = Fin − Fout, then in the limit as Δx → 0, we have the following nonlinear transport equation
| (8) |
as our “mean-field” model to describe flocculating biomass dynamics.
We assume that after placing the bacterial colony into the flask, it fragments into aggregates of volumes between x and x̄ and that growth or fragmentation beyond either limit is not possible. With these boundary conditions, our full model is
where b0 ∈  ([x, x̄], ℝ+) is the density function 5 minutes after the biofilm colony is placed in the swirling flask. We wait 5 minutes to allow the original colony to break apart, so that our initial condition doe not consist of a single massive floc. The boundary condition G(x)b(t, x) = 0 enforces the restriction that there is no biomass in the flask smaller than x that can grow bigger. In Section 5, we will focus our attention on choosing a reasonable form for KA and KF, while in Section 6 we will describe our strategy for estimating b0 from observable data.
3 Analysis
Our overall goal is to study the Klebsiella pneumoniae flocculation dynamics in suspension and we have proposed a general model (8) to mathematically characterize the behavior. To continue, however, it is crucial to verify that we have created a viable model and thus we now investigate the basic well-posedness properties of our equation.
We define the solution space H = L2([x, x̄], ℝ+), the space of square integrable functions mapping a closed, bounded subset of the positive reals, i.e., [x, x̄] ⊂ ℝ+, into ℝ+, where x and x̄ are the upper and lower limits of floc volume, respectively. We consider the abstract evolution equation formulation for equation (8)
and b(t, ·) ∈ H for t ≥ 0. The operator  : dom
: dom ⊂ H → H is defined as
with dom = {φ ∈ H: Gφ ∈ H1(x, x̄), limx→x̄(Gφ)(x) = 0}. The operators
  and
and  are similarly defined as mappings H ↦ H, wherein
  (b) = A(·, b) and
  (b) = F(·, b), respectively. We make the following assumptions
The biological interpretation of the last restriction on KF is that individual bacteria will not fragment.
Theorem 1
There exists a unique classical (strong) solution to equation (8).
PROOF
We know from [6] that  , as defined above, is an infinitesimal generator for a C0-semigroup T(t) where ||T(t)|| ≤ exp(ωt), ω > 0. The continuous differentiability of
  with respect to b is proven in [2]. The continuous differentiability of
  is straightforward, since
  is linear in b. The right side of (8) is, thus, locally Lipschitz in b and therefore by Theorems 1.2 and 1.6 in Chapter 6 of [14], there exists a unique classical (strong) solution to equation (8).
4 Numerical Implementation
We chose to employ an already existing Galerkin scheme to simulate a solution to our system (8). Since the proof for the convergence of this scheme are presented in Section 4 of [2], we briefly describe the approach here, highlighting the notable differences. Following the development in [2], we assume that G is continuously differentiable on [x, x̄] and define our basis elements as
for positive integer N and a partition of [x, x̄] with largest mesh size Δx and Δxj = xj − xj−1. The functions form an orthogonal basis for
and accordingly, we define the projections πN: H → HN
which is an orthogonal projection of H onto HN. By defining the approximating generators  : HN → HN of the infinitesimal generator by
for h ∈ HN, our approximating formulation of (8) is thus the following system of N ODE’s
Regarding the actual implementation, the application of  to our basis elements yields
and the matrix representation with respect to our basis is banded, with nonzero elements on two diagonals
The details of the application of πN to the other terms on the right side are slightly more complicated near x and x̄ and thus we let Δx1 = ΔxN = x (finer resolution did not noticeably improve our results). The application of πN to  (bN) is therefore
and to  (bN) is
5 Kernel Modeling
As mentioned before, the analysis of constant, linear, and multiplicative aggregation and fragmentation kernels is well understood, and closed form solutions are available. There is a global existence result for kernels (aggregation and fragmentation) with compact support as well as one for kernels satisfying
for constant k. Unfortunately, the mathematical analysis of (2) with more physically realistic kernels has proven challenging. The majority of the notable mathematical results, including a maximum principle, are summarized in [8]. In this section, we describe some common kernel forms and discuss our modeling choices.
5.1 Aggregation
The question of kernel shape in aggregation processes has been a topic of considerable research over the past hundred years. In the early 1900’s, Smoluchowski [25] proposed
to describe perikinetic aggregation of spherical particles undergoing Brownian diffusion, where κ is Boltzmann’s constant, T is the absolute temperature, and μ is the dynamic fluid viscosity. Several other kernels have been proposed to describe a wide variety of phenomena, including flow within a laminar shear field (orthokinetic aggregation) [26]
| (9) |
with shear rate γ. For particles smaller than the Kolmogorov microscale, the rate of aggregation has been modeled as
| (10) |
with rate of energy dissipation per unit mass ε and kinematic viscosity ν [19]. Under a gravitational force, particles of differing masses in a pressure field will fall with different rates. Collision kernels modeling this differential settling have also been proposed in aerosol aggregation for particles with radii less than 50 microns
| (11) |
with the contact efficiency Eg(x, y) and the constant C dependent upon the ambient density, viscosity, and gravitational acceleration. We refer the interested reader to Chapter 4 of Drake’s review [7] for kernels used in a wide variety of applications.
As described in Section 2.1, the experimental setup in our laboratory consists of a small volume of bacteria and media in an Erlenmeyer flask, agitated on a orbital shaker at up to to 200 rpms, suggesting that (10) is most appropriate. There are, however, some issues to be resolved.
Recent work in evaluating petroleum dispersant efficacy compared the turbulent energy dissipation in a swirling flask to that of a baffled one [10]. While the experimental setup is not identical, 3 the reported mean dissipation rate of 4.43 × 10⁻⁴m2s−3 (lower and upper bounds of 6.5 × 10⁻⁶m2s−3 and 2.0 × 10⁻³m2s−3, respectively) still provides a better estimate of ε than a first order approximation of Δu3/ℓ, for shear rate Δu and characteristic length scale ℓ.
It is known that in aggregation phenomena, flocs develop as irregular, fractal objects [23] and thus the efficiency with which two colliding flocs join is also challenging to model. For our purposes, therefore, we will be employing the turbulent mixing kernel
| (12) |
with ε = 4.43 × 10⁻⁴ m2s−3 and ν = 2 × 10⁻⁷ m2s−1 estimated from our experimental setup and contact efficiency γA to be fit by comparison with data. To aid in identifying γA, future experiments are planned to test the tensile strength of the flocs, similar to those done using a cantilevered glass micropipette in [16].
5.2 Fragmentation
Due to the complex stochastic nature of shear force-induced fragmentation, understanding the mathematics of floc breakup has proven even more challenging than that of aggregation [23]. We assume that shear forces are the primary mechanism driving floc fragmentation and accordingly assume that the breakage rate of a floc of volume x is proportional to its diameter (accounting for the fact that a single bacteria does not fragment)
The larger flocs thus break apart with a higher rate than smaller flocs. The post-fragmentation particle distribution has also been studied in a wide variety of regimes (see [9] for a summary). In Figure 1, the bacteria in a floc appear to be on the interior, and thus it seems unlikely that the floc will erode with a single bacteria shedding off of a floc. In the absence of other information, given a floc of size x, we will assume a uniform post-fragmentation distribution, centered around x/2, with width x/3
There is some evidence that for shear rates in our experimental regime, this fragmentation distribution is a reasonable approximation [9]. Effectively, this restricts our model to binary fragmentation (as opposed to trinary or quaternary).
6 Numerical Experiments
A primary goal of this work is to develop a methodology for making conclusions regarding to fate of bacterial aggregates growing in suspension and experiencing shear forces. While we were able to fit the solution to our model to observational data, preliminary results suggested that these parameter fits were highly sensitive. We therefore, investigated the convergence of our numerical scheme and fit simulated data with varying levels of noise and increased volumetric and temporal resolution. Table 1 summarizes the parameters common to all simulations, unless otherwise specified below.
Table 1.
Parameters common to all simulations, unless otherwise specified.
| Symbol | Value | Description | Units |
|---|---|---|---|
| x | 2 | lower boundary of viable floc size | fL |
| x̄ | 1000 | upper boundary of viable floc size. | fL |
| N | 50 | number of basis elements in simulation | - |
| M1 | 5 | number of observed volume windows | - |
| M2 | 7 | number of observed timepoints | - |
| ε | 4.43 × 10⁻⁴ | turbulent energy dissipation | m2s−3 |
| ν | 1.99 × 10⁻⁶ | kinematic viscosity | m2s−1 |
| κG | 1000 | maximal floc size | fL |
| γG | 6.8 × 10⁻⁴ | growth | min−1 |
| γA | 2.7 × 10⁻¹⁵ | aggregation | fL−2 |
| γF | 6.6e − 5 | fragmentation | μm−1fL−1min−1 |
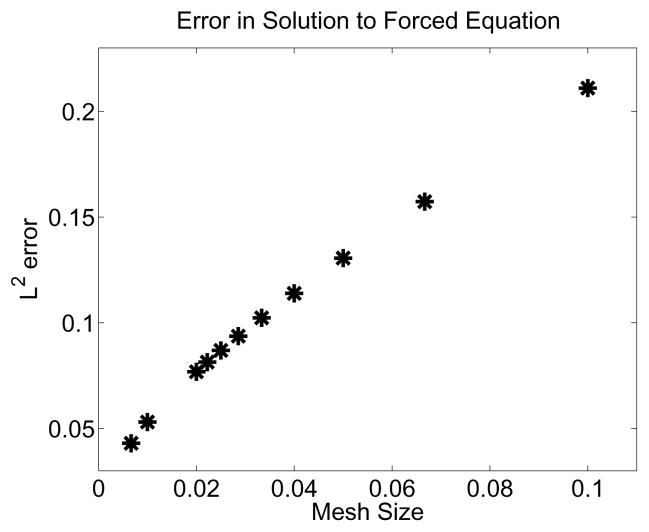
For our model equation (8), there are no closed form solutions. Thus, to provide evidence for the convergence results from Section 4, we arbitrarily created a couple of solutions
and derived forcing functions (using Maple) for the right side which would generate these solutions. Figure 3 depicts the convergence results for b1 as the volume mesh size is reduced. The results for b2 were similar and thus not presented here.
Figure 3.
Improved accuracy of the numerical scheme as the stepsize is decreased. These results are for the accuracy of the numerical approximation where the x and t domains are both [0, 1].
To identify the initial condition b0, we need to carefully incorporate the experimental information. The particle sizer records the number of flocs having volumes in a priori defined intervals. Let M1 be the number of windows defined by , where the yj’s correspond to the boundaries of the data windows. To reflect a window of volumes the sizer can accurately measure, we will consider measurements between y0 = 5 and yM1 = 400 femtoliters. Let nj(t) denote the number of aggregates at time t having volumes in [yj−1, yj]. The shape of the initial biofilm growing on the agar is approximated by an oblate hemisphere with diameter 1.25mm and height 0.25mm. For the same diameter and height, a right circular cone would have a volume of 1.47 × 10⁸ fL and a cylinder would have a volume of 4.42 × 10⁸ fL. We therefore assume an initial biomass of B1 = 3 × 10⁸ fL. Following initial fragmentation of the inoculum, we also assume that there are no flocs bigger than 400 femtoliters.
Much work has been done to identify self-similar solutions of our equations, and we initially tried to employ a single exponential decay for the initial condition. The fit, however, left much to be desired, and thus in the absence of higher resolution measurements, we assumed a bi-exponential for the shape of the initial density
| (13) |
Since we know the initial biomass B1, we can identify C1
| (14) |
To identify the other three parameters, we minimized
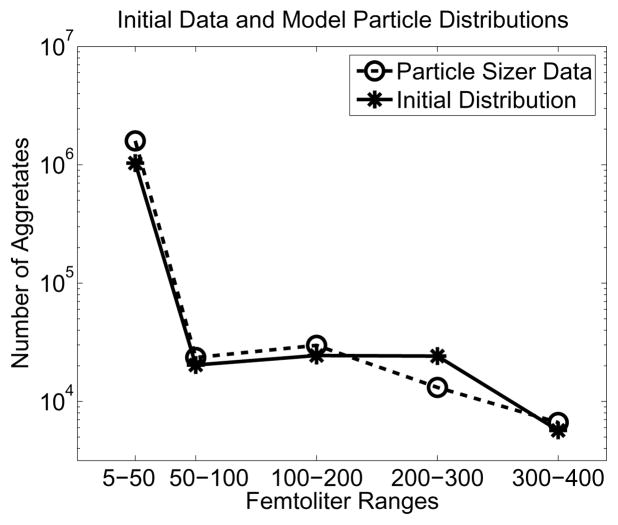
over γ1, C2, and γ2, where b0 is defined in (13) and C1 is defined in (14). We employed the sequential quadratic programming method with inequality constraints and BFGS Hessian update in Matlab’s fmincon, supplying it with the analytically computed gradient. Depicted in Figure 4 are the initial particle sizer measurements (nj(0)) and the corresponding number of aggregates computed from an initial density of b0(x) = 3.868 × 10⁹e−1.5618x + 7.474 × 10⁻⁴e−0.00676x.
Figure 4.
Initial data distribution and initial particle size distribution based on fitted bi-exponential density.
We chose 2 femtoliters as a lower bound x in our simulations, which is the smallest size for a viable bacteria without its capsule. The estimate for this value was obtained from the bacteria length and diameter measured in a length-calibrate electron microscopy of individual bacteria. The upper bound x̄ of the domain was chosen as 1000 femtoliters, which is twice as large as the largest observed flocs (in the 240 minutes of the experiment).
We assume the following independent identically distributed log-normal error distribution with mean zero and variance σ2 at time t
| (15) |
For the inverse problem of parameter identification, we then naturally consider a nonlinear least squares formulation and minimize the square of the differences of the log transforms. That is, we minimize the cost functional
| (16) |
for q = (γG, γA, γF) (normalized by 10−2, 10−13, and 10−5, respectively, when computed by the optimizer) and M2 observations at times tk, k = 1, …, M2. There is an open question of well-posedness of the analytical and approximate inverse problems, similar to that addressed in [1]. For the purposes of this paper, however, we will assume the problem is well-posed.
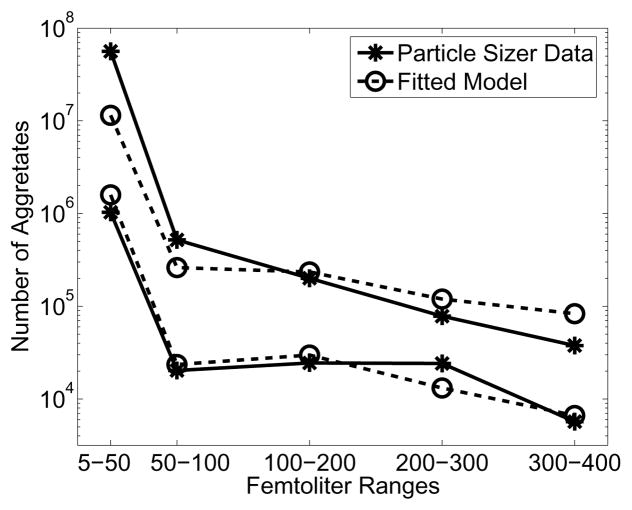
All simulations were performed in Matlab version 7.0.4.352 on an AMD Opteron 2GHz workstation running SUSE Linux 10.0. We employed the same SQP-optimization algorithm as above (though without analytical gradients) to minimize (16). The optimization algorithm identified γG = 6.8 × 10⁻⁴ min−1, γA = 2.7 × 10⁻¹⁵ fL−2, and γF = 6.6 × 10⁻⁵ μm−1fL−1min−1 as the best fit parameters. Depicted in Figure 5 are the initial and final distributions of particle sizes from the best fit simulation and the data. The fit is reasonable and suggests that our model captures the macroscopic behavior. The media itself has a high carbon to nitrogen ratio, promoting capsule formation and not proliferation. It is, therefore, reassuring that the identified growth rate γG = 6.84 × 10⁻⁴ min−1 is relatively small, since the maximum doubling time for K. pneumoniae is about 35 minutes (corresponding to a growth rate of 0.03 min−1).
Figure 5.
Plot of fitted distributions at the initial time (bottom curves) and the final time (top curves) for parameters γG = 6.8 × 10⁻⁴min−1, γA = 2.7 × 10⁻¹⁵fL−2, and γF = 6.6 × 10⁻⁵μm−1fL−1min−1. All other parameters are as described in Table 1.
We note, however, that the vertical axis in Figure 5 is on a log scale, and the order of magnitude error suggests that our model does not fully capture some aspects of the experiment. One possibility would be that bacteria are switching to a non-flocculating phenotype. The lack of this feature in our model could explain why the errors are relatively high for the smaller volume windows.
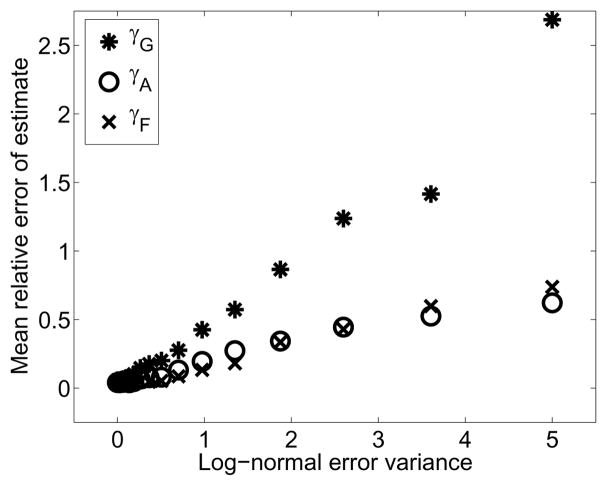
To explore the sensitivity of these results, we generated a baseline numerical solution using the best fit parameters and “observed” the solution in a variety of ways. For a range of noise variances σ2, we sampled particle sizer observations of the baseline solution (100 samples per noise level). The sizer resolution and temporal frequency of the samplings were the same as the original experiments. Depicted in Figure 6 is the mean of the relative error in parameters fits to each of the 100 noisy observations as each noise level. As expected, it is easier to recover the parameters when there is less noise in the data.
Figure 6.
Mean relative error in the parameter estimates for increasing log-normal errors in the simulated data observations.
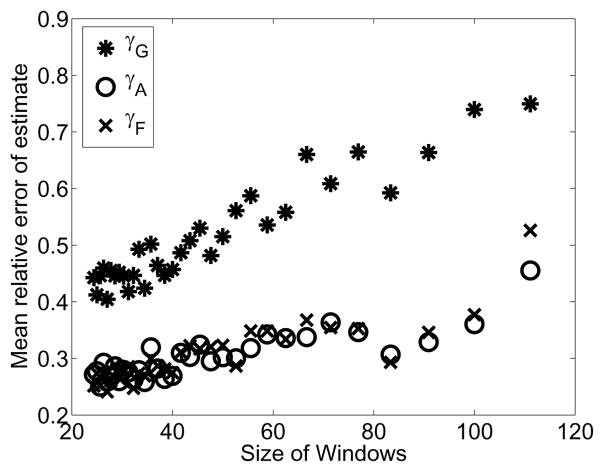
For a noise level of σ2 = 1.5, we explored the effect of increasing the resolution of the particle sizer. In the laboratory experiment, the windows were chosen based upon valid ranges specified by the sizer manufacturer. We increased the measured resolution in a uniform manner and observed the distributions at the same timepoints as in the original experiment. Depicted in Figure 7 is the variance of the relative error in parameter fits to each of 100 noisy observations at each resolution level.
Figure 7.
Mean relative error for the parameter estimates for a range of volume resolutions. The parameters were fit 100 times for each volume resolution level where each fit was to the actual solution with artificial log-normal (μ = 0, σ2 = 1.5) measurement errors.
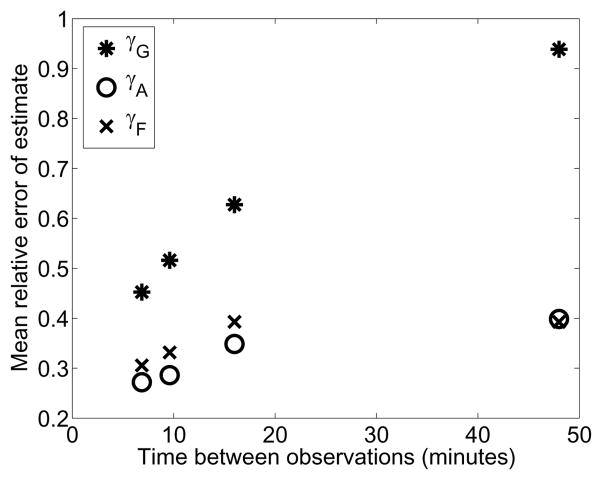
In our lab, it is impractical to generate observations faster than approximately once every 22 minutes, and we were interested if this fact was inhibiting our analyses. For a noise level of σ2 = 1.5, we also explored increasing the temporal resolution of the particle sizer. In the numerical experiment, the particle sizer windows are the same as in the experiment. Depicted in Figure 8 is the mean of the relative error in parameter fits to each of 100 noisy observations at each observation frequency.
Figure 8.
Mean relative error for the parameter estimates for a range of temporal observation frequencies. As before, the parameters were fit 100 times for each volume resolution level where each fit was to the actual solution with artificial log-normal (μ = 0, σ2 = 1.5) measurement errors.
7 Conclusions and Discussion
An important infection pathway for both hospital- and community-acquired infections related to indwelling catheters and devices is the shedding of bacterial aggregates off of biofilms. In the current work, we have focused on behavior in suspension that might be anticipated downstream from an intravascular catheter shedding material or that might occur spontaneously among bacteria that find themselves in the bloodstream by direct invasion from the lung or kidney.
We have developed a mathematical model for the evolution of the distribution of bacterial aggregates in suspension. We have ensured the mathematical validity of the model by proving existence and uniqueness of a solution to this model. We have also implemented a uniformly (in time) convergent numerical scheme. We fit the solution to a data set, nothing that the identified parameters were biologically reasonable. We also explored the sensitivity of our fitted parameters to different measurement strategies. Though the use of a particle sizer for data acquisition is attractive because of cost and simplicity, the numerical experiments in Section 6 revealed the weakness of this approach. Future plans, therefore, include implementing a confocal microscopy to allow compartmentalization of floc volume into cellular and extracellular matrix components, and exploiting, via dynamic light scattering, the autocorrelation of the Einstein-Stokes phenomena to estimate b(t, x) directly with finer temporal and spatial resolution.
In vivo it is possible that non-flocculating bacteria are destroyed by the immune system, while large aggregates septically embolize in capillaries. We are thus interested in the fate of flocs smaller than 10μm in diameter, but large enough to survive an attack by a neutrophil or by humoral defenses such as complement. With these selective pressures on the flocculating population, it is highly unlikely that one floc will encounter another in the circulatory system. Future experiments should, therefore, be designed to mitigate the aggregation mechanism, since it is an artifact of the swirling flask.
There are many aspects of both the bacteria and the in vivo system which we have not chosen to model. It is known, for example, that AI2-mediated signaling is related to biofilm development. Current technological limitations make is challenging to quantify the contribution of interbacterial signaling. In future modeling work, however, we plan to explore the incorporation of this idea.
Acknowledgments
D. M. Bortz, T. L. Jackson, and J. G. Younger are supported in part by NIH grant 3R01GM069438-02S1. The authors also wish to thank A. J. Christieb (Michigan) for enlightening discussions concerning the numerical simulations.
Footnotes
For the remainder of this article, we use “aggregation” in place of “coagulation” to avoid confusion with hematological phenomena, and “flocculation” to describe the overall clustering process.
In the engineering literature, this is frequently referred to as a “population balance” model. We refer the interested reader to [20, 21, 22]
The flask contained 150mL of liquid and was agitated at 150rpms in a 1.9cm orbit.
Contributor Information
D. M. Bortz, Email: dmbortz@umich.edu.
T. L. Jackson, Email: tjacks@umich.edu.
K. A. Taylor, Email: kat2103@columbia.ed.
A. P. Thompson, Email: apthom@umich.edu.
J. G. Younger, Email: jyounger@umich.edu.
References
- 1.Ackleh AS, Banks HT, Deng K, Hu S. Parameter estimation in a coupled system of nonlinear size-structured populations. Mathematical Biosciences and Engineering. 2005 Apr;2(2):289–315. doi: 10.3934/mbe.2005.2.289. [DOI] [PubMed] [Google Scholar]
- 2.Ackleh AS, Fitzpatrick BG. Modeling aggregation and growth processes in an algal population model: analysis and computations. Journal of Mathematical Biology. 1997;35:480–502. [Google Scholar]
- 3.Aldous DJ. Deterministic and stochastic models for coalescence (aggregation, coagulation): A review of the mean-field theory for probabilists. Bernoulli. 1999;5:3–48. [Google Scholar]
- 4.Anderl JN, Zahller J, Roe F, Stewart PS. Role of nutrient limitation and stationary-phase existence in Klebsiella pneumoniae biofilm resistance to ampicillin and ciproflaxacin. Antimicrobial Agents and Chemotherapy. 2003;47(4):1251–1256. doi: 10.1128/AAC.47.4.1251-1256.2003. [DOI] [PMC free article] [PubMed] [Google Scholar]
- 5.Balestrino D, Haagensen JAJ, Rich C, Forestier C. Characterization of type 2 quorum sensing in Klebsiella pneumoniae and relationship to biofilm formation. Journal of Bacteriology. 2005 Apr;187(8):2870–2880. doi: 10.1128/JB.187.8.2870-2880.2005. [DOI] [PMC free article] [PubMed] [Google Scholar]
- 6.Banks HT, Kappel F. Transformation semigroups and L1-approximation for size structured population models. Semigroup Forum. 1989;38:141–155. [Google Scholar]
- 7.Drake RL. A general mathematical survey of the coagulation equation. In: Hidy GM, Brock JR, editors. Topics in Current Aerosol Research (Part 2), volume 3 of International Reviews in Aerosol Physics and Chemistry. Pergamon Press; New York, NY: 1972. pp. 201–376. [Google Scholar]
- 8.Dubovskii PB. Number 23 in Lecture Notes Series. Research Institute of Mathematics: Global Analysis Center, Seoul National University; Seoul: Korea: 1994. Mathematical Theory of Coagulation; pp. 151–742. [Google Scholar]
- 9.Han B, Akeprathumchai S, Wickramasinghe SR, Qian X. Flocculation of biological cells: Experiment vs. theory. AIChE Journal. 2003;49(7):1687–1701. [Google Scholar]
- 10.Kaku VJ, Boufadel MC, Venosa AD. Evaluation of mixing energy in laboratory flasks used for dispersant effectiveness testing. Journal of Environmental Engineering. 2006 Jan;132(1):93–101. [Google Scholar]
- 11.Makino J, Fukushige T, Funato Y, Kokubo E. On the mass distribution of planetesimals in the early runaway stage. New Astronomy. 1998;3:411–417. [Google Scholar]
- 12.Müller H. Zur allgemeinen theorie der raschen koagulation. Kolloidchemische Beihefte. 1928;27:257–311. [Google Scholar]
- 13.Pawar P, Shin PK, Mousa SA, Ross JM, Konstantopoulos K. Fluid shear regulates the kinetics and receptor specificity of Staphylococcus aureus binding to activated platelets. The Journal of Immunology. 2004;173:1258–1265. doi: 10.4049/jimmunol.173.2.1258. [DOI] [PubMed] [Google Scholar]
- 14.Pazy A. Applied Mathematical Sciences. Vol. 44. Springer-Verlag; New York, NY: 1992. Semigroups of Linear Operators and Applications to Partial Differential Equations. [Google Scholar]
- 15.Podschun R, Ullmann U. Klebsiella spp. as nosocomial pathogens: Epidemiology, taxonomy, typing methods, and pathogenicity factors. Clinical Microbiology Reviews. 1998 Oct;11(4):589–603. doi: 10.1128/cmr.11.4.589. [DOI] [PMC free article] [PubMed] [Google Scholar]
- 16.Poppele EH, Hozalski RM. Micro-cantilever method for measuring the tensile strength of biofilms and microbial flocs. Journal of Microbiological Methods. 2003 Dec;55(3):607–615. doi: 10.1016/s0167-7012(03)00198-2. [DOI] [PubMed] [Google Scholar]
- 17.Pruppacher HR, Klett JD. Microphysics of Clouds and Precipitation. Riedel; Boston, MA: 1980. [Google Scholar]
- 18.Riebesell U, Wolf-Gladrow DA. The relationship between physical aggregation of phytoplankton and particle flux: A numerical model. Deep-Sea Research. 1992;39(7/8):1085–1102. [Google Scholar]
- 19.Saffman PG, Turner JS. On the collision of drops in turbulent clouds. Journal of Fluid Mechanics. 1956;1:16–30. [Google Scholar]
- 20.Smit DJ, Hounslow MJ, Paterson WR. Aggregation and gelation - I. analytical solutions for CST and batch operation. Chemical Engineering Science. 1994;49(7):1025–1035. [Google Scholar]
- 21.Smit DJ, Hounslow MJ, Paterson WR. Aggregation and gelation - II. mixing effects in continuous flow vessels. Chemical Engineering Science. 1994;49(18):3147–3167. [Google Scholar]
- 22.Smit DJ, Hounslow MJ, Paterson WR. Aggregation and gelation - III. numerical classification of kernels and case studies of aggregation and growth. Chemical Engineering Science. 1995;50(5):849–862. [Google Scholar]
- 23.Somasundaran P, Runkanan V, Kapur PC. Chapter 11: Flocculation and dispersion of collodial suspensions by polymers and surfactants: Experimental and modeling studies. Coagulation and Flocculation. (24):767–803. [Google Scholar]
- 24.Stechemesser H, Dobiás B. Surfactant Science Series. 2. Vol. 126. Taylor and Francis; 2005. Coagulation and Flocculation. [Google Scholar]
- 25.van Smoluchowski M. Drei vorträge über diffusion, brownsche bewegung und koagulation von kolloidteilchen. Zeitschrift für Physik. 1916;17:557–571. 585–599. [Google Scholar]
- 26.van Smoluchowski M. Versuch einer mathematischen theorie der koagulation kinetic kolloider losungen. Zeitschrift für physikalische Chemie. 1917;92:129–168. [Google Scholar]
- 27.Wentland EJ, Stewart PS, Huang CT, McFeters GA. Spatial variations in growth rate within Klebsiella pneumoniae colonies and biofilm. Biotechnology Progress. 1996;12:316–321. doi: 10.1021/bp9600243. [DOI] [PubMed] [Google Scholar]
- 28.Zahller J, Stewart PS. Transmission electron microscope study of antibiotic action on Klebsiella pneumoniae biofilm. Antimicrobial Agents and Chemotherapy. 2002;46(8):2679–2683. doi: 10.1128/AAC.46.8.2679-2683.2002. [DOI] [PMC free article] [PubMed] [Google Scholar]


