Abstract
The development of spectral computed tomography (CT) using binned photon-counting detectors has garnered great interest in recent years and has enabled selective imaging of K-edge materials. A practical challenge in CT image reconstruction of K-edge materials is the mitigation of image artifacts that arise from reduced-view and/or noisy decomposed sinogram data. In this Note, we describe and investigate sparsity-regularized penalized weighted least squares-based image reconstruction algorithms for reconstructing K-edge images from few-view decomposed K-edge sinogram data. To exploit the inherent sparseness of typical K-edge images, we investigate use of a total variation (TV) penalty and a weighted sum of a TV penalty and an ℓ1-norm with a wavelet sparsifying transform. Computer-simulation and experimental phantom studies are conducted to quantitatively demonstrate the effectiveness of the proposed reconstruction algorithms.
Keywords: Computed tomography (CT), energy-resolved CT, K-edge imaging, material-decomposition, statistical image reconstruction, total variation regularization
1. Introduction
The development of spectral X-ray computed tomography (CT) using binned photon-counting detectors has received great attention in recent years and is prompting a paradigm shift in X-ray CT imaging. These advancements are likely to benefit numerous preclinical and clinical imaging applications. For example, K-edge CT has been investigated as a modality to image contrast agents such as iodine (Abudurexiti, Kameda, Sato, Abderyim, Enomoto, Watanabe, Hitomi, Tanaka, Mori, Kawai, Takahashi, Sato, Ogawa & Onagawa 2010, He, Wei, Cong & Wang 2012), gadolinium (Feuerlein, Roessl, Proksa, Martens, Klass, Jeltsch, Rasche, Brambs, Hoffmann & Schlomka 2008), bismuth (Pan, Roessl, Schlomka, Shelton, Senpan, Scott, Allen, Zhang, Hu, Gaffney, Choi, Rasche, Wickline, Proksa & Lanza 2010), and gold (Cormode, Roessl, Thran, Skajaa, Gordon, Schlomka, Fuster, Fisher, Mulder, Proksa & Fayad 2010). Ytterbium was recently discussed as a contrast agent for conventional CT (Liu, Ai, Liu, Yuan, He & Lu 2012) in general and K-edge imaging (Pan, Schirra, Senpan, Schmieder, Stacy, Roessl, Thran, Wickline, Proska & Lanza 2012).
The task of image reconstruction in spectral CT can be implemented in a two-stage processing scheme. In the first step, estimates of material-decomposed sinograms are obtained from the measured energy-resolved photon counts. In the second step, material images are reconstructed from knowledge of the material sinogram estimates. Statistically-principled reconstruction algorithms have been proposed (Sauer & Bouman 1993, Fessler, Elbakri, Sukovic & Clinthorne 2002, Thibault, Sauer, Bouman & Hsieh 2007, Schirra, Roessl, Koehler, Brendel, Thran & Proksa 2011) that seek to minimize a penalized weighted least squares (PWLS) cost function. The weighting matrix employed in the data-fidelity term, which corresponds to the inverse covariance of the computed material sinograms, can be estimated in different ways (Fessler 1996, Roessl & Herrmann 2009a, Zhang, Thibault, Bouman, Sauer & Hsieh 2012).
While it holds great potential for important preclinical and clinical applications, selective imaging of K-edge materials in spectral CT faces challenges that currently limit its applicability. Implementations of K-edge CT employ photon counting detectors to detect the energies of individual photons. To avoid pulse-pileup in the detector, photon fluxes must be limited, which can result in long data-acquisition times. One way to mitigate long data-acquisition times is to develop image reconstruction algorithms that can produce useful images from few-view and/or noisy decomposed sinogram data. While K-edge images are often sparse, the ability of sparsity-based regularization strategies coupled with knowledge of the object-specific noise properties of the decomposed K-edge sinogram data to improve reconstructed image quality in K-edge CT remains largely unexplored.
In this Note, sparsity-regularized PWLS methods are investigated for reconstructing K-edge images from few-view decomposed sinogram data. Object-specific information regarding the decomposed K-edge sinogram variance is employed to weight the data fidelity term in the PWLS cost function. Two choices for the penalty term in the cost function are investigated: a total variation (TV) penalty and a weighted sum of a TV penalty and an ℓ1-norm with a wavelet sparsifying transform (Lustig, Donoho & Pauly 2007, Dutta, Ahn, Li, Cherry & Leahy 2012). While TV and other sparsity promoting regularization strategies have been extensively applied for reconstruction problems that explictly or implicitly minimize a penalized least squares (PLS) cost function (Sidky & Pan 2008, Bian, Siewerdsen, Han, Sidky, Prince, Pelizzari & Pan 2010, Gao, Yu, Osher & Wang 2011, Xu, Yang, Tan & Anastasio 2012, Xu, Sidky, Pan, Stampanoni, Modregger & Anastasio 2012, Yang, Wang & Guo 2013), relatively few works have investigated the impact of exploiting such regularization strategies in combination with a statistically weighted data fidelity term in a PWLS framework (Ramani & Fessler 2012, Ma 2011). Computer-simulation and experimental phantom studies are conducted to visually and quantitatively demonstrate the efficacy of the proposed reconstruction methods.
2. Materials and Methods
2.1. PWLS Image Reconstruction with TV and ℓ1-norm Regularization
In spectral CT imaging equipped with photon-counting detectors, a set of Nb energy resolved photon count measurements are obtained and employed to estimate a collection of Nm ≤ Nb sinograms that represent pre-determined material properties. This process is referred to as material sinogram decomposition. Let An denote a lexicographically ordered vector representing the decomposed sinogram corresponding to the n-the material, and let A = [A1; …; ANm] denote the vector formed by stacking all of the An. Maximum likelihood (ML) estimates of A, denoted by Â, can be obtained assuming a Poisson noise model (Roessl & Proksa 2007). Given the ML-estimator, the diagonal elements of the Fisher information matrix can be numerically computed (Cowan 1998, Roessl & Herrmann 2009b) and used to estimate the variance of the decomposed sinograms.
We consider the problem of reconstructing an estimate of the n-th object material individually, which is assumed to be a K-edge material. Let fn denote a N-dimensional approximation of the sought-after K-edge material distribution. In this work, conventional pixels were utilized to form fn. The M-dimensional vector Ân representing the decomposed K-edge sonogram estimate is related to fn by the approximate imaging model Ân = Hfn, where the M × N matrix H represents a discrete 2D fan-beam forward projector in the two-dimensional studies described below.
The following PWLS estimators of fn were considered:
| (1) |
and
| (2) |
where λtv and λl1 are positive regularization parameters, ||·||tv and ||·||1 denote the TV and ℓ1-norms, and Φ is a wavelet transform operator. In this work, Φ was chosen as the Daubechies discrete wavelet transform involving three wavelet scales. The M×M diagonal weight matrix Wn contains elements that are specified by the inverse of the variance of each sinogram element that, in this work, are estimated by use of the Fisher information matrix as described previously (Roessl & Herrmann 2009a). Since the second order statistics of the decomposed sinograms can be accurately described by Gaussian statistics (Schirra, Roessl, Koehler, Brendel, Thran, Pan, Anastasio & Proksa 2013), the above PWLS estimators can be considered as accurate approximations of penalized maximum likelihood estimators. Our method for solving Eq. (1) will be referred to as the PWLS-TV method. In the case when the sinogram variance information is ignored and Wn is redefined as the M×M identity matrix, the implementation of Eq. (1) will be referred to as the PLS-TV method. Similarly, our method for solving Eq. (2) will be referred to as the PWLS-TV-ℓ1 method. The PWLS-TV and PLS-TV methods were implemented by use of the fast iterative shrinkage- thresholding algorithm (FISTA) (Beck & Teboulle 2009). The PWLS-TV-ℓ1 method was implemented by use of the combination of the splitting algorithm proposed by Combettes (Combettes & Pesquet 2008) and the FISTA. A similar strategy has also been proposed by two previous works (Ma, Yin, Zhang & Chakraborty 2008, Huang, Zhang & Metaxas 2011) for MR image reconstruction, in which the variance Wn was an identify matrix.
It should be noted that combining the TV and ℓ1-norm penalties (Carter 2013) in Eq. (2) is motivated by the fact that use of a PLS-TV estimator can result in patch-like image distortions if the chosen value of the regularization parameter λtv is too large. Combining the penalties yields the opportunity to exploit the effective denoising properties of TV regularization while mitigating these distortions. A previous work (Gao et al. 2011) employed a similar approach for a ‘fully-spectral’ CT problem in which the sinogram decomposition step was avoided. That work differs from our study in several ways. For example, it was based on a linearized imaging model that assumed monochromatic illumination, it did not investigate the incorporation of the second-order statistical properties of the measurement data into the reconstruction method, and did not exploit object sparsity in the wavelet transform domain.
2.2. Computer-Simulation Studies
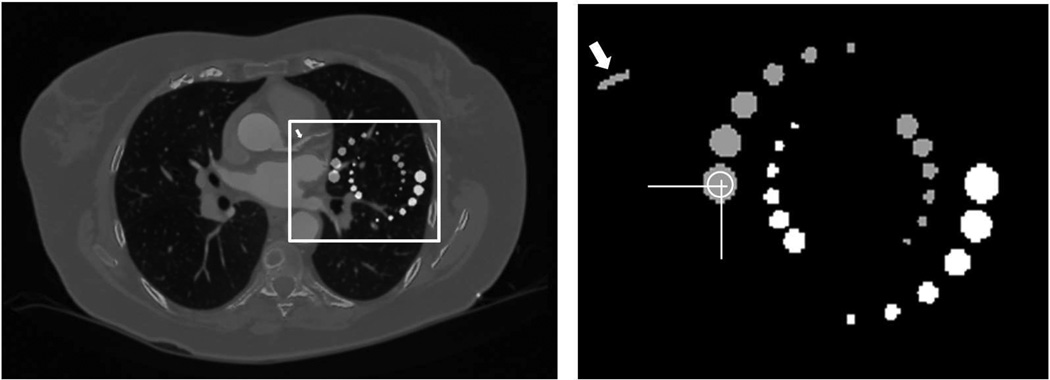
Computer-simulation studies were conducted to investigate: (1) the advantages of the PWLS-TV method over the PLS-TV method for reduced-view K-edge image reconstruction; and (2) the advantages of the PWLS-TV-ℓ1 method over the PWLS-TV method for the same task. A numerical phantom was created from a representative conventional CT image dataset that had been originally acquired with a clinical system (Brilliance iCT, Philips Healthcare, Eindhoven, The Netherlands). The clinical CT image was segmented into ‘soft tissue’ and ‘bone’ components. In addition, objects containing ytterbium were inserted as shown in Fig. 1 (left). A zoomed-in region containing the ytterbium inserts is provided in Fig. 1 (right). The cylinder indicated by the arrow in the upper-left region was intended to mimic a fibrin-targeted contrast agent in a coronary artery. All material attenuation coefficients were determined from the Photon Cross Sections Database (Berger, Hubbell, Seltzer, Chang, Coursey, Sukumar, Zucker & Olsen 1998).
Figure 1.
The numerical phantom employed in the computer-simulation studies is shown in the left panel and is described in the text. The right panel displays a zoomed-in image of the ytterbium inserts contained within the white box in the left panel.
From this numerical phantom, material-specific line integral data and variance estimates (Roessl & Herrmann 2009a) were computed for the material basis set ‘photo-electric absorption’, ‘Compton effect’, and ‘ytterbium’, assuming a 2D equal-angle fan- beam geometry. The source-to-rotation center distance was 0.57 m and the distance between the source and the center of the detector was 1.04 m. The fan-angle was approximately 52 degrees and the number of detector units was 1024. An x-ray source spectrum and detector response function for a binned photon-counting detector was employed as described in a previous study (Schlomka, Roessl, Dorscheid, Dill, Martens, Istel, Bumer, Herrmann, Steadman, Zeitler, Livne & Proksa 2008). The energy thresholds of the six energy bins were set at 25, 46, 61, 64, 76 and 91 keV, respectively. These energy bins were determined in our previous sensitivity of photon-counting based K-edge imaging study(Roessl, Brendel, Engel, Schlomka, Thran & Proksa 2011). The following scan protocol parameters were assumed: anode voltage 130 kVp, anode current 400mA, 1200 views/turn, 0.27s/turn.
By use of the estimated variance matrix and treating the noiseless ytterbium sinogram estimate as the mean of a Gaussian random vector, an ensemble of M = 500 noisy K-edge sinograms was computed. The PWLS-TV and PLS-TV methods were employed to reconstruct 500 images from the ensemble of noisy K-edge sinograms. Images were reconstructed by use of the two reconstruction methods from reduced-view K-edge sinograms that contained 400, 200, and 100 equally spaced tomographic view angles over 360°. Different choices of the regularization parameter values were considered as described below. In all cases, the reconstructed images were of dimension 1024 × 1024 with a pixel size 0.5 × 0.5 mm2. The stopping criteria adopted in all studies was chosen such that a converged result was ensured. Specifically, iterations were terminated when changes in the objective function occurred only in the sixth decimal place.
2.2.1. Assessment of spatial resolution and noise properties
From the ensemble of noisy images reconstructed by use of the PLS-TV and PWLS-TV methods, the average empirical image variance within the region-of-interest (ROI) indicated by the white circle in the right image shown in Fig. 1 was computed. To quantify the anisotropic spatial resolution, a cumulative Gaussian function (La Rivière 2005) was fit to two orthogonal profiles in the mean image, respectively, whose locations are indicated in the right panel of Fig. 1. The full-width at half-maximum (FWHM) value of the fitted error function served as a summary measure of spatial resolution at that location in image space, with smaller values indicating higher spatial resolution.
The values of the regularization parameters employed in this study were chosen in a way that the appearance of reconstructed images varied subjectively from under-smoothed (high-level noise) to relatively over-smoothed (low-noise level). The effects of incorporating sinogram variance information can be easily identified in such a comparision, since the PLS-TV and PWLS-TV method have the same TV regularization term and the only difference between the two methods is whether the sinogram variances was incorporated or not. The PWLS-TV-ℓ1 method was not examined in this component of our study due to the added complication of having to systematically vary two regularization parameters.
2.2.2. Quantitative measurement of different reconstruction algorithms performance
The structural similarity index measurement (SSIM) (Wang, Bovik, Sheikh & Simoncelli 2004) was adopted to quantify the similarity between images reconstructed by use of the different methods and the original phantom object. The absolute value of each element in an image of SSIM values is between 0 and 1, in which the value of 1 is obtained only if the pixel values of the images being compared are identical. A mean SSIM (MSSIM) value was computed by averaging the SSIM image.
2.3. Phantom Experiment with Targeted Ytterbium-Nanoparticles
To corroborate the computer-simulation results, experimental data were acquired with a spectral CT small animal scanner prototype (Philips Research, Hamburg, Germany). Figure 2(a) shows a representative slice of a conventional CT reconstruction of the phantom (PMMA, diameter 50 mm). It was composed of calcium chloride probes (3 mol/l), mimicking the rib cage, and in its center four X-ray lucent tubes, two tubes filled with suspension of ytterbium nanocolloids (Pan et al. 2012) diluted with water in the ratio 1:1 and 1:4, respectively, and two probes containing human fibrin-rich clots. One of the clots was targeted with YbNC equipped with a fibrin-specific antibody designed to bind to ruptured plaque (Pan et al. 2010) while the other did not contain any YbNC. The following scan parameters were used: anode voltage 130 kVp, anode current 50 mA, planar detector geometry, 1250 views/turn, rotation time/turn 100 s, energy thresholds identical to the settings of the simulation. A ML estimate of the decomposed K-edge sinogram corresponding to ‘ytterbium’ was computed along with an estimate of the sinogram variance. The estimated K-edge sinogram and sinogram variance are displayed in Fig. 2(b) and 2(c), respectively. Note that a high noise level in the decomposed sinogram can be observed. Images were reconstructed by use of the different reconstruction methods on a 256×256 matrix with a pixel size of 0.24×0.24 mm2.
Figure 2.
Physical Phantom Experiment: (a) Conventional CT reconstruction of the physical phantom using a standard filtered backprojection (FBP) algorithm. (b) Decomposed K-edge (ytterbium) sinogram. (c) The estimated sinogram variance.
3. Results
3.1. Computer-Simulation Studies
3.1.1. Spatial resolution and noise properties
The plots of image variance vs. spatial resolution that were created by sweeping the regularization parameter and are displayed in Fig. 3 for cases in which 400, 200, or 100 tomographic views were employed for image reconstruction. In all cases, the PWLS-TV method (solid curves) shows a superior tradeoff between variance and resolution compared to the PLS-TV method (dashed curves). This confirms the expected finding that it is advantageous to employ knowledge of the decomposed sinogram variance in the reconstruction method. This is found to be especially important for mitigating deteroriation of the variance and resolution properties when reduced-view tomographic data are employed, as demonstrated by the significantly improved performance of the PWLS-TV over the PLS-TV method for the 100- and 200- view cases.
Figure 3.
Computer-simulation studies: Ensemble variances as a function of spatial resolution (FWHM) for different undersampling factors. The curves are parametrized by the regularization parameter. FWHM values are evaluated in horizontal (black) and vertical (gray) orientation at positions shown in Fig. 1. The PWLS-TV results (solid) show an improved noise-resolution performance compared to PLS-TV (dashed).
3.1.2. Qualitatively assessments
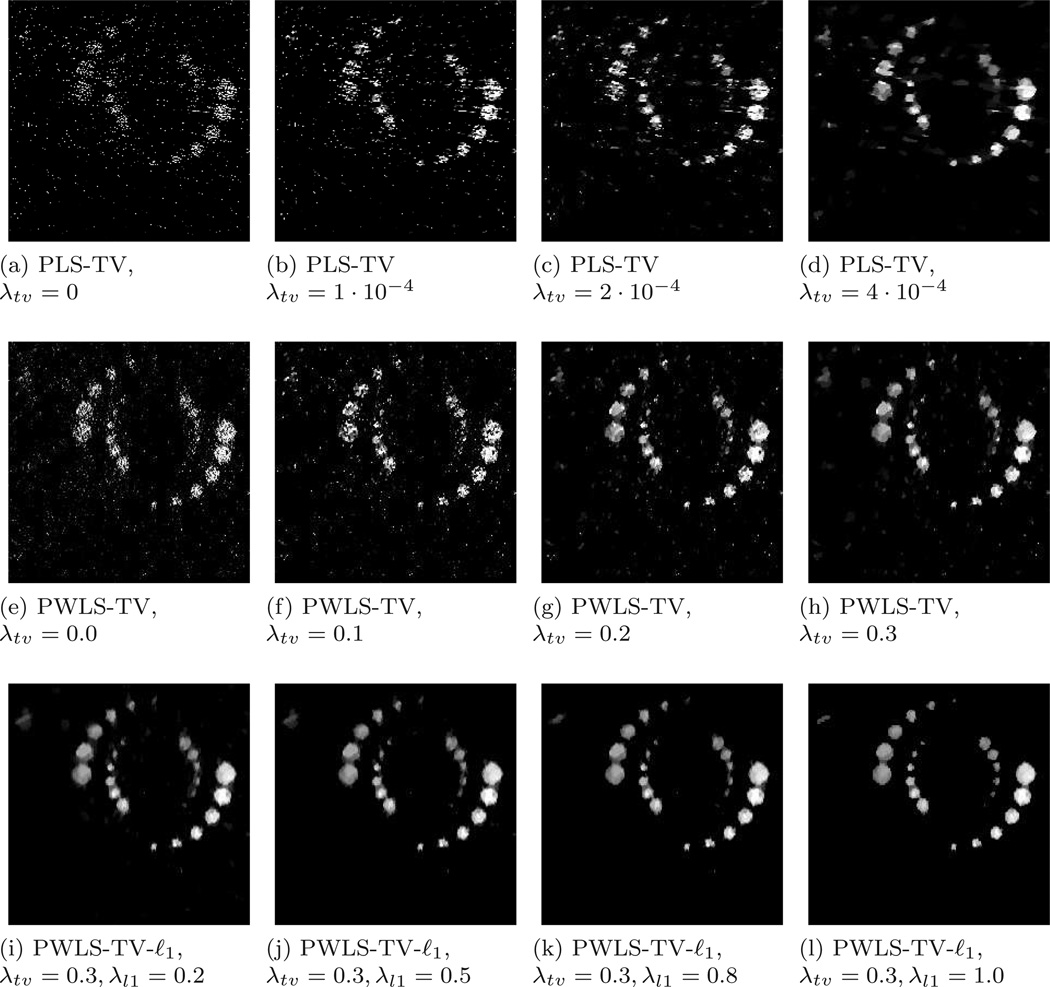
To visually examine the effects of incorporating the decomposed sinogram variance in the reconstruction method, examples of images reconstructed by use of the PLS-TV and PWLS-TV methods for the 200-view case are shown in Figure 4(a)–(d), (e)–(h). In the first and second rows, from left-to-right, the TV regularization parameter λtv was increased from zero to some positive value. When no TV penalty was added (λtv = 0), the impact of incorporating the sinogram variance can be observed readily. In particular, the PWLS estimate in Fig. 4(e) contains structures whose shapes are better preserved than those in the PLS estimate in Fig. 4(a). For the case when TV regularization was employed, the PLS-TV estimates in Figs. 4(c) and (d) contained lower noise levels but some of the small object structures were lost. On the other hand, the structures in Fig. 4(h) reconstructed by the PWLS-TV method are perserved with better appearance with less shape distortion, especially for small structures.
Figure 4.
Computer-simulation studies: Examples of reconstructed K-edge images ROIs for the 200-view case corresponding to different regularization parameter values. All images are cropped to size of 300 × 300 pixels and are displayed in the same grey-scale window. Images reconstructed via PLS-TV (a–d), PWLS-TV (e-h) and PWLS-TV-ℓ1 (i–h).
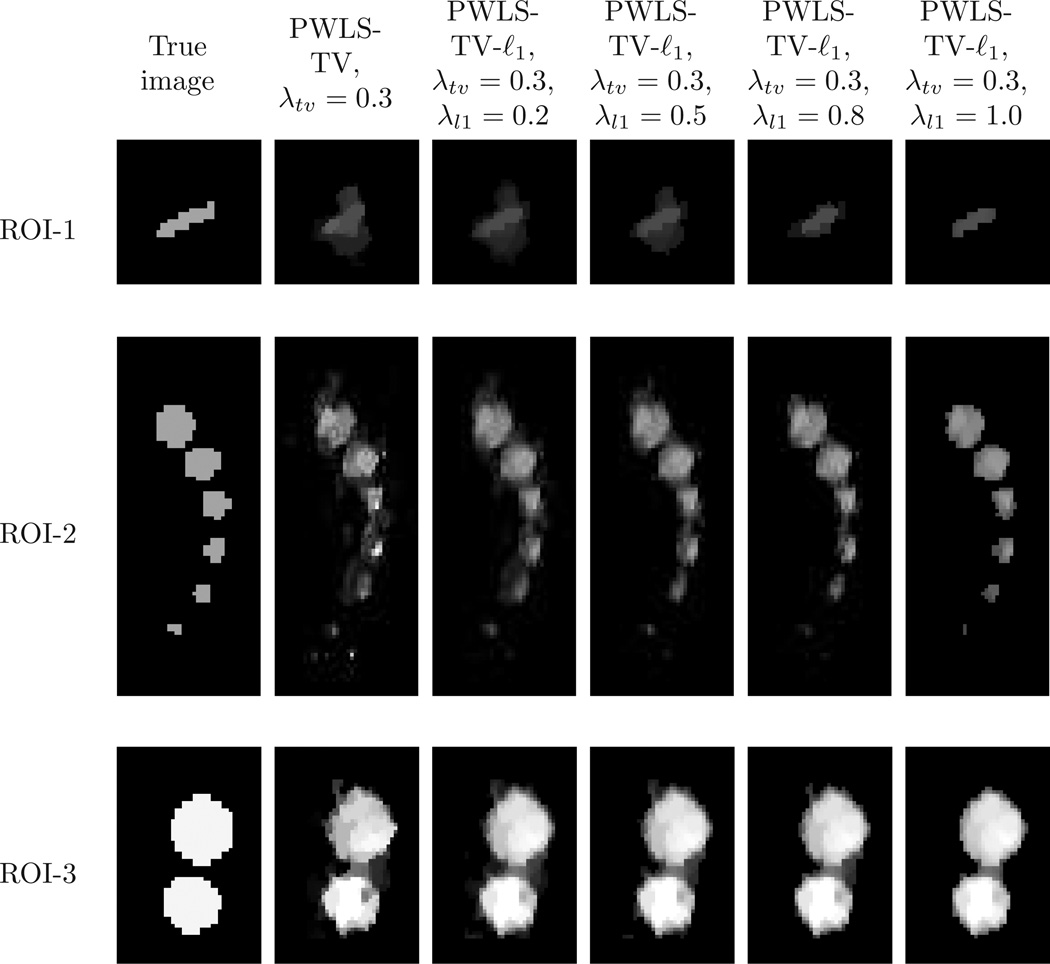
Note that the images in Figs. 4(g) and (h) reconstructed by use of the PWLS-TV method contain a noise contribution that is comprised of isolated pixels having large values. This noise can be effectively suppressed by use of the PWLS-TV-ℓ1 reconstruction method. Figures 4(i)–(l) display the images reconstructed by use of the PWLS-TV-ℓ1 method, where the value of λtv was fixed and the value of λl1 was increased from left to right. To more clearly see the effects of including the ℓ1 regularization term, zoomed-in ROIs of Fig. 4(h) and Figs. 4(i)–(l). are shown in Fig. 5. The first column of images shows the ROIs from the true phantom. The second column shows ROIs from the image in Fig. 4(h) that reconstructed by use of the PWLS-TV method. The remaining columns show ROIs from the images in Figs. 4(i)–(l) that reconstructed by use of the PWLS-TV-ℓ1 method. As the value of λl1 is increased, the ROI-I images become more sharp and compact due to the ℓ1 sparsity constraint. The ROI-2 and ROI-3 images also display the same tendency.
Figure 5.
Three zoomed-in ROIs of true phantom and corresponding reconstructed images from Fig. 4. Each column was obtained from the oringial phantom or one particular reconstructed image, which is indicated by the name shown in first row. All images were displayed in the same grey-scale window.
3.1.3. SSIM comparison between PWLS-TV and PWLS-TV-ℓ1
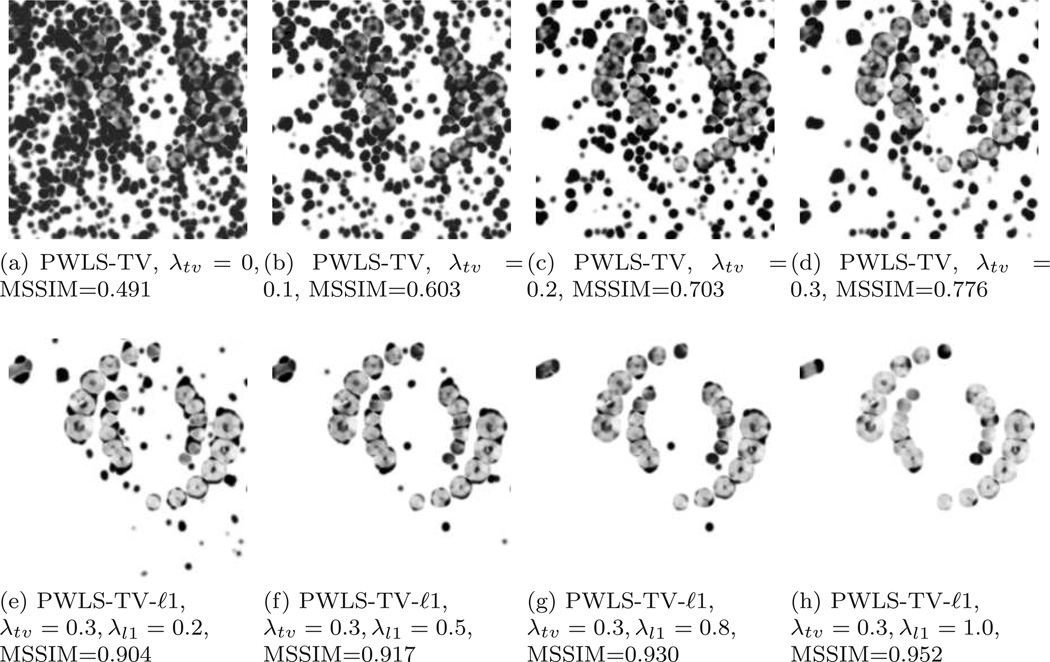
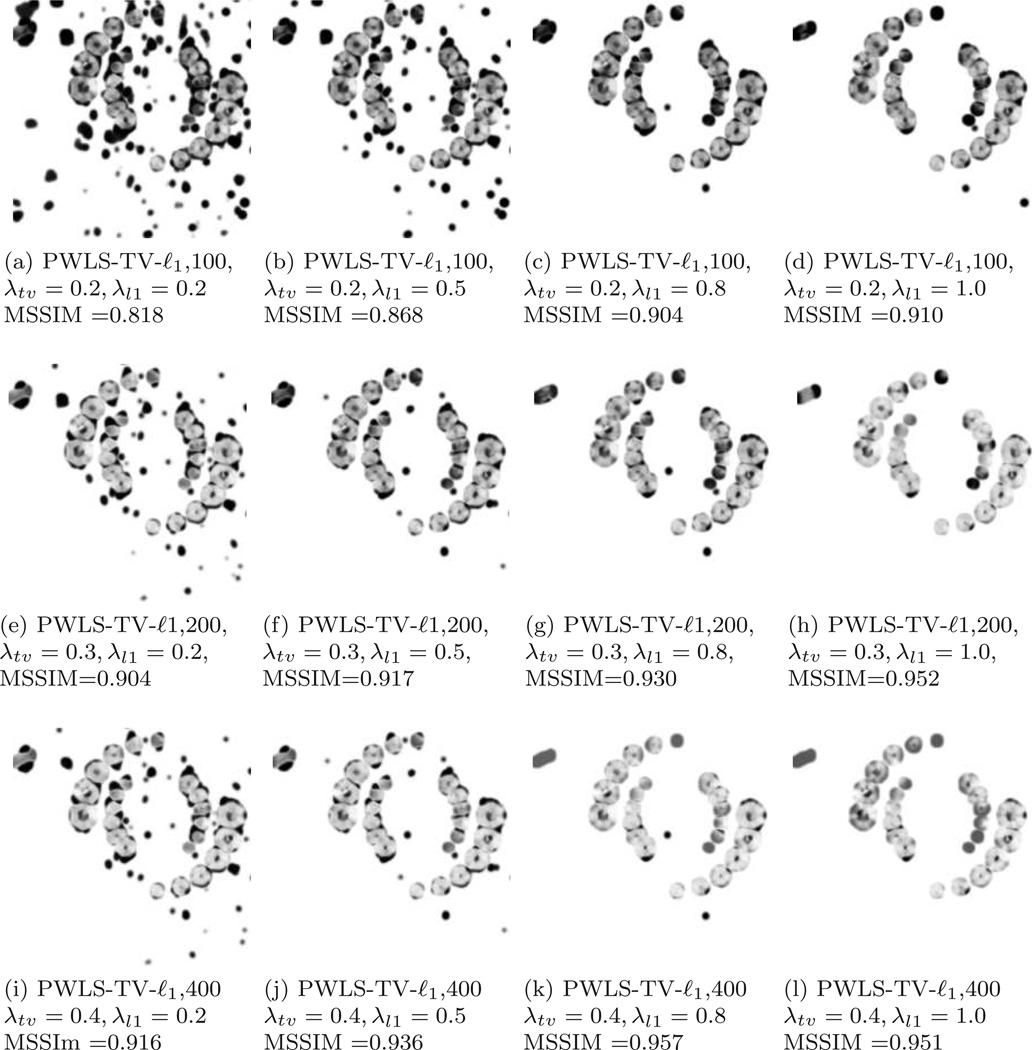
In order to quantitatively measure the difference between reconstructed PWLS-TV and PWLS-TV-ℓ1 images, the SSIM images and MSSIM values corresponding to the images in Fig. 4 (e–l) are displayed in Fig. 6. The MSSIMvalues corresponding to the PWLS-TV-ℓ1 method are higher than those corresponding to the PWLS-TV method. Moreover, the backgrounds of the SSIM images are much more uniform and have a majority of pixel values close to one; this reflects the fact that the PWLS-TV-ℓ1 method was able to remove the isolated noisy pixels that were produced by the PWLS-TV method These quantitative results are consistent with the qualitative observations described above.
Figure 6.
SSIM images and MSSIM values corresponding to the images in Fig.4 (e)–(h) reconstructed by use of the PWLS-TV method are shown in subfigures (a)–(d), respectively. SSIM images and MSSIM values corresponding to the images in Fig.4 (i)–(l) reconstructed by use of the PWLS-TV-ℓ1 method are shown in subfigures (e)–(h), respectively. All images are displayed in the same window [0 1].
3.1.4. Different number of views results for FBP and proposed PWLS-TV-ℓ1
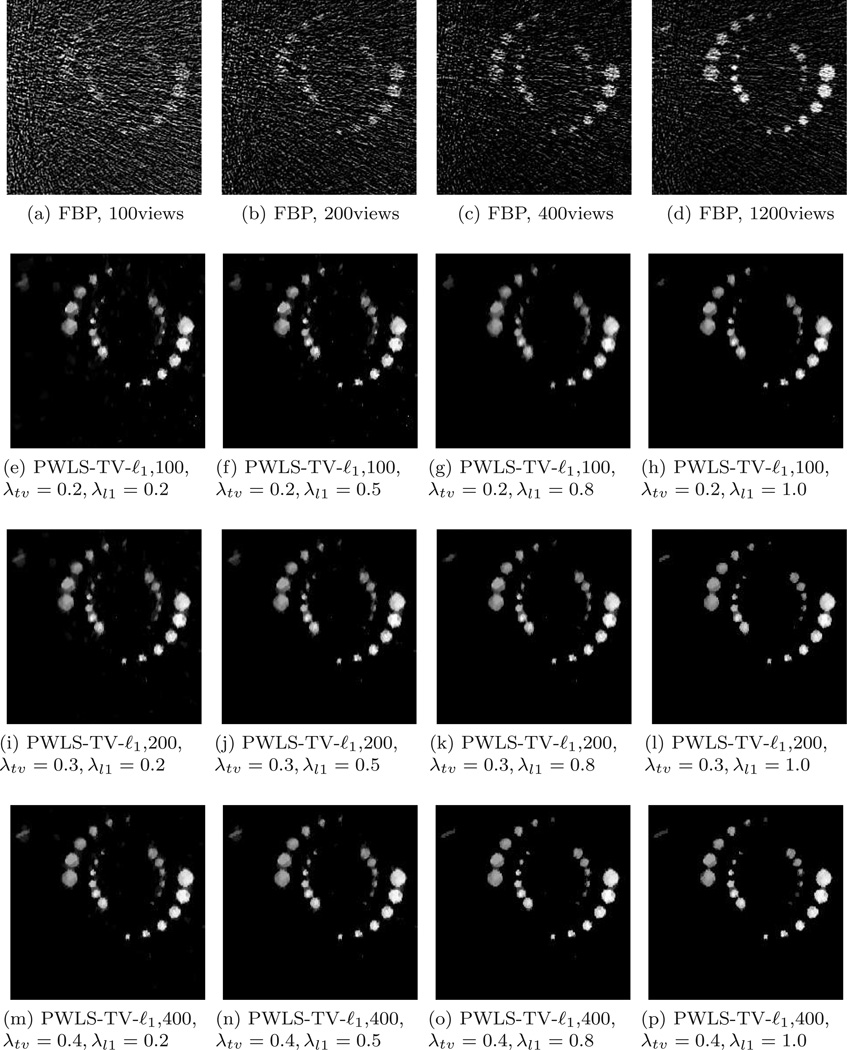
The performance of the PWLS-TV-ℓ1 method was compared to that of the filtered backprojection (FBP) algorithm. Images reconstructed by use of the FBP algorithm by use of 100, 200, 400 and 1200 views (full-view) are shown in Fig. 7(a)–(d). Images reconstructed by use of the PWLS-TV-ℓ1 method, corresponding to different regularization parameters, from 100, 200 and 400 views are shown in Figs. 7(e)–(h), (i)–(l) and Figs. 7(m)–(p). As expected, the images reconstructed by use of the FBP algorithm contain significantly elevanted noise levels. The structures in the 100-view FBP image are difficult to identify due to the high noise levels in the image. Conversely, the performance of the PWLS-TV-ℓ1 method degraded much more slowly than the FBP algorithm as the number of tomographic views was reduced. Even in the few-view cases, the PWLS-TV-ℓ1 method produced images that possess relatively clean backgrounds.
Figure 7.
Examples of reconstructed K-edge images via FBP algorithm (a–d) and PWLS-TV-ℓ1 algorithm by use of 100 views (e–h), 200 views (i–l) and 400 views (m–p). All images are displayed in the same window.
SSIM images and MSSIM values corresponding to the PWLS-TV-ℓ1 images in Fig. 7 are displayed in Fig. 8. The SSIM images corresponding to the PWLS-TV-ℓ1 method possess a bright background with a majority of pixel values close to 1, indicating high similarity to the reference image, for all cases. The major difference between the SSIM images for three reduced-view cases is that the intensity values become slightly larger as the view number increases from 100 to 400. This reflects that reconstructed image bias is reduced as the number of view angles utilized is increased. The MSSIM values for the images confirm these findings.
Figure 8.
SSIM images and MSSIM values corresponding to the images in Fig.7 (e)–(h) reconstructed by use of the PWLS-TV-ℓ1 method with 100 views, are shown in subfigures (a)–(d); SSIM images and MSSIM values corresponding to the images in Fig.7 (i)–(l) reconstructed by use of the PWLS-TV-ℓ1 method with 200 views, are shown in subfigures (e)–(h); SSIM images and MSSIM values corresponding to the images in Fig.7 (m)–(p) reconstructed by use of the PWLS-TV-ℓ1 method with 400 views, are shown in subfigures (i)–(l). All images are displayed in the same window [0 1].
3.2. Phantom Experiment with Targeted Ytterbium-Nanoparticles
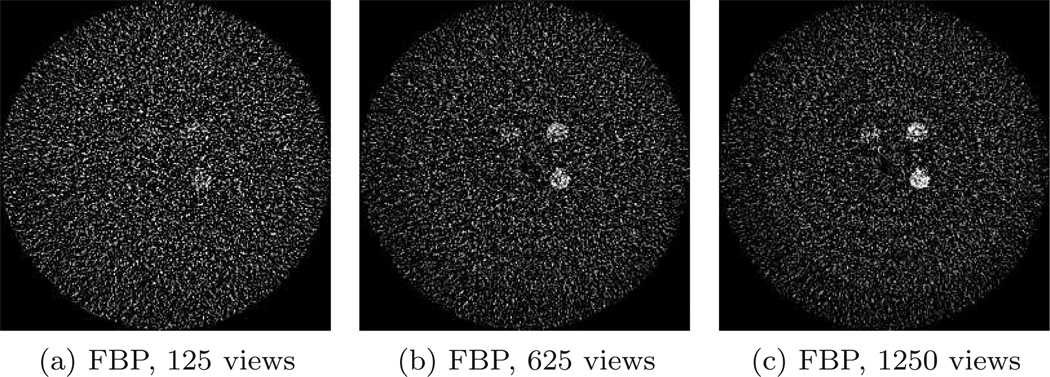
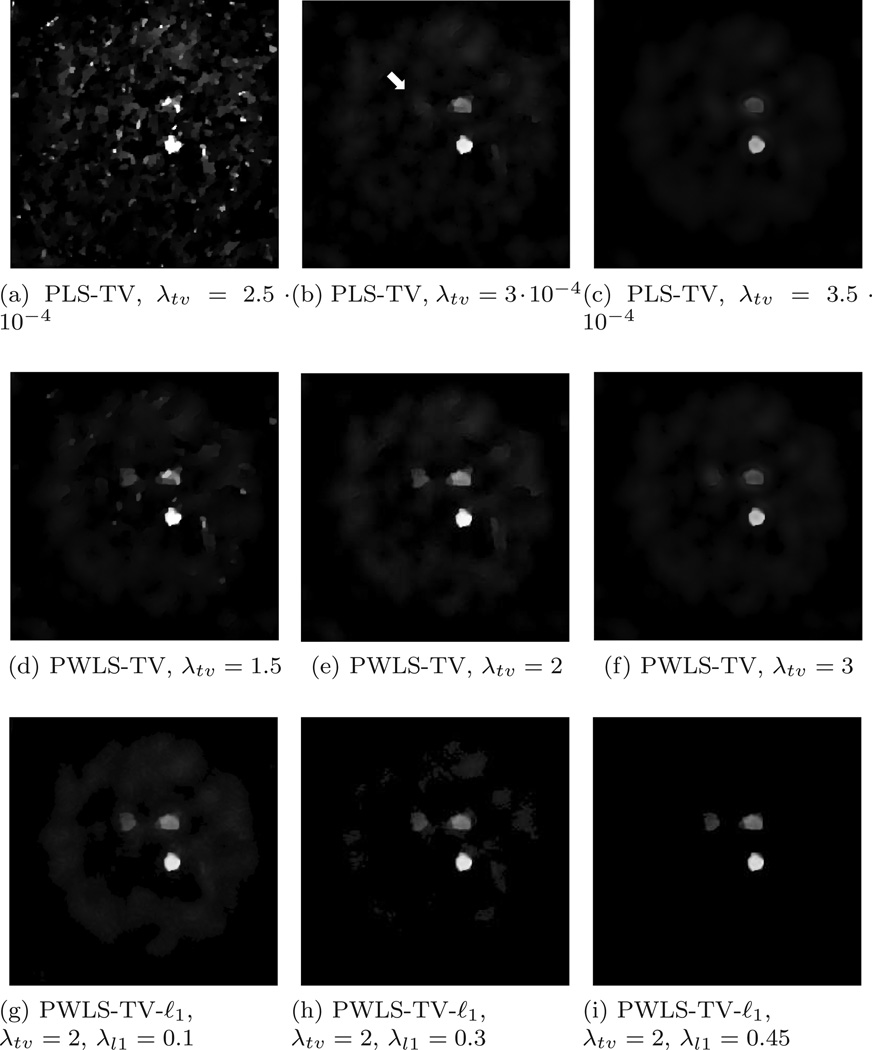
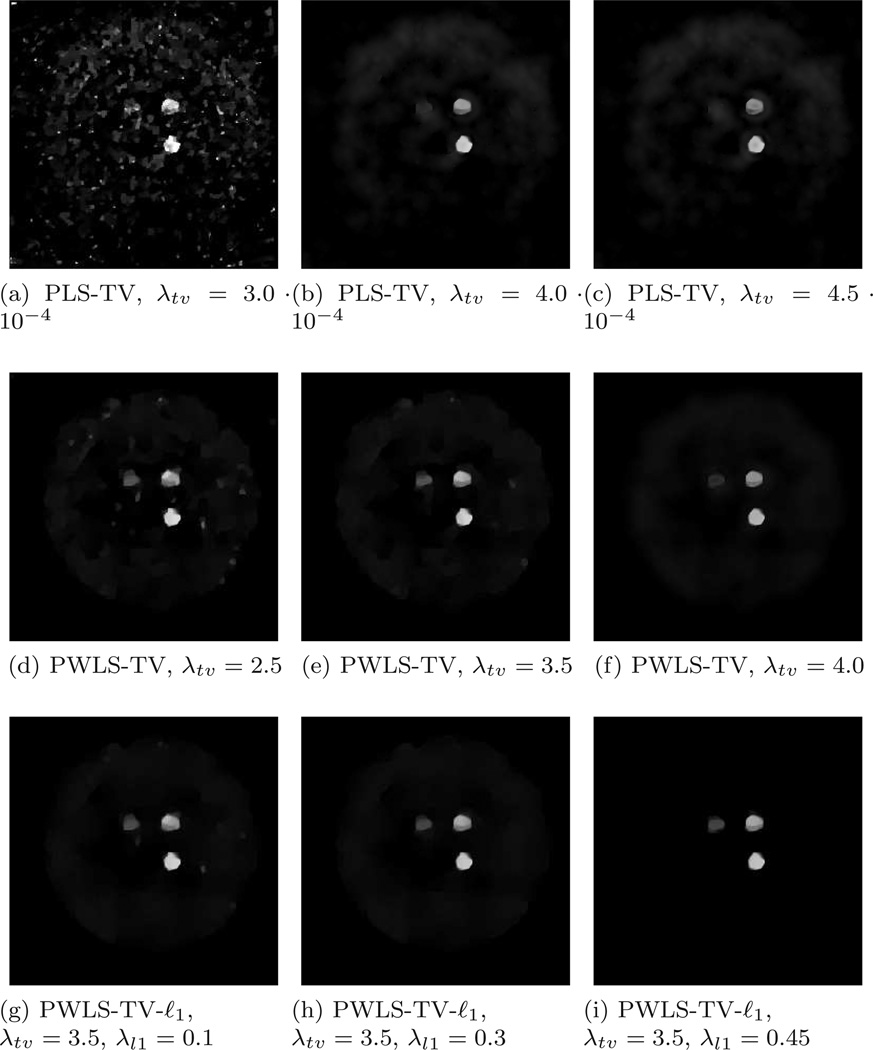
Images reconstructed by use of the FBP algorithm from the few-view experimental data sets are displayed in Fig. 9. As can be seen, it is difficult to visually identify the structures in the image reconstructed from 125 views. Even in the images reconstructed from 625 and 1250 views, the noise level appears high. The images reconstructed by use of the PLS-TV, PWLS-TV, and PWLS-TV-ℓ1 methods from 125 views and 625 views are displayed in Fig. 10 and Fig. 11, respectively. The 125-view results (Fig. 10) indicate that the use of the estimated variances increases conspicuity of the low-contrast ytterbium probe (Fig. 10(b)). In addition, the positive impact of TV-regularization can be readily observed. A comparison between Fig. 10(d–f) and (g–i) demonstrates that the additional ℓ1-norm regularization can suppress spurious background noise and preserves structural accuracy. Similar conclusions follow from the 625-view results (Fig. 11). Both the 125-view PWLS-TV-ℓ1 and 625-view PWLS-TV-ℓ1 images possess a relatively clean background and reveal the third low-contrast ytterbium probe.
Figure 9.
Physical Phantom Experiment: Reconstructed images of the K-edge material by use of FBP algorithm for 125, 625 and 1250 projection views, respectively. All images are displayed in the same grey-scale window.
Figure 10.
Physical Phantom Experiment: Reconstructed images of the K-edge material from 125 projection views. Image reconstructed by use of the PLS-TV method (a–c), PWLS-TV method (d–f), and PWLS-TV-ℓ1 method (g–i). The arrow in subfigure (b) indicates the tube containing the low-concentration, ytterbium dilution, which becomes more visible in the images estimated by use of the PWLS methods. All images are displayed in the same grey-scale window.
Figure 11.
Physical Phantom Experiment: Reconstructed images of the K-edge material from 625 projection views. Image reconstructed by use of the PLS-TV method (a–c), PWLS-TV method (d–f), and PWLS-TV-ℓ1 method (g–i). The arrow in subfigure (b) indicates the tube containing the low-concentration, ytterbium dilution, which becomes more visible in the images estimated by use of the PWLS methods. All images are displayed in the same grey-scale window.
4. Summary
We have proposed and investigated PWLS-TV and PWLS-TV-ℓl methods for reconstructing distributions of K-edge materials from reduced-view data in spectral CT. It was demonstrated that, by incorporating the variance information of the decomposed sinograms in the reconstruction method, the PWLS-TV method possessed a noise-to-spatial-resolution trade-off that was superior to a PLS-TV method that ignored the variance information. It was also demonstrated that, by promoting object sparsity in a wavelet transfrom domain, the PWLS-TV-ℓl method could improve the fidelity of small structures and remove isolated noises from images reconstructed from reduced-view datasets. This can be particularly useful for preclinical in-vivo applications of K-edge imaging, which are currently limited by long scan-times. It is worthwhile to mention that in this study, statistical correlations between decomposed sinograms were not exploited. However, this allows to reconstruct K-edge images individualy, which minimizes the computational burden and yields short computation times. The incorporation of the full covariance matrix in the reconstruction process can potentially reduce noise levels further but presents computationally challenges (Ramani & Fessler 2012) that are a topic of current investigation.
Acknowledgments
The authors thank Drs. Gregory Lanza and Dipanjan Pan, both with Washington University in St. Louis - School of Medicine, for their expertise and support with developing materials for the experimental study. MAA and QX were supported in part by award NIH EB009715.
Contributor Information
Mark A. Anastasio, Email: anastasio@seas.wustl.edu.
Carsten O. Schirra, Email: carsten.schirra@philips.com.
References
- Abudurexiti A, Kameda M, Sato E, Abderyim P, Enomoto T, Watanabe M, Hitomi K, Tanaka E, Mori H, Kawai T, Takahashi K, Sato S, Ogawa A, Onagawa J. Demonstration of iodine k-edge imaging by use of an energy-discrimination x-ray computed tomography system with a cadmium telluride detector. Radiological Physics and Technology. 2010;3:127–135. doi: 10.1007/s12194-010-0088-8. 10.1007/s12194-010-0088-8. [DOI] [PubMed] [Google Scholar]
- Beck A, Teboulle M. Fast gradient-based algorithms for constrained total variation image denoising and deblurring problems. IEEE Trans. Image Process. 2009;18(11):2419–2434. doi: 10.1109/TIP.2009.2028250. [DOI] [PubMed] [Google Scholar]
- Berger M, Hubbell J, Seltzer S, Chang J, Coursey J, Sukumar R, Zucker D, Olsen K. Xcom: Photon cross sections database. NIST Standard reference database. 1998;8:3587–3597. [Google Scholar]
- Bian J, Siewerdsen JH, Han X, Sidky EY, Prince JL, Pelizzari CA, Pan X. Evaluation of sparse-view reconstruction from flat-panel-detector cone-beam ct. Physics in Medicine and Biology. 2010;55(22):6575. doi: 10.1088/0031-9155/55/22/001. [DOI] [PMC free article] [PubMed] [Google Scholar]
- Carter Y. Improved compressed sensing-based algorithm for sparse-view ct image reconstruction. Computational and mathematical methods in medicine. 2013;2013 doi: 10.1155/2013/185750. [DOI] [PMC free article] [PubMed] [Google Scholar]
- Combettes P, Pesquet J. A proximal decomposition method for solving convex variational inverse problems. Inverse problems. 2008;24(6):065014. [Google Scholar]
- Cormode DP, Roessl E, Thran A, Skajaa T, Gordon RE, Schlomka J-P, Fuster V, Fisher EA, Mulder WJM, Proksa R, Fayad ZA. Atherosclerotic plaque composition: Analysis with multicolor CT and targeted gold nanoparticles. Radiology. 2010;256(3):774–782. doi: 10.1148/radiol.10092473. [DOI] [PMC free article] [PubMed] [Google Scholar]
- Cowan G. Statistical Data Analysis. Oxford University Press; 1998. [Google Scholar]
- Dutta J, Ahn S, Li C, Cherry SR, Leahy RM. Joint l1 and total variation regularization for fluorescence molecular tomography. Physics in medicine and biology. 2012;57(6):1459. doi: 10.1088/0031-9155/57/6/1459. [DOI] [PMC free article] [PubMed] [Google Scholar]
- Fessler JA. Mean and variance of implicitly defined biased estimators (such as penalized maximum likelihood): Applications to tomography. IEEE Trans. Image Process. 1996;5(3):493–506. doi: 10.1109/83.491322. [DOI] [PubMed] [Google Scholar]
- Fessler J, Elbakri I, Sukovic P, Clinthorne N. Maximum-likelihood dual-energy tomographicimage reconstruction. Proc. SPIE. 2002;4684:38–49. [Google Scholar]
- Feuerlein S, Roessl E, Proksa R, Martens G, Klass O, Jeltsch M, Rasche V, Brambs H-J, Hoffmann MHK, Schlomka J-P. Multienergy photon-counting K-edge imaging: Potential for improved luminal depiction in vascular imaging. Radiology. 2008;249(3):1010–1016. doi: 10.1148/radiol.2492080560. [DOI] [PubMed] [Google Scholar]
- Gao H, Yu H, Osher S, Wang G. Multi-energy ct based on a prior rank, intensity and sparsity model (prism) Inverse problems. 2011;27(11):115012. doi: 10.1088/0266-5611/27/11/115012. [DOI] [PMC free article] [PubMed] [Google Scholar]
- He P, Wei B, Cong W, Wang G. Optimization of k-edge imaging with spectral ct. Medical physics. 2012;39:6572. doi: 10.1118/1.4754587. [DOI] [PMC free article] [PubMed] [Google Scholar]
- Huang J, Zhang S, Metaxas D. Efficient mr image reconstruction for compressed mr imaging. Medical Image Analysis. 2011;15(5):670–679. doi: 10.1016/j.media.2011.06.001. [DOI] [PubMed] [Google Scholar]
- La Rivière PJ. Penalized-likelihood sinogram smoothing for low-dose ct. Medical physics. 2005;32:1676. doi: 10.1118/1.1915015. [DOI] [PubMed] [Google Scholar]
- Liu Y, Ai K, Liu J, Yuan Q, He Y, Lu L. A high-performance ytterbium-based nanoparticulate contrast agent for in vivo x-ray computed tomography imaging. Angewandte Chemie International Edition. 2012;51(6):1437–1442. doi: 10.1002/anie.201106686. [DOI] [PubMed] [Google Scholar]
- Lustig M, Donoho D, Pauly JM. Sparse mri: The application of compressed sensing for rapid mr imaging. Magnetic resonance in medicine. 2007;58(6):1182–1195. doi: 10.1002/mrm.21391. [DOI] [PubMed] [Google Scholar]
- Ma J. Total variation smoothed maximum penalized likelihood tomographic reconstruction with positivity constraints. Biomedical Imaging: From Nano to Macro, 2011 IEEE International Symposium on IEEE. 2011:1774–1777. [Google Scholar]
- Ma S, Yin W, Zhang Y, Chakraborty A. An efficient algorithm for compressed mr Sparsity Regularized Reconstruction of Decomposed K-Edge Data in Spectral CT 16 imaging using total variation and wavelets. Computer Vision and Pattern Recognition, 2008. CVPR 2008. IEEE Conference on, IEEE. 2008:1–8. [Google Scholar]
- Pan D, Roessl E, Schlomka J-P, Shelton DC, Senpan A, Scott MJ, Allen JS, Zhang H, Hu G, Gaffney PJ, Choi ET, Rasche V, Wickline SA, Proksa R, Lanza GM. Computed tomography in color: NanoK-enhanced spectral CT molecular imaging. Angew. Chem. Int. Ed. 2010;49(50):9635–9639. doi: 10.1002/anie.201005657. [DOI] [PMC free article] [PubMed] [Google Scholar]
- Pan D, Schirra CO, Senpan A, Schmieder AH, Stacy AJ, Roessl E, Thran A, Wickline SA, Proska R, Lanza GM. An early investigation of ytterbium nanocolloids for selective and quantitative ”multicolor” spectral ct imaging. ACS Nano. 2012;6(4):3364–3370. doi: 10.1021/nn300392x. [DOI] [PMC free article] [PubMed] [Google Scholar]
- Ramani S, Fessler JA. A splitting-based iterative algorithm for accelerated statistical x-ray CT reconstruction. IEEE Trans. Med. Imag. 2012;31(3):677–688. doi: 10.1109/TMI.2011.2175233. [DOI] [PMC free article] [PubMed] [Google Scholar]
- Roessl E, Brendel B, Engel K-J, Schlomka J-P, Thran A, Proksa R. Sensitivity of photon-counting based k-edge imaging in x-ray computed tomography. IEEE transactions on medical imaging. 2011;30(9):1678. doi: 10.1109/TMI.2011.2142188. [DOI] [PubMed] [Google Scholar]
- Roessl E, Herrmann C. Cramér–rao lower bound of basis image noise in multiple-energy x-ray imaging. Physics in medicine and biology. 2009a;54(5):1307. doi: 10.1088/0031-9155/54/5/014. [DOI] [PubMed] [Google Scholar]
- Roessl E, Herrmann C. Cramér-Rao lower bound of basis image noise in multiple-energy x-ray imaging. Phys. Med. Biol. 2009b;54(5):1307–1318. doi: 10.1088/0031-9155/54/5/014. [DOI] [PubMed] [Google Scholar]
- Roessl E, Proksa R. K-edge imaging in x-ray computed tomography using multi-bin photon counting detectors. Phys. Med. Biol. 2007;52(15):4679–4696. doi: 10.1088/0031-9155/52/15/020. [DOI] [PubMed] [Google Scholar]
- Sauer KD, Bouman CA. A local update strategy for iterative reconstruction from projections. IEEE Trans. Signal Processing. 1993;41(2):534–548. [Google Scholar]
- Schirra CO, Roessl E, Koehler T, Brendel B, Thran A, Proksa R. Maximum likelihood CT reconstruction form material-decomposed sinograms using fisher information. 2011 IEEE Nuclear Science Symposium Conference Record. 2011:4063–4065. [Google Scholar]
- Schirra C, Roessl E, Koehler T, Brendel B, Thran A, Pan D, Anastasio M, Proksa R. Statistical reconstruction of material decomposed data in spectral ct. IEEE transactions on medical imaging. 2013 doi: 10.1109/TMI.2013.2250991. [DOI] [PubMed] [Google Scholar]
- Schlomka JP, Roessl E, Dorscheid R, Dill S, Martens G, Istel T, Bumer C, Herrmann C, Steadman R, Zeitler G, Livne A, Proksa R. Experimental feasibility of multi-energy photon-counting K-edge imaging in pre-clinical computed tomography. Physics in Medicine and Biology. 2008;53(15):4031–4047. doi: 10.1088/0031-9155/53/15/002. [DOI] [PubMed] [Google Scholar]
- Sidky EY, Pan X. Image reconstruction in circular cone-beam computed tomography by constrained, total-variation minimization. Physics in medicine and biology. 2008;53(17):4777. doi: 10.1088/0031-9155/53/17/021. [DOI] [PMC free article] [PubMed] [Google Scholar]
- Thibault J-B, Sauer KD, Bouman CA, Hsieh J. A three-dimensional statistical approach to improved image quality for multislice helical CT. Med. Phys. 2007;34(11):4526–4544. doi: 10.1118/1.2789499. [DOI] [PubMed] [Google Scholar]
- Wang Z, Bovik AC, Sheikh HR, Simoncelli EP. Image quality assessment: From error visibility to structural similarity. IEEE Trans. Image Processing. 2004;13(4):600–612. doi: 10.1109/tip.2003.819861. [DOI] [PubMed] [Google Scholar]
- Xu Q, Sidky EY, Pan X, Stampanoni M, Modregger P, Anastasio MA. Investigation of discrete imaging models and iterative image reconstruction in differential x-ray phase-contrast tomography. Optics express. 2012;20(10):10724. doi: 10.1364/OE.20.010724. [DOI] [PMC free article] [PubMed] [Google Scholar]
- Xu Q, Yang D, Tan J, Anastasio M. Su-f-brcd-09: Total variation (tv) based fast convergent iterative cbct reconstruction with gpu acceleration. Medical physics. 2012;39(6):3857. doi: 10.1118/1.4735747. [DOI] [PubMed] [Google Scholar]
- Yang W, Wang J, Guo J. A novel algorithm for satellite images fusion based on compressed sensing and pca. Mathematical Problems in Engineering. 2013;2013 [Google Scholar]
- Zhang R, Thibault J-B, Bouman CA, Sauer KD, Hsieh J. A model-based iterative algorithm for dual-energy x-ray CT reconstruction; Proceedings of the 2nd International Conference on Image Formation in X-Ray Computed Tomography; 2012. pp. 439–443. [Google Scholar]


