Abstract
We experimentally demonstrate a 20-fold improvement in acquisition time in projection reconstruction (PR) magnetic particle imaging (MPI) relative to the state-of-the-art PR MPI imaging results. We achieve this acceleration in our imaging system by introducing an additional Helmholtz electromagnet pair, which creates a slow shift (focus) field. Because of magnetostimulation limits in humans, we show that scan time with three-dimensional (3D) PR MPI is theoretically within the same order of magnitude as 3D MPI with a field free point; however, PR MPI has an order of magnitude signal-to-noise ratio gain.
Keywords: field free line, magnetic particle imaging, projection reconstruction
Introduction
Magnetic particle imaging (MPI) directly detects magnetic nanoparticle tracers deep in tissue with ideal contrast for diagnostic and interventional imaging procedures [9]. Such procedures could include angiography, cancer imaging, stem cell tracking, and biomarker imaging [2, 3, 34, 38]. The optimal MPI hardware configuration to enable these applications remains an open question. There are several proposed modes of MPI scanning, including three-dimensional (3D) field free point (FFP) scanning [9, 11, 12, 13, 15, 37, 41], single-sided systems [36], 2D projection MPI (akin to X-ray) with a field free line (FFL) magnet [14, 22, 26], and 3D FFL MPI [5, 21, 23, 25, 40]. However, the tradeoffs between these distinct scanning modes of MPI have not been explored yet. Hence, it remains to be seen which mode will be ideal for a particular imaging application, such as angiography, cancer imaging, or inflammation imaging.
MPI forms images of magnetic nanoparticle concentrations by detecting the non-linear magnetic response of a nanoparticle to applied magnetic fields. The key concept that underlies MPI is that a strong magnetic field gradient, known as a selection field, saturates magnetic nanoparticles at all locations except at the “field free” region of an FFP or FFL [9, 40]. An FFP selects a single point, while an FFL selects a line in space. To produce a signal, an excitation electromagnet creates a rapidly time-varying homogenous magnetic field, known as a drive field, that rapidly moves the FFP or FFL. When the FFP or FFL passes over a magnetic nanoparticle, the nanoparticle magnetization changes in a non-linear manner and induces a signal in a receiver coil. Unfortunately, the spatial region that the FFP or FFL can move using only the drive field is limited by magnetostimulation limits [35]. To enable scanning large regions of interest, we add slowly varying homogenous magnetic fields [12, 37], sometimes called focus fields.
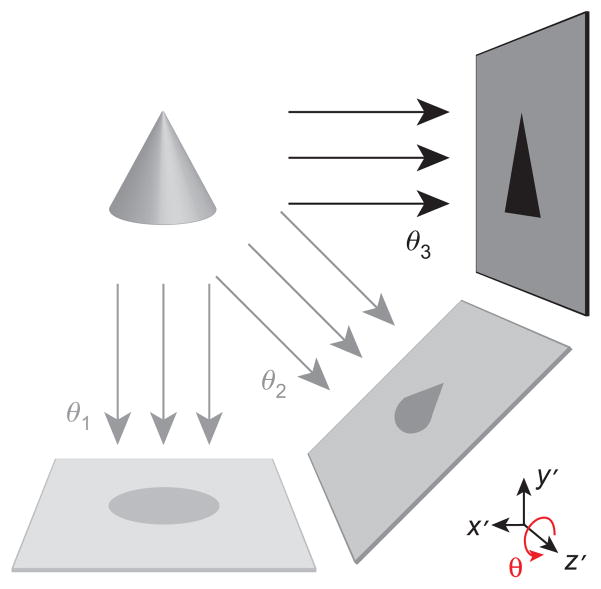
In previous work, we presented the first experimental 3D images with an FFL using our first-generation projection reconstruction (PR) MPI imager [24, 25]. The relationship between 2D projection imaging and 3D PR imaging with an FFL is analogous to the relationship between X-ray imaging and computed tomography (CT). As described schematically in Figure 1, our 3D PR MPI imager acquires “parallel-beam” projection images at various angles, while the nanoparticle sample (or equivalently the magnet) is rotated around the z-axis. Subsequently, a filtered backprojection (FBP) algorithm reconstructs 3D images of the nanoparticle distribution. Our first-generation 3D PR imager used slow mechanical movement in two dimensions: a z-axis translation stage (down the bore) and a motor-driven rotary table to allow rotated projections. The mechanical inertia of these stages severely limited the imaging speed of the system. Consequently, the fastest previously reported acquisition of a mouse-sized (6 cm ×12 cm) tomographic image required approximately 39 min.
Figure 1. Rapid 3D imaging sequence in the sample coordinate system (x′, y′, z′).
Multiple 2D projection images are acquired with electronic translation of the FFL. These images are taken sequentially at various angles (θ1, θ2, …, θN) using mechanical rotation of the sample around the z-axis with a rotary stage. Accelerated imaging via FFL motion with time-varying slow shift magnetic fields enables acquisition of rapid tomographic 3D images in < 2 min across a relatively large FOV.
In this work, we begin with both theory and experimental evidence that demonstrate advantages of 3D PR for human applications. In short, PR MPI has an order of magnitude signal-to-noise ratio (SNR) boost and is not significantly slower than 3D point scanning when human safety limits are imposed. We then demonstrate rapid PR MPI by implementing hardware changes to our current system and developing a fast PR MPI pulse sequence. The hardware was modified to enable slow movement of the FFL along the z-axis by introducing a pair of slow shift (or focus field) electromagnets in addition to the existing translation stage. We also designed and implemented the necessary amplifiers, filters, controllers, and software to drive the z shift coils and reconstruct images using them. To allow faster imaging, we improved the x slow shift electromagnet power matching. The receive coil has been redesigned and fabricated to extend the sensitive region from 7 to 10 cm. We then developed a PR MPI pulse sequence to drive the updated hardware. In this modified setup, the imaging speed is limited by the amplifier output voltage limits and the inductance of the slow field shift electromagnets. With these changes, the system acquires a full 3D image in < 2 min, demonstrating a 20-fold speed improvement over our previous mechanically limited imaging system [25].
Theory
Signal-to-noise ratio of PR MPI
It is well known [30, 31] that CT and magnetic resonance imaging (MRI) typically have a SNR advantage over point scanning methods (like ultrasound imaging), where N is the number of projections or the number of frequency space (k-space) samples acquired. 3D MPI with an FFP is fundamentally a point scanning technique; thus, the SNR of one pixel does not increase with the number of pixels scanned. The concept of an FFL was introduced in MPI to take advantage of an SNR gain created due to averaging when each imaging location is acquired multiple times via a shifted and rotated FFL [40]. While imaging times are similar, the resulting SNR of a 3D PR image is an order of magnitude higher than a 3D FFP image.
The major tradeoff with PR and frequency space (k-space) scanning methods as opposed to point scanning methods is the need to avoid spatial aliasing. In 3D FFP scanning, we can simply scan a subject with no fear of aliasing from outside the selected region. This is not the case with 3D PR, as aliasing can appear in the resulting image due to undersampling. Fortunately, it is well known that we can prevent aliasing simply by ensuring that the number of projections adheres to the Nyquist sampling rate:
| (1) |
where N is the number of projections, FOVx,y is the maximum FOV in the xy plane, and Kmax is the maximum radial spatial frequency of the system [25].
Contrasting a PR MPI system and a 3D FFP system with identical noise characteristics, scan time, resolution, pulse sequence, and selection field gradient strength, the SNR relationship can be described as
| (2) |
where C depends on the interpolation and filtering used during FBP (see Appendix 1). We have measured a C of ~0.4 experimentally, and we have seen a C value of 1.1 in theory and simulation. In addition, as we describe next, this SNR improvement comes with a scan time that is in the same order of magnitude as that of a 3D FFP system.
MPI imaging time
Intuitively, we note that the imaging time for 3D PR imaging and 3D FFP imaging will be equal when the number of projections acquired is equal to the number of slices in the 3D image volume. This is because each slice in 3D FFP MPI and each 2D projection in 3D PR MPI require the same acquisition time assuming planar FFP acquisition trajectories.
More rigorously, we can calculate imaging time for MPI systems based on magnetostimulation limits as discussed in Appendix 2:
| (3) |
| (4) |
| (5) |
where T2D [s] is the 2D projection or single-slice MPI imaging time, T3D,ffp [s] is the 3D imaging time with an FFP, and T3D,pr [s] is the 3D PR imaging time with an FFL. FOVi [m] is the size of the FOV along axis i, μ0Gab [T/m] is the partial derivative of the magnetic field in direction a with respect to direction b, Bth is the drive field peak amplitude determined by magnetostimulation thresholds [35], Smax = 20 T/s is the maximum slew rate as defined by the ICNIRP [18], Δx [m] is the native (i.e., no deconvolution) full-width-at-half-maximum resolution, and β is a factor ( > 1) determining the overlap extent of the pFOVs required for baseline recovery [28]. Ns is the number of slices in 3D FFP imaging, and N is the number of projections acquired in 3D PR imaging.
Using the above equations, we calculate the imaging times for a number of gradient strengths. As one of the first human applications for MPI may be angiography in the heart or the brain, we assume a (10 cm)3 FOV. This FOV would be a reasonable (minimal) FOV for both anatomical regions. A 1-mm native (i.e., no deconvolution) resolution using Resovist tracer (with a 17-nm effective mean core diameter) requires a 10 T/m magnetic field gradient in x, y, and z [11, 12, 32]. Our calculations use a theoretical isotropic gradient for the FFP system to allow a direct imaging time comparison with FFL systems. We assume the fastest case of no pFOV overlap during scanning (i.e., β = 1), and a maximum amplitude drive field strength of 7 mT in the human heart [35]. With the above parameters, the total imaging time can be estimated as T2D≈3.6 s for a single slice and T3D,ffp≈260 s for the entire volume. In Table 1, we compare these imaging times with those of decreased gradient strengths. As seen in this table, the scan time increases as the square (2D imaging) or the cube (3D imaging) of improving image resolution. This tradeoff is similar to the scan time versus system resolution tradeoff in MRI.
Table 1.
MPI scan time comparison.
| Isotropic gradient strength | Native image resolution (Resovist tracer) | T2D for 2D projection (FFL) or single slice (FFP) (10 cm)2 | T3D,ffp for 3D image (FFP) (10 cm)3 | T3D,pr for 3D projection recon image (FFL) (10 cm)3 |
|---|---|---|---|---|
| 10 T/m | 1 mm | 3.6 s | 260 s | 560 s |
| 5 T/m | 2 mm | 0.89 s | 32 s | 70 s |
| 2.5 T/m | 4 mm | 0.22 s | 4.0 s | 8.8 s |
| 1.25 T/m | 8 mm | 0.06 s | 0.50 s | 1.1 s |
Best case imaging times [no partial field of view (pFOV) overlap] for slow field shift limited imaging using the International Commission on Non-Ionizing Radiation Protection (ICNIRP) limits of Smax = 20 T/s when imaging the human torso with a drive field amplitude of Bth = 7 mT (see Appendix 2), and Resovist tracer. We assume a (10 cm)3 FOV, which would be a reasonable FOV for imaging the human heart. Note that the SNR of a 3D PR image is nearly an order of magnitude better than a 3D image taken using an FFP imager.
In Table 1, we also compare imaging times of 3D PR systems with an FFL. At a native resolution of Δ x = 1 mm, we calculate . Thus, for 1 mm resolution and a (10 cm)3 FOV, we must acquire at least 158 projections to avoid aliasing. With T2D≈3.6 s for a single projection, the total imaging time is T3D,pr≈560 s. The imaging times for decreased gradient strength cases are calculated similarly, and are listed in Table 1. We see that the imaging times for 3D PR are within the same order of magnitude of the 3D FFP imager.
Methods
In this section, we describe a technique to rapidly acquire large 3D FOVs using PR with sample rotation. The imaging speed of this experimental setup is limited only by the magnetic field slew rates of the system. This technique is general and can be extended to acquire images in human subjects, such that the imaging speed is limited only by human magnetostimulation limits.
3D projection reconstruction pulse sequence
We designed and implemented an imaging sequence for PR MPI that can be easily scaled to a magnetostimulation-limited sequence for human MPI imaging. This sequence has been modified from our previous work, which used no z slow shift movement and instead relied solely on z mechanical translation [24, 25]. Mechanical translation hindered imaging speed due to inertia and maximum velocity limits of the translation stages. Here, we augmented our system to use z slow shift (focus) fields. The difference in imaging speed between the two techniques is dramatic; electronic translation reduces imaging times by over an order of magnitude. This improved technique is analogous to cone-beam CT, where the FOV is rapidly imaged in a projection format while the sample (or equivalently the magnet) is rotated slowly to acquire the necessary projections for a full 3D image.
Figure 1 shows a schematic overview of the imaging sequence. Two-dimensional projection images can be produced using solely magnetic translation of the FFL with x and z slow shift fields and a z drive field. The 2D FOV can be optionally extended along z using the translation stage. Following each 2D projection, the sample (or equivalently the magnet) is rotated using a mechanical rotation stage. The rotation time is small compared with the projection imaging time; implementing continuous rotation would improve imaging time by < 10% with our current experimental system.
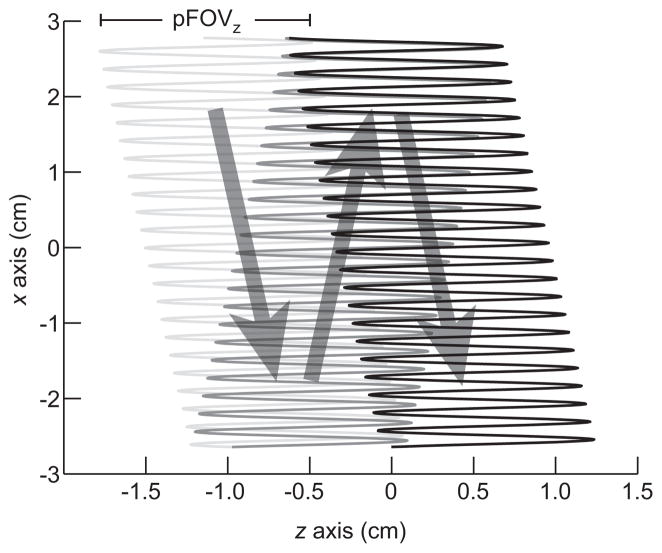
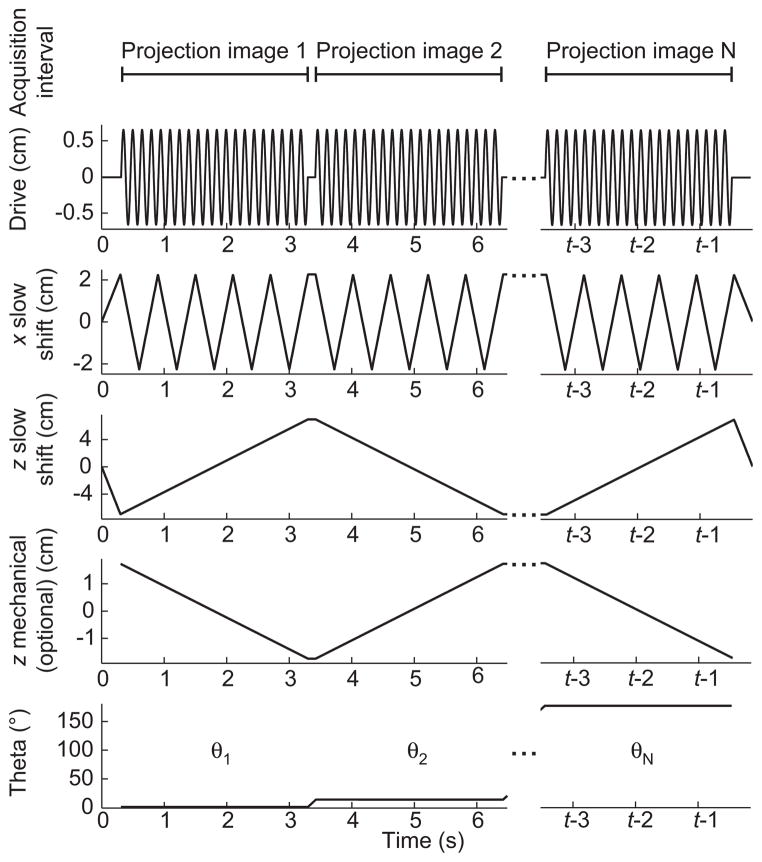
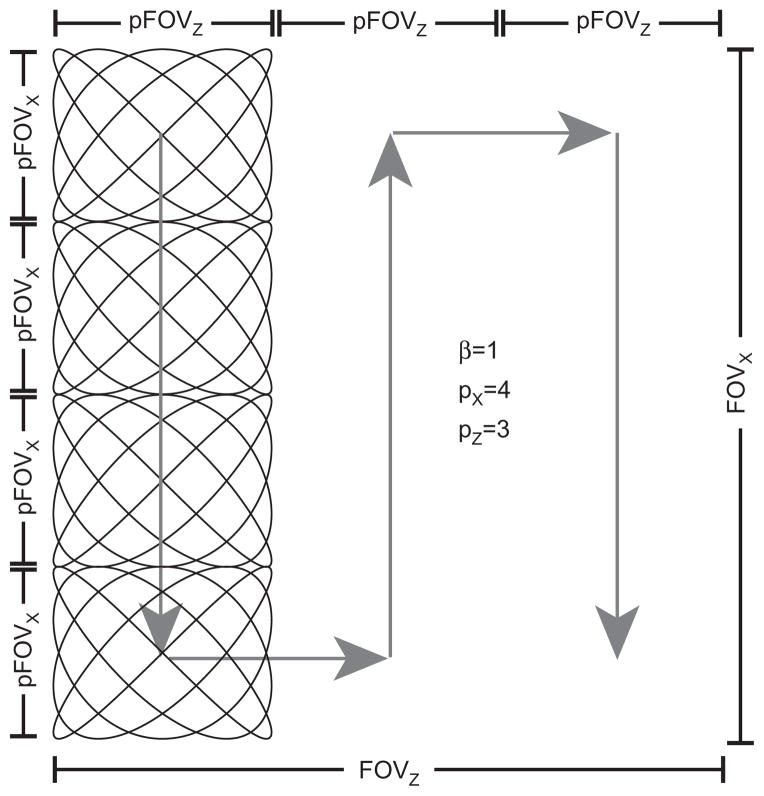
Figure 2 illustrates the FFL trajectory of each 2D projection. Figure 3 shows FFL trajectory waveforms that comprise the imaging sequence to produce this trajectory. We apply three simultaneous time-varying magnetic waveforms. The first, a sinusoidal drive field, rapidly scans the FFL in the z-axis. The drive field elicits the MPI signal. The triangular waveforms are slowly varying magnetic fields that move the mean position of the FFL along x and z. These slow shift fields allow coverage of the full imaging FOV. The optional z mechanical translation is used to extend the FOV along z. The final waveform in Figure 3 shows the angular control of the motor-driven rotary table.
Figure 2. Imaging FFL trajectory for a single 2D projection scan.
Each projection image is produced through the application of slowly varying fields in x and z (in scanner coordinates), and a rapidly varying drive field in z. The signal is received only along the z-axis. 2D projection imaging does not require mechanical movement of the sample; however, the FOV can be optionally extended in the z-direction with a translation stage. Here, a sparse trajectory is shown for illustration purposes, while the actual scanning trajectory is considerably denser.
Figure 3. Imaging pulse sequence for electronic FFL movement (drive field in z, slow shift in x and z), mechanical rotation (θ), and mechanical z FOV extension.
We simultaneously apply slowly time-varying currents in z and x to raster the FFL to produce a 2D projection image at each angle θ. The MPI signal is received continuously for each projection image. For images acquired in this work, the total acquisition time was 1.3 or 2.1 min with 40 projections.
In our experimental imaging system, the imaging speed is limited by the current and voltage slew rates of the driving amplifiers. In a human-sized system, on the other hand, the imaging speed would be subject to the human safety thresholds for the three magnetic fields (one drive and two slow shift). Because magnetostimulation thresholds are expected to increase with decreasing diameter of the sample, we currently operate well below the magnetostimulation thresholds for small, mouse-sized samples.
Exciting the sample with a more complex drive field (e.g., Lissajous sequence) would improve the overall resolution of the system [12]; however, it would not dramatically change the imaging time of each projection. The imaging time is limited by the ability of the slow shift electromagnets to move the FFL across the full FOV for a human subject.
PR MPI imaging system
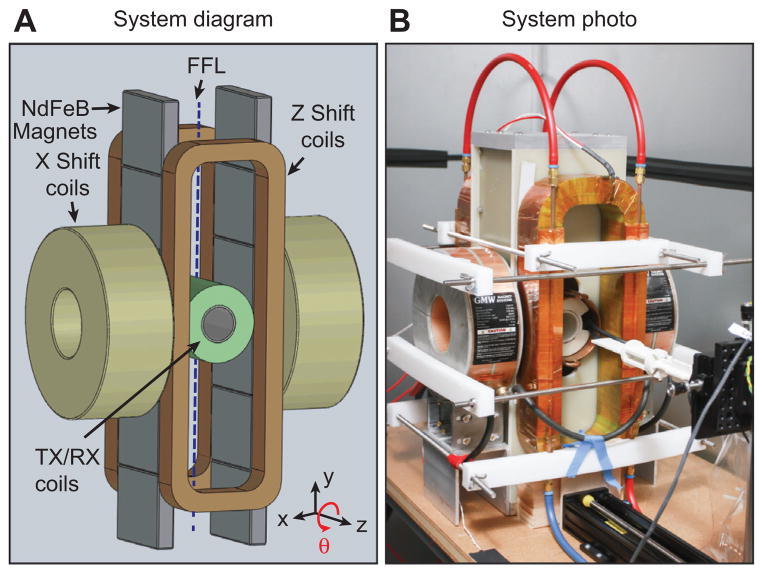
Our PR imaging system, shown in Figure 4, contains an FFL constructed from permanent magnets, electromagnets for slowly shifting the FFL, a drive coil, and a receiver coil. The FFL permanent magnets were assembled from 12 NdFeB permanent magnet sections, where we created two large opposing permanent magnet assemblies, each containing six laterally stacked magnet sections with the same magnetization orientation. This created an FFL with a 2.3 T/m selection field gradient along the x- and z-axes, with the FFL oriented along the y-axis.
Figure 4. System diagram and photo of the FFL scanner for 3D PR MPI.
Two large opposing permanent magnet assemblies, each containing six laterally stacked magnet sections, create an FFL with a 2.3 T/m selection field gradient along the x- and z-axes, with the FFL oriented along the y-axis. Slow shift coils along the z-direction electronically shift the FFL to increase imaging speed 20-fold.
To slowly shift the FFL, we designed our system with two x-direction electromagnets (GMW 11901111, San Carlos, CA, USA) and two custom-manufactured z-direction electromagnets. We operated these electromagnets with two switching amplifiers (Copley Controls 234). For fast translation of the FFL, a linear amplifier (AE Techron 7224 or LVC5050) drove a resonant custom-built solenoidal drive coil at 23 kHz, through a high-power passive band-pass filter. For signal reception, we wound a receiver coil in a gradiometer configuration to cancel magnetic feedthrough from the drive coil while preserving particle signals. After the receiver coil, the receive chain consisted of a passive 23-kHz notch filter, low-noise preamplifiers (SR560 and SIM911), a 500-kHz low-pass filter (SIM965), and a 40-kHz high-pass filter (SIM965). Custom software (Mathworks Matlab, Natick, MA, USA) operates the entire system through two data acquisition cards (NI PCIe-6363, Austin, TX, USA). A one-axis translation stage with a rotation stage (Velmex, Bloomfield, NY, USA) was used to position the sample in the imaging bore and to rotate the sample during PR imaging.
Image acquisition and PR
Figure 3 illustrates, in a simplified manner, the actual pulse sequence used for PR images acquired in the present work. Images acquired in Figure 5 used a pulse sequence with the following parameters. For each projection, we created an oscillating drive field at 23 kHz with a 15 mT amplitude, which produced a 1.3 cm z partial FOV in this system. A slow shift field along the x-direction, operated using a 15.6 Hz, 69 mT triangle wave, covered an FOV of 6 cm along the x-direction. Along the z-direction, the slow shift field was a linear ramp with an 85 mT peak amplitude, which covered a 7.5 cm FOV in 1.8 s. The z translation stage extended the FOV by 1.6 cm (in 1.8 s). The drive field, z slow shift fields, and stage movement summed to produce a total FOV of 10.4 cm along the z-direction. Each image required 40 x-axis traversals to cover the entire 2D projection FOV. Using this sequence, we acquired 40 projection images at equally spaced angles to span 180 degrees. The entire imaging sequence duration was 1.3 min. The final imaging FOV was a 6 cm × 6 cm × 10.4 cm cylindrical 3D volume.
Figure 5. Helical tubing phantom with maximum intensity projection (MIP) and volume-rendered (VR) PR MPI images was created to compare a slow-moving table scan with 20× faster scanning using shift fields.
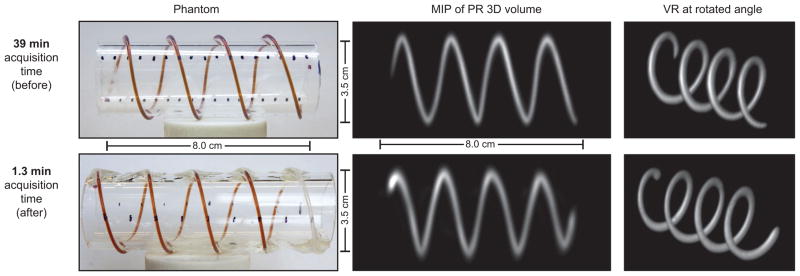
We created a helical phantom by wrapping two pieces of 0.8 mm internal diameter (ID), 1.4 mm outer diameter (OD) tubing around an acrylic cylinder. We injected 50 mm Resovist (9:1 deionized water and Resovist). We imaged the phantom using the pulse sequence described in Figure 3. The resulting dataset was maximum intensity projected and volume rendered in Osirix to produce the displayed 3D images. Top: total acquisition time: 39 min; FOV: 6 cm ×6 cm ×12 cm; 60 projections. Bottom: total imaging time: 1.3 min; FOV: 6 cm ×6 cm ×10.4 cm; 40 projections. Top row was adapted from ref. [25]. Note that the image quality and resolution are similar between the two scanning methods; however, a slight warping artifact is present in the faster dataset.
Figures 6 and 7 used the same pulse sequence with the following parameters. The drive field was the same as above, i.e., 23 kHz, 15 mT amplitude, and 1.3 cm z partial FOV. The x-direction slow shift field was operated using a 3.3 Hz, 58 mT triangle wave and covered an FOV of 5 cm along the x-direction. Along the z-direction, the slow shift field was a linear ramp with a 69 mT peak amplitude, which covered a 6 cm FOV in 3 s. No translation stage FOV extension was used. The total FOV was 7.3 cm along the z-direction. Twenty x-axis traversals were used to cover the entire 2D projection FOV. Forty projection images were acquired. The entire imaging sequence duration was 2.1 min. The final imaging FOV was a 5 cm × 5 cm × 7 cm cylindrical 3D volume.
Figure 6. Experimental images of acrylic phantom.
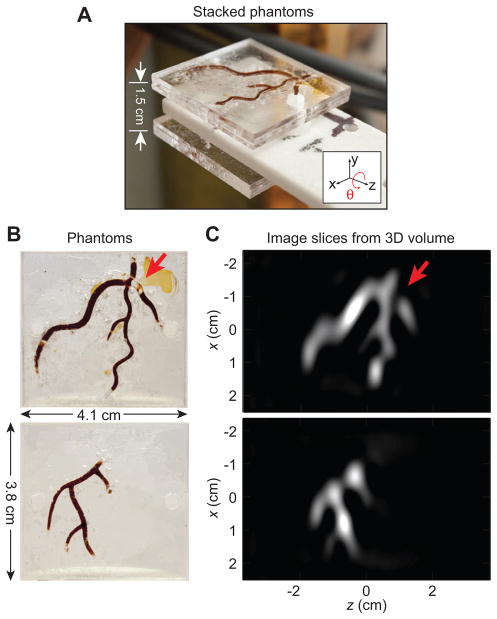
Following PR, we form a full tomographic 3D image that can be sliced in any location and orientation. (A) Two planar acrylic phantoms stacked to create a 3D Resovist distribution. (B) Two planar imaging phantoms injected with 100 mm (5 ×diluted) Resovist. (C) 2D image slices from the 3D PR dataset after FBP at the plane of each imaging phantom. The arrow points out a diagnosed blockage. Total imaging time: 2.1 min; FOV: 5 cm ×5 cm ×7.3 cm; 40 projections.
Figure 7. Results of mouse imaging experiments.
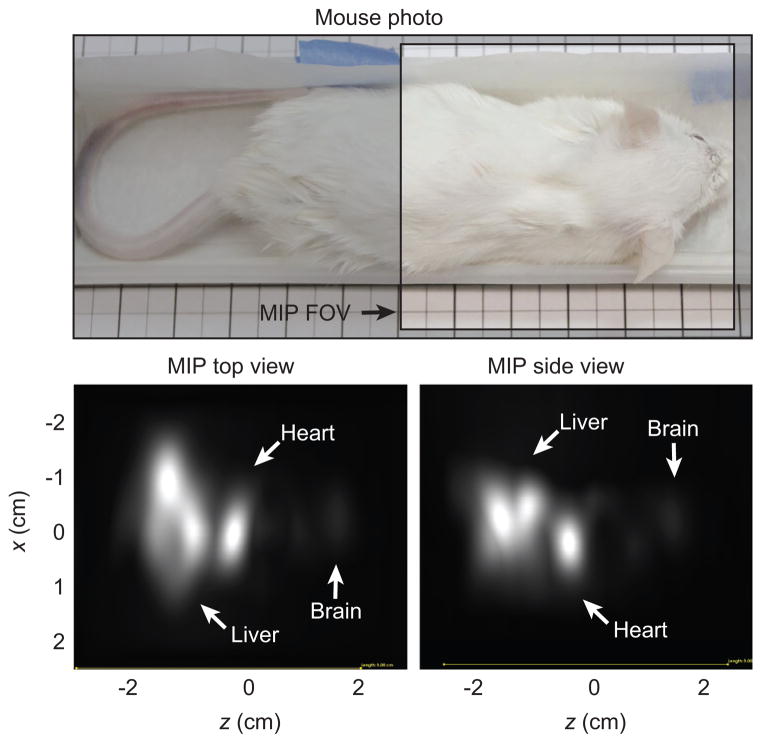
The mouse was injected with 150 μl of 167 mm (3 ×diluted) Resovist into a tail vein. The Resovist circulated for 20 s before sacrifice. Visible are the brain, heart, and liver. Total imaging time: 2.1 min; FOV: 5 cm ×5 cm ×7.3 cm shown by unshaded area in photo; 40 projections.
Using Eq. (1) with Kmax≈0.15 mm−1 and an FOVxy = 5 cm, 24 projections are necessary to avoid aliasing, and 29 projections are necessary for a 6 cm FOV. Note that we acquire 40 projections to oversample and maintain image quality.
With data acquired using the above pulse sequence, we reconstructed 3D MPI tomographic images using an FBP algorithm. At each projection angle, a 2D projection image was reconstructed using x-space reconstruction, and the baseline loss from each pFOV scan due to filtering was restored with a DC recovery algorithm [29]. We applied a receive coil sensitivity correction to each image based on a single calibration scan. Then, for all z-locations, the FBP algorithm was employed on 1D slices parallel to the x-axis in each projection image to reconstruct 2D images in the xy plane, orthogonal to the axial (z) direction. A full 3D volume was obtained by stacking the xy plane images in their corresponding z-position. After reconstructing an image volume, the 3D volume was exported in DICOM file format and imported into Osirix (Pixmeo, Switzerland) to create MIP and VR images.
Phantom experiments
To test the performance of our imaging system, we designed two phantoms to create 3D distributions of magnetic nanoparticle tracers. The first phantom (Figure 5) was created by wrapping tubing (ID 0.8 mm, OD 1.4 mm) filled with 50 mm Resovist (9:1 deionized water and Resovist) (Bayer Schering Pharma AG, Berlin, Germany) around a cylindrical piece of acrylic with a 3.4 cm OD. The second phantom (Figure 6) was composed of three joined layers of laser-cut acrylic sheets, with the middle layer containing a pattern filled with 100 mm Fe (5-fold diluted) Resovist nanoparticles.
Mouse imaging experiments
All animal experiments were performed according to the National Research Council’s Guide for the Care and Use of Laboratory animals and approved by UC Berkeley’s Animal Care and Use Committee. We prepared an adult CD-1 mouse (Charles River, Wilmington, MA, USA) for imaging by injecting 150 μl of 167 mm Fe (3-fold diluted) Resovist into the tail vein. The mouse was sacrificed 20 s post-injection, and imaged on the PR MPI system.
Results
Figure 5 compares the accelerated acquisition imaging below the slower original PR MPI imaging results. Each row shows photos of a helical imaging phantom adjacent to MIP and VR views of the acquired data set. Images of each helical tubing phantom are intended to allow comparison of image quality in both these formats and show the ability of the imager to accurately resolve continuous nanoparticle distributions in non-planar dimensions. Note how the VR images correctly show the overlap, which a projection would not show. The MIP and VR images can be rotated to any orientation. Note that the image quality and resolution remain very similar between the fast- and slow-scanning methods despite 20-fold speed improvement.
In Figure 6B, we show two acrylic imaging phantoms. In Figure 6A, these two phantoms are shown in their stacked imaging configuration. Figure 6C displays two 2D slices of the reconstructed 3D image volume at the plane of each imaging phantom. An arrow in Figure 6B and C points to a diagnosed blockage (due to an air bubble) in the phantom that is visible in the corresponding image slice.
The results of the mouse imaging experiments are displayed in Figure 7. PR MPI maximum intensity projection images from the top and side, as well as a size-matched photograph of the mouse, are shown. The mouse was injected in the tail vein with Resovist, sacrificed after 20 s, and immediately imaged. The Resovist tracer can be seen in the heart, liver, and the brain of the mouse.
Discussion
While maintaining imaging quality, we have shown a 20-fold improvement in acquisition time of our PR MPI system with a new imaging sequence and new hardware. The images of Figures 5 and 6 correspond well to the tubing and acrylic phantoms. The excellent image contrast inherent in the MPI technique is evident in the post-sacrifice mouse images (Figure 7), where no background tissue signal is present. The imaging sequence produces images that achieve the theoretical resolution of the system [25].
Owing to non-linearity in the gradient and inhomogeneity in the shift coil, a slight warping artifact is visible in the 1.3 min MIP image of Figure 5. This appears as a slight curvature at the edges of the image, were the edges appear compressed when compared with the center of the image. This artifact is similar in concept to the gradient warping commonly seen in MRI and could easily be fixed in post-processing, but we have chosen to show the artifact here.
Use of the mechanical extension slows the acquisition time if a large translation distance is chosen. Our current translation stage operates at a constant 9 mm/s. Thus, we can only extend the FOV by 1.6 cm in the 1.8-s acquisition time in Figure 5.
Future improvements to our imaging system include FOV, resolution, and software enhancements. Another potential improvement is continuous rotation of the sample, as it can decrease tissue inertial motion in animal experiments [10]. The z-axis slow shift coils described in this work are also capable of boosting the FFL gradient, which would enable higher resolution imaging (not shown). Alternatively, the FFL system could be redesigned with a higher gradient strength.
Similar to CT, where both cone-beam CT and helical CT exist, we see two paths moving forward in PR MPI. We compare electronic FFL rotation system designs to helical CT, which uses fast gantry rotation times (e.g., 0.28 s) along with a moving table scan [1, 4, 8, 27]. Unfortunately, a system with electronic rotation requires approximately double the number of magnets and power supplies as a system with mechanical rotation and cannot be built as a simple permanent magnet system. This is in contrast to the system presented here, which more resembles cone-beam CT imagers that are more frequently seen in radiation therapy and interventional procedures, and less so in diagnostic CT. Cone-beam CT uses slow rotation times and obtains a large FOV with each projection image. Our PR MPI system uses a simple permanent magnet FFL consisting of two opposed permanent magnets. To produce a 3D image, we rotate the sample similar to micro-CT scanners [17, 19]. Alternatively, a gantry could be used to rotate the FFL magnets.
In MPI, the imaging speed of human-sized scanners will be limited by human safety thresholds; thus, there is no net improvement in imaging speed for large objects in going to a complex, rapidly rotating system with no mechanical rotation. From Table 1, we note that each (10 cm)2 projection image will take approximately 3 s in a high-resolution system. This relatively long projection time will lead to slow gantry rotation times for large volumes. We also note from Table 1 that this approach will not significantly affect the imaging time compared with standard 3D configurations. Furthermore, the unique flexibility of this configuration can produce real-time small-FOV 2D projection images at any angle.
From Table 1 and Eqs. (4) and (5), we can make two other key conclusions. First, improving the native resolution of the tracer (e.g., resolution of 1 mm in a 5 T/m gradient) results in dramatic improvements in imaging times as a smaller gradient may be used to achieve a specific resolution. Here, we refer to the native resolution without deconvolution. Deconvolution can be applied to improve the resolution of the image with a tradeoff of exponential loss of SNR [20]. Second, even improving the resolution of the tracer by 4-fold, a significant challenge when using iron oxide tracers [6, 7], real-time 3D full-FOV imaging of > 5 frames/s may not be possible at high resolution in the human heart (2.5 T/m, 4 s/frame). This is not to say that real-time imaging cannot be achieved, but that it just may require the development of new acquisition techniques such as ROIs within the FOV, adaptive resolution imaging, and cine techniques.
Currently, PR MPI is significantly slower than real time; however, there are many potential techniques for reducing the scan time for PR MPI. The most straightforward of these techniques is to reduce the number of projections, which would undersample the object near the periphery. For reasonable reductions in sampling density, the artifacts are typically benign. If any artifacts appear because of undersampling, they usually manifest as streaking artifacts to which radiologists have become accustomed.
Fortunately, it may be theoretically possible to perform true real-time imaging (10+ frames/s) in MPI in a 2D projection format [14]. We believe that projection imaging, or “MPI fluoroscopy”, will be the standard mode of operation for angiographic applications using MPI. In the cases where 3D is required, the same imager can be used to acquire full 3D images by rotating the scanner around the bore. Further, such a hybrid instrument would have the added benefit of an order of magnitude SNR improvement.
Conclusion
We have presented a pulse sequence that theoretically produces magnetostimulation-limited images for PR MPI. We explored imaging speed theoretical limits due to magnetostimulation and found that PR MPI does not significantly increase imaging time over a 3D FFP imager. Furthermore, PR MPI produces images with an order of magnitude higher SNR for the same imaging time. We have experimentally demonstrated hardware changes in our PR MPI system and pulse sequence changes to produce images 20-fold faster. We acquired high-quality images of mice and phantoms with resolution that matches theoretical predictions. Moving forward, we anticipate that hybrid projection MPI and PR MPI systems will become the preferred MPI imaging mode because they will benefit from a combination of fast 2D imaging coupled with the option of high-sensitivity 3D imaging.
Acknowledgments
J.J. Konkle and P.W. Goodwill contributed equally to this work. This work was supported in part by the CIRM Tools and Technology Grant RT2-01893, the University of California Discovery Grant, the NIH National Institute of Biomedical Imaging and Bioengineering grant 1R01EB013689, and the National Science Foundation Graduate Research Fellowship grant DGE 1106400. The contents of this publication are solely the responsibility of the authors and do not necessarily represent the official views of CIRM or any other agency of the State of California, the National Institute of Biomedical Imaging and Bioengineering, or the National Institutes of Health.
Appendices
Appendix 1 Projection reconstruction SNR gain calculation
We calculate the SNR gain of 3D PR with an FFL as compared to 3D imaging with an FFP with equal imaging time. Here, we assume that the two systems have identical noise characteristics, pulse sequence, resolution, and gradient strength. In a simulation study, Weizenecker et al. [40] noted that the SNR of a 3D PR image is approximately proportional to , where N is the number of projections acquired. Here, we show how the SNR is affected by the FBP operation. We begin by calculating the noise variance of FBP:
where σ0 is the standard deviation of noise per pixel assuming Gaussian random noise, k is spatial frequency, G(k) is the filter frequency response, ϕ is the angle in radians, and Kmax is the maximum radial spatial frequency of the acquired image (i.e., the total extent is 2Kmax). Similar calculations have been done in CT [33]. Note that filtering takes place after discretization of the acquired projection images. Hence, the spatial-frequency domain is “normalized” such that the maximum frequency is one-half cycle per pixel, i.e., 2Kmax = 1. For a ramp filter G(k) = k, the noise variance becomes
We then calculate the SNR for a PR image after FBP with a ramp filter:
where μ is the signal mean or expected value. Similarly, the noise variance in an image acquired with an FFP can be calculated:
Again, we used 2Kmax = 1. Thus,
Finally, we find
In general, the exact value of the constant multiplier before depends on the shape of the filter G(k).
Appendix 2 MPI acquisition time calculation
We can calculate the optimum imaging time based on specific absorption rate (SAR) and magnetostimulation (dB/dt) limits, the two primary safety concerns when imaging human subjects using time-varying magnetic fields. Owing to the frequency range in which MPI operates, magnetostimulation (and not SAR) is the dominant limitation for scanning speed in MPI [11, 35]. For humansized MPI scanners, magnetostimulation will restrict the amplitude of both the excitation (drive) field and the slow shift (focus) fields.
The drive field in MPI is typically a ~25 kHz frequency sinusoidal field. Between 5 and 50 kHz, the magnetostimulation threshold in the human torso is extrapolated as approximately Bth = 7 mT [35]. With a G = 10 T/m gradient strength, which will produce 1 mm native (i.e., no deconvolution) resolution with Resovist [11–13, 16], the FOV can be calculated as FOV = 2Bth/G = 1.4 mm.
To address the limited FOV coverage of the drive subsystem, slow shift magnets [12] or focus field magnets [37] are used. These slow shift magnets slowly raster the mean position of the FFP or FFL (see Figure 8), expanding the FOV beyond what is covered by the drive field alone. In a system with slow shift magnets, the space covered solely by the drive field (with the slow shift field disabled) is termed a “partial FOV” (pFOV) [12] or “imaging station” with multistation reconstruction [37]. Slow shift fields also limit the acquisition time for an MPI system owing to magnetostimulation limits. The ICNIRP define a maximal magnetic field slew rate of 20 T/s for pulse durations longer than a couple of milliseconds [18]. As we determine below, the slew rate causes the slow shift fields to become binding constraints on imaging time in addition to the drive field.
Figure 8. Trajectory distance calculation for the Lissajous pattern.
The Lissajous pattern is created with two sinusoidal drive fields and is slowly rastered through the field of view with two slow shift (focus) fields.
Generally, the total imaging time, T [s], in MPI can be calculated as
| (6) |
where D [m] is the total distance traveled by the field free region and vs [m/s] is the slow shift field scanning rate. The total distance traveled depends on the type of drive field and slow shift field pulse sequences. Commonly, a linear or Lissajous trajectory is used for the drive field. These trajectories provide near ideal spatial coverage and are easy to calculate [32, 39].
The total distance traveled by the mean position of the field free region dominates the total imaging time assuming that (1) the time to cover the pFOV is nearly instantaneous, (2) magnetostimulation thresholds from the drive field and the slow shift fields do not affect each other, and (3) the pFOV is small relative to the total FOV (see Figure 8). The total distance is then calculated as
| (7) |
| (8) |
where
| (9) |
Here, 2D refers to a single slice in FFP imaging or a single projection using an FFL, and 3D refers to imaging using an FFP. FOVi is the size of the field of view along axis i, pFOVi is the size of the partial FOV along i, pi is the number of pFOVs along i, and β is a factor ( > 1) determining the overlap extent of the pFOVs required for baseline recovery [29]. We can calculate the maximal size of the pFOV using the simple relation pFOV = 2Bth/G [m]. Accordingly, the imaging time can be estimated as
| (10) |
| (11) |
where Smax = 20 T/s is the maximum slew rate as described above and μ0Gab [T/m] is the partial derivative of the magnetic field in the a direction with respect to b.
Contributor Information
Justin J. Konkle, Email: jkonkle@berkeley.edu, Department of Bioengineering, University of California, Berkeley, 340 Hearst Memorial Mining Building, Berkeley, CA 94720-1762, USA
Patrick W. Goodwill, Department of Bioengineering and EECS, University of California, Berkeley, Berkeley, CA, USA
Emine Ulku Saritas, Department of Bioengineering and EECS, University of California, Berkeley, Berkeley, CA, USA.
Bo Zheng, Department of Bioengineering and EECS, University of California, Berkeley, Berkeley, CA, USA.
Kuan Lu, Department of Bioengineering and EECS, University of California, Berkeley, Berkeley, CA, USA.
Steven M. Conolly, Department of Bioengineering and EECS, University of California, Berkeley, Berkeley, CA, USA
References
- 1.Achenbach S, Marwan M, Ropers D, et al. Coronary computed tomography angiography with a consistent dose below 1 mSv using prospectively electrocardiogram-triggered high-pitch spiral acquisition. Eur Heart J. 2010;31:340–346. doi: 10.1093/eurheartj/ehp470. [DOI] [PubMed] [Google Scholar]
- 2.Barrett T, Brechbiel M, Bernardo M, Choyke PL. MRI of tumor angiogenesis. J Magn Reson Imaging. 2007;26:235–249. doi: 10.1002/jmri.20991. [DOI] [PubMed] [Google Scholar]
- 3.Bulte JWM, Walczak P, Gleich B, et al. MPI cell tracking: what can we learn from MRI? Imaging. 2011;7965:79650Z–79650Z-4. doi: 10.1117/12.879844. [DOI] [PMC free article] [PubMed] [Google Scholar]
- 4.Chandarana H, Godoy MCB, Vlahos I, et al. Abdominal aorta: evaluation with dual-source dual-energy multidetector CT after endovascular repair of aneurysms – initial observations. Radiology. 2008;249:692–700. doi: 10.1148/radiol.2492080359. [DOI] [PubMed] [Google Scholar]
- 5.Erbe M, Knopp T, Sattel TF, Biederer S, Buzug TM. Experimental generation of an arbitrarily rotated field-free line for the use in magnetic particle imaging. Med Phys. 2011;38:5200–5207. doi: 10.1118/1.3626481. [DOI] [PubMed] [Google Scholar]
- 6.Ferguson RM, Khandhar AP, Krishnan KM. Tracer design for magnetic particle imaging (invited) J Appl Phys. 2012;111:7B318–7B3185. doi: 10.1063/1.3676053. [DOI] [PMC free article] [PubMed] [Google Scholar]
- 7.Ferguson RM, Minard KR, Khandhar AP, Krishnan KM. Optimizing magnetite nanoparticles for mass sensitivity in magnetic particle imaging. Med Phys. 2011;38:1619. doi: 10.1118/1.3554646. [DOI] [PMC free article] [PubMed] [Google Scholar]
- 8.Fleischmann D, Boas FE. Computed tomography – old ideas and new technology. Eur Radiol. 2011;21:510–517. doi: 10.1007/s00330-011-2056-z. [DOI] [PubMed] [Google Scholar]
- 9.Gleich B, Weizenecker J. Tomographic imaging using the nonlinear response of magnetic particles. Nature. 2005;435:1214–1217. doi: 10.1038/nature03808. [DOI] [PubMed] [Google Scholar]
- 10.Goldman LW. Principles of CT and CT technology. J Nucl Med Technol. 2007;35:115–28. doi: 10.2967/jnmt.107.042978. [DOI] [PubMed] [Google Scholar]
- 11.Goodwill PW, Conolly SM. The x-space formulation of the magnetic particle imaging process: 1-D signal, resolution, bandwidth, SNR, SAR, and magnetostimulation. IEEE Trans Med Imaging. 2010;29:1851–1859. doi: 10.1109/TMI.2010.2052284. [DOI] [PubMed] [Google Scholar]
- 12.Goodwill PW, Conolly SM. Multidimensional x-space magnetic particle imaging. IEEE Trans Med Imaging. 2011;30:1581–1590. doi: 10.1109/TMI.2011.2125982. [DOI] [PMC free article] [PubMed] [Google Scholar]
- 13.Goodwill PW, Conolly SM. Experimental demonstration of x-space magnetic particle imaging. Proceedings of SPIE. 2011;7965:79650U–79650U-6. [Google Scholar]
- 14.Goodwill PW, Konkle JJ, Zheng B, Saritas EU, Conolly SM. Projection x-space magnetic particle imaging. IEEE Trans Med Imag. 2012;31:1076–1085. doi: 10.1109/TMI.2012.2185247. [DOI] [PMC free article] [PubMed] [Google Scholar]
- 15.Goodwill PW, Lu K, Zheng B, Conolly SM. An x-space magnetic particle imaging scanner. Rev Sci Instrum. 2012;83:033708. doi: 10.1063/1.3694534. [DOI] [PMC free article] [PubMed] [Google Scholar]
- 16.Goodwill PW, Tamrazian A, Croft LR, et al. Ferrohydrodynamic relaxometry for magnetic particle imaging. Appl Phys Lett. 2011;98:262502. [Google Scholar]
- 17.Holdsworth DW, Thornton MM. Micro-CT in small animal and specimen imaging. Trends Biotechnol. 2002;20:S34–S39. [Google Scholar]
- 18.International Commission on Non-Ionizing Radiation Protection (ICNIRP) Medical magnetic resonance (MR) procedures: protection of patients. Health Phys. 2004;87:197–216. doi: 10.1097/00004032-200408000-00008. [DOI] [PubMed] [Google Scholar]
- 19.Jorgensen SM, Demirkaya O, Ritman EL. Three-dimensional imaging of vasculature and parenchyma in intact rodent organs with X-ray micro-CT. Am J Physiol. 1998;275:H1103–H1114. doi: 10.1152/ajpheart.1998.275.3.H1103. [DOI] [PubMed] [Google Scholar]
- 20.Knopp T, Biederer S, Sattel TF, Erbe M, Buzug TM. Prediction of the spatial resolution of magnetic particle imaging using the modulation transfer function of the imaging process. IEEE Trans Med Imaging. 2011;30:1284–1292. doi: 10.1109/TMI.2011.2113188. [DOI] [PubMed] [Google Scholar]
- 21.Knopp T, Erbe M, Biederer S, Sattel TF, Buzug TM. Efficient generation of a magnetic field-free line. Med Phys. 2010;37:3538. doi: 10.1118/1.3447726. [DOI] [PubMed] [Google Scholar]
- 22.Knopp T, Erbe M, Sattel TF, Biederer S, Buzug TM. Generation of a static magnetic field-free line using two Maxwell coil pairs. Appl Phys Lett. 2010;97:092505. [Google Scholar]
- 23.Knopp T, Erbe M, Sattel TF, Biederer S, Buzug TM. A Fourier slice theorem for magnetic particle imaging using a field-free line. Inverse Probl. 2011;27:095004. [Google Scholar]
- 24.Konkle J, Goodwill P, Carrasco-Zevallos O, Conolly S. Experimental 3D X-space magnetic particle imaging using projection reconstruction. In: Buzug TM, Borgert J, editors. Magnetic particle imaging; Proceedings in Physics; Lubeck, Germany: Springer; 2012. pp. 243–247. [Google Scholar]
- 25.Konkle JJ, Goodwill PW, Carrasco-Zevallos OM, Conolly SM. Projection reconstruction magnetic particle imaging. IEEE Trans Med Imaging. 2013;32:338–347. doi: 10.1109/TMI.2012.2227121. [DOI] [PMC free article] [PubMed] [Google Scholar]
- 26.Konkle J, Goodwill P, Conolly S. In: Pelc NJ, Dawant BM, Summers RM, et al., editors. Development of a field free line magnet for projection MPI; Proc. SPIE 7965, medical imaging 2011: biomedical applications in molecular, structural, and functional imaging; 2011. pp. 79650X–79650X-7. [Google Scholar]
- 27.Krauss B, Schmidt B, Flohr T. Dual source CT. In: Johnson T, Fink C, Schönberg SO, Reiser MF, editors. Dual energy CT in Clinical Practice. Berlin Heidelberg: Springer; 2011. pp. 11–20. [Google Scholar]
- 28.Lu K, Goodwill P, Saritas E, Zheng B, Conolly S. Linearity and shift-invariance for quantitative magnetic particle imaging. IEEE Trans Med Imaging. 2013 doi: 10.1109/TMI.2013.2257177. [DOI] [PMC free article] [PubMed] [Google Scholar]
- 29.Lu K, Goodwill P, Zheng B, Conolly S. The impact of filtering direct-feedthrough on the x-space theory of magnetic particle imaging. SPIE proceedings; 2011. pp. 79652I–79652I-7. [Google Scholar]
- 30.Macovski A. In: Medical imaging systems. 1. Kailath T, editor. Englewood Cliffs, NJ: Prentice Hall; 1983. [Google Scholar]
- 31.Nishimura DG. Principles of magnetic resonance imaging. Stanford, CA: Stanford University; 2010. [Google Scholar]
- 32.Rahmer J, Weizenecker J, Gleich B, Borgert J. Signal encoding in magnetic particle imaging: properties of the system function. BMC Med Imaging. 2009;9:4. doi: 10.1186/1471-2342-9-4. [DOI] [PMC free article] [PubMed] [Google Scholar]
- 33.Riederer SJ, Pelc NJ, Chesler DA. The noise power spectrum in computed X-ray tomography. Phys Med Biol. 1978;23:446–454. doi: 10.1088/0031-9155/23/3/008. [DOI] [PubMed] [Google Scholar]
- 34.Saritas EU, Goodwill PW, Croft LR, et al. Magnetic particle imaging (MPI) for NMR and MRI researchers. J Magn Reson. 2012;229:116–126. doi: 10.1016/j.jmr.2012.11.029. [DOI] [PMC free article] [PubMed] [Google Scholar]
- 35.Saritas EU, Goodwill PW, Zhang GZ, Conolly SM. Magneto-stimulation limits in magnetic particle imaging. IEEE Trans Med Imaging. 2013 doi: 10.1109/TMI.2013.2260764. [DOI] [PubMed] [Google Scholar]
- 36.Sattel TF, Knopp T, Biederer S. Single-sided device for magnetic particle imaging. J Phys D Appl Phys. 2009;42:022001. [Google Scholar]
- 37.Schmale I, Rahmer J, Gleich B, et al. First phantom and in vivo MPI images with an extended field of view. Imaging. 2011;7965:796510–6. [Google Scholar]
- 38.Schmitz SA, Albrecht T, Wolf KJ. MR angiography with superparamagnetic iron oxide: feasibility study. Radiology. 1999;213:603–607. doi: 10.1148/radiology.213.2.r99oc24603. [DOI] [PubMed] [Google Scholar]
- 39.Weizenecker J, Borgert J, Gleich B. A simulation study on the resolution and sensitivity of magnetic particle imaging. Phys Med Biol. 2007;52:6363–6374. doi: 10.1088/0031-9155/52/21/001. [DOI] [PubMed] [Google Scholar]
- 40.Weizenecker J, Gleich B, Borgert J. Magnetic particle imaging using a field free line. J Phys D Appl Phys. 2008;41:105009. [Google Scholar]
- 41.Weizenecker J, Gleich B, Rahmer J, Dahnke H, Borgert J. Three-dimensional real-time in vivo magnetic particle imaging. Phys Med Biol. 2009;54:L1–L10. doi: 10.1088/0031-9155/54/5/L01. [DOI] [PubMed] [Google Scholar]


