Abstract
Calcium carbonate has evoked interest owing to its use as a biomaterial, and for its potential in biomineralization. Three polymorphs of calcium carbonate, i.e. calcite, aragonite, and vaterite were synthesized. Three conventional bulk analysis techniques, Fourier transform infrared (FTIR), X-ray diffraction (XRD), and SEM, were used to confirm the crystal phase of each polymorphic calcium carbonate. Two surface analysis techniques, X-ray photoelectron spectroscopy (XPS) and time-of-flight secondary ion mass spectroscopy (TOF-SIMS), were used to differentiate the surfaces of these three polymorphs of calcium carbonate. XPS results clearly demonstrate that the surfaces of these three polymorphs are different as seen in the Ca(2p) and O(1s) core-level spectra. The different atomic arrangement in the crystal lattice, which provides for a different chemical environment, can explain this surface difference. Principal component analysis (PCA) was used to analyze the TOF-SIMS data. Three polymorphs of calcium carbonate cluster into three different groups by PCA scores. This suggests that surface analysis techniques are as powerful as conventional bulk analysis to discriminate calcium carbonate polymorphs.
Keywords: Calcium carbonate, calcite, aragonite, vaterite, X-ray photoelectron spectroscopy, time-of-flight secondary ion mass spectroscopy, principal component analysis
1. Introduction
Calcium carbonate is commonly found in many forms, for example as limestone, as the calcareous exoskeleton of marine animals, and as boiler scales. It has many applications: coating pigment for premium quality paper products in paper industry, fillers in rubber and paints in polymer applications, and calcium-based antacid tablets in healthcare. Calcium carbonate has also received considerable attention in the field of biomaterials1 and biomineralization2 since calcium carbonate is one of the most abundant biological minerals formed by living organisms. Calcium carbonate is used as a biomaterial for bone reconstruction.3 For example, Biocoral®, a natural coral exoskeleton which is mainly calcium carbonate, has been used as a bone graft substitute4.
There are three polymorphs of anhydrous calcium carbonate: vaterite, aragonite and calcite, listed here in order of increasing thermodynamic stability. All three polymorphs can occur at the same time in some types of mollusks and marine algae. Aragonite and calcite are more thermodynamically stable structures, and they most commonly occur in nature. For example, the abalone shell is comprised of calcite (prismatic layer) and aragonite (nacreous layer). Vaterite, also known as μ-CaCO3, less commonly occurs in nature because it is the least thermodynamically stable polymorph. Vaterite can rapidly transform to calcite and aragonite in aqueous solution. Experimental evidence has demonstrated that vaterite can transform to aragonite in 60 minutes at 60°C and to calcite in 24 hours at room temperature.5
Many conventional techniques including Fourier transform infrared (FTIR) spectroscopy, X-ray diffraction (XRD), and scanning electronic microscopy (SEM) have been used to distinguish between calcium carbonate polymorphs. However, SEM is inconclusive for discriminating among calcium carbonate polymorphs because the morphology of each calcium carbonate polymorph is not unique. The morphology of each crystalline polymorph can be changed due to the crystallization condition. For instance, the conventional shape of aragonite is “needle-like.” But it may change to “flake-like” or “cauliflower-like” under certain crystallization condition.6
Although polymorphic calcium carbonate can be characterized and identified by bulk analysis, such as conventional FTIR and XRD techniques, surface analysis of these materials is still needed. As an intriguing biomaterial with potential use as bone graft, the surface structure and function of those polymorphic calcium carbonates are crucial for properly understanding their biological properties. Because the composition and structure of the three polymorphic CaCO3 surface may not be the same as that of the bulk, the information given by bulk analysis could lead to misinterpretation of structure/function relationships.
Both X-ray photoelectron spectroscopy (XPS) and time-of-flight secondary ion mass spectroscopy (TOF-SIMS) have been previously applied in surface characterization of calcium carbonate.8–11 The most studied polymorph of calcium carbonate is calcite. XPS was used to investigate trace metal adsorption on calcite surface because of its high surface sensitivity.8 The chemical and morphological behavior of the calcite surfaces during exposure to air were studied with a combination of TOF-SIMS and scanning force microscopy (SFM).12 The dissolution behavior of CaCO3 in the presence of a phosphate compound has also been investigated using XPS and other techniques.11 XPS alone has been applied to differentiate the three polymorphic CaCO3 materials.9 Most of the XPS studies identified the Ca (2p), C (1s) and O (1s) core-level shifts of calcium carbonate. Because of instrument and material differences, there was often poor agreement between the different groups's results. TOF-SIMS has not previously been applied to distinguish CaCO3 polymorphs due to the intrinsic complexity of SIMS data. Multivariate analysis methods such as principal component analysis (PCA) have been successfully used to achieve quantitative results from SIMS spectra in many applications.13 The advantage of PCA over traditional quantification analysis is that PCA is a full-spectrum methodology; whereas, traditional quantification analysis is only based on one or a few SIMS peaks. SIMS/PCA has been used with success to discriminate different calcium phosphate phases.7
In order to differentiate between the surfaces of the three calcium carbonate polymorphs, we present a combination method using both XPS and SIMS. Conventional bulk analysis, such as XRD, FTIR and SEM were used to confirm each of the crystal polymorphs before surface analysis. The Ca (2p) and O1(s) core-level shifts of CaCO3 were found to be different from each CaCO3. SIMS along with PCA was used to differentiate each CaCO3 by clustering the polymorphs into three separate groups.
2. Material and Methods
Materials
Calcite, aragonite, and vaterite samples were synthesized by following the method described by Gopinath et al.9 with a slight modification. In this experiment, CaCl2•2H2O (Reagent ACS) and Na2CO3 (anhydrous, Reagent ACS) were obtained from Fisher Scientific, but these were used as received.
Calcite was synthesized by adding 50 mL Na2CO3 (1M) into 50 mL CaCl2 (1M) with continuous stirring at room temperature. After precipitation, the crystals were digested in water for 12 days, then filtered and washed thoroughly with water. The resulting calcite sample was dried under ambient conditions.
Aragonite was synthesized by simultaneously combining 50 mL Na2CO3 (1M) and 50 mL CaCl2 (1M) and continuously stirring at 80°C for half an hour. After precipitation, the crystals were filtered, washed thoroughly with water and air dried.
Vaterite was synthesized by simultaneously combining 50 mL Na2CO3 (1M) and 50 mL CaCl2 (1M) and continuously stirring at 80°C. The hot slurry was filtered immediately after the two aqueous solution were combined, then washed thoroughly with water and air dried.
All synthesized calcium carbonate samples were crushed into fine powders for further characterization. For both XPS and TOF-SIMS experiments, these sample powders were carefully transferred to a glass cover slip to which double-sided tape was adhered. The samples were then blown with N2 to remove loose powder and immediately transferred into the XPS and SIMS vacuum chambers.
XRD
The crystalline composition and structure of the three calcium carbonate polymorphs were characterized by X-ray diffraction (XRD, Philips, PW1830) with CuKα radiation at 40 kV and 20 mA. The diffraction pattern was collected at a scanning rate of 0.02 degrees per second in 2θ ranging from 20° to 60°.
FTIR
Fourier transform infrared (FTIR) spectra were obtained using a Bruker FTIR spectrometer. Calcium carbonate powder was milled with KBr with a ratio of 1 mg to 200 mg, and pressed into a transparent disk for analysis. FTIR spectra were collected at a resolution of 1 cm−1 and 8 scans over a range of 600 to 1200 wave numbers (cm−1). Background data collected for a blank were subtracted from each spectrum.
SEM
The microstructures of the three calcium carbonate polymorphs were characterized using a scanning electron microscopy (SEM) (FEI Sirion) at 3 kV.
XPS
XPS experiments were performed using Surface Science Instruments X-Probe spectrometers. Al Kα X-rays were used as the source (hv = 1486.6 eV). All binding energies (BEs) for the samples were referenced by setting the adventitious carbon C(1s) peak to 285 eV. The BEs were measured with a precision of ± 0.2 eV. The high-resolution C(1s), Ca(2p) and O(1s) spectra were obtained at a pass energy of 50 eV. The XPS data were acquired at a takeoff angle of 55°. The XPS peaks with multiple components were resolved by a peak fitting program assuming 100% Gaussian peak shape. Further details of the XPS analysis procedures are given elsewhere.14
SIMS
TOF-SIMS data were acquired using a Model 7200 Physical Electronic instrument (PHI, Eden Prairie, MN) with an 8 keV Cs+ primary ion source. Data were taken over a mass range from m/z = 0 to 200 for both positive and negative secondary ions. The positive SIMS spectra from the polymorphic calcium carbonate powders were calibrated using CH3+, C2H3+, Ca+ and CaOH+ peaks. The negative SIMS spectra from the polymorphic calcium carbonate powders were calibrated using CH−, O−, OH− and CO3− peaks. The differences between the expected and observed masses for both positive and negative ions after calibration were less than 20 ppm.
Principal Component Analysis (PCA)
PCA was done using the software from the PLS Toolbox version 2.0 (Eigenvector Research; Manson, WA) for MATLAB (MathWorks, Inc.; Natick, MA). A comprehensive discussion of PCA procedures is given elsewhere (2). Briefly, the intensity of each individual peak was normalized to the total intensity to eliminate systematic differences between the spectra. During the data processing of PCA, mean-centering was also used to reduce data scatter.7
3. Results
To verify the crystal phase of three calcium carbonate polymorphs, we examined the calcium carbonate powders with XRD, FTIR and SEM.
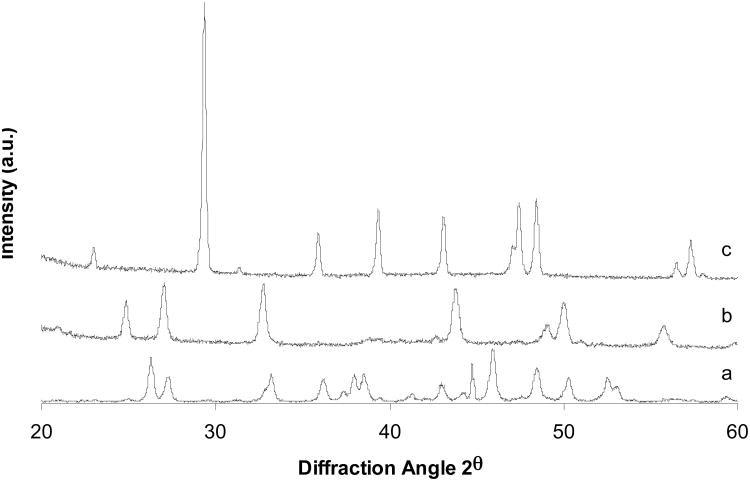
Fig. 1 shows the XRD patterns of the three polymorphic calcium carbonate crystals. The patterns match those of X-ray diffraction standards. It is evident that all three calcium carbonate polymorphs were synthesized as expected.
Fig. 1.
XRD patterns of three calcium carbonate polymorphs: (a) aragonite; (b) vaterite; (c) calcite.
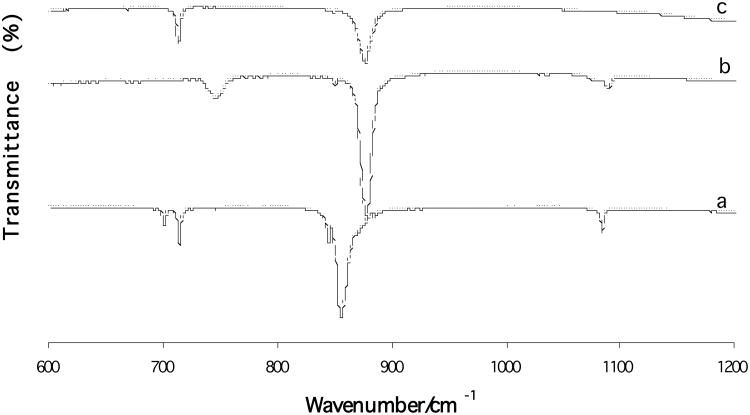
Fig. 2 shows the FTIR spectra of the three synthesized CaCO3 polymorphs. The characteristic carbonate v2 band of aragonite is at 858 cm−1; whereas, that of both calcite and vaterite is at 874 cm−1. The characteristic carbonate v4 band of aragonite is at 700 and 713 cm−1; whereas, that of calcite is at 713 cm−1 and vaterite at 744 cm−1, respectively. These spectra are in agreement with those obtained from the pure calcium carbonate crystals.6, 15
Fig. 2.
FTIR spectra of three calcium carbonate polymorphs: (a) aragonite; (b) vaterite; (c) calcite.
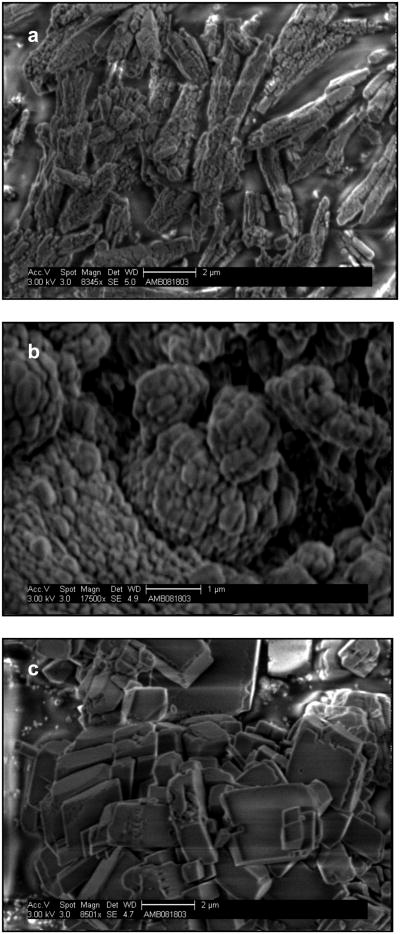
SEM micrographs of the three CaCO3 polymorphs are shown in Fig. 3. The morphologies of three calcium carbonate polymorphs are different: a rhombic shape for calcite crystals (Fig. 3a), a needle-like shape for aragonite crystals (Fig. 3b), and a spherical shape for vaterite crystals (Fig. 3c) These are the expected morphologies.16
Fig.3.
SEM images of three calcium carbonate polymorphs: (a) aragonite; (b) vaterite; (c) calcite.
By taking XPS wide scans and high resolution scans of Ca(2p), C(1s), O(1s) from three CaCO3 polymorphs powders, we investigated the surface atomic ratios of Ca/C and O/Ca, and the chemical shifts of Ca (2p), C(1s)and O(1s) peaks.
A typical XPS wide scan spectrum from calcite is shown in Figure 4. All three elements comprising CaCO3, i.e., Ca, C, and O, were observed. For aragonite and vaterite, sodium was found as an impurity, and its elementary concentration was less than 5%.
Fig. 4.
XPS wide scan of calcite showing that Ca, C, and O, the three compositional elements of calcium carbonate, are present.
The surface elementary compositions, Ca/C and Ca/O atomic ratios, of all three calcium carbonate powders are summarized in Table 1. All powders have relatively high levels of carbon. This is because the calcium carbonate surfaces have high surface energy. Hydrocarbon impurity, also known as “adventitious carbon,” spontaneously adsorbed on those high-energy surfaces thereby reducing interfacial energy. Incorrect (surface) Ca/C and Ca/O atomic ratios will be computed if we use %C values directly from the XPS elementary compositions. To correct this error, we use adjusted the %C values obtained using the relationship: %Cadjusted = %C*(C(1s)carbonate/C(1s)total) where %C is the total atomic percentage of carbon as measured in wide-scan XPS spectra. As can be seen in Table 1, all Ca/Cadjusted ratios were relative low (∼ 0.8) compared to the theoretical ratio (1.0). For calcite and aragonite, O/Ca ratios were lower (2.7—2.8) than the theoretical ratio (3.0); whereas, it was higher for vaterite (3.6).
Table 1.
XPS Ca/Cadjusted, O/Ca ratios and C1s atomic percentages from the three calcium carbonate polymorphs.
| aragonite | calcite | vaterite | |
|---|---|---|---|
| Ca/Cadjusted | 0.77 | 0.81 | 0.85 |
| O/Ca | 2.67 | 2.81 | 3.56 |
| C(1s)carbonate/C(1s)total | 22.47 | 28.03 | 26.24 |
| total C1s atomic % | 61.04 | 53.65 | 49.61 |
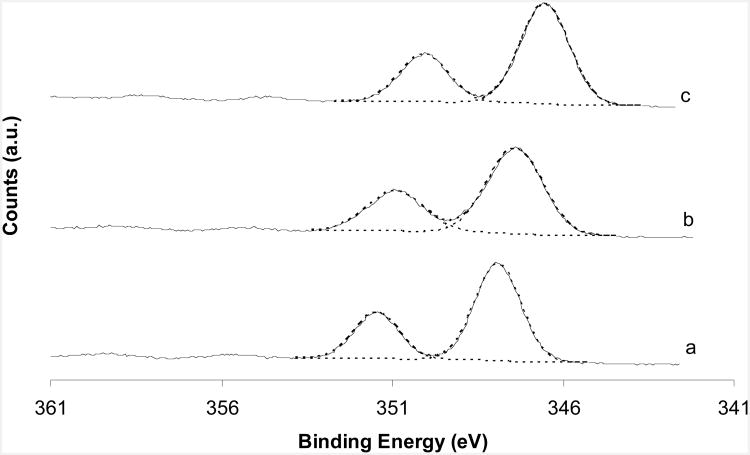
Fig. 5 shows the high-resolution XPS spectra of the Ca 2p core levels from all three polymorphic CaCO3 samples. Two peaks were seen, identified as Ca2p3/2 and Ca2p1/2, in the order of increasing BE. The Ca2p3/2 core level binding energy (BE) position of calcite, vaterite and aragonite, in the order of increasing BE, appears at 346.5, 347.4, and 347.9 eV respectively (Table 2). The Ca2p3/2 core level appears at a low BE on calcite surfaces in a comparison of all three types of samples and this suggests that the calcite electron density around calcium atoms in the surface zone is relatively high. Comparing calcite, vaterite, and aragonite samples, aragonite exhibits a high BE, and this is in agreement with a previous study.9 However, the chemical shifts between the Ca2p3/2 core level and the Ca2p1/2 core level from all three polymorphic CaCO3 samples are all around 3.5 eV, giving, as expected, no differentiation among calcite, aragonite and vaterite (Table 2). This demonstrates the accuracy of the binding energy measurement in our instrumentation and lends support to the calcium binding energy shifts noted. The peak widths (FWHM) were also different for the three CaCO3 specimens, ranging from 1.5 to 2.0 eV (Table 2).
Fig. 5.
XPS Ca2p core level spectra of (a) aragonite; (b) vaterite; (c) calcite. Dashed lines shows the fitting results.
Table 2.
XPS parameters for Ca2p, C1s, and O1s core levels from the three calcium carbonate polymorphs. The values shown below are “BE (FWHM).”
| aragonite | calcite | Vaterite | ||
|---|---|---|---|---|
| Ca2p | Ca2p3/2 | 347.9 (1.6) | 346.5 (1.7) | 347.4 (1.9) |
| Ca2p1/2 | 351.5 (1.5) | 350.1 (1.7) | 350.9 (2.0) | |
| peak ratio | 2.2 | 2.1 | 2.1 | |
|
| ||||
| C1s | CxHy | 285.0 (1.8) | 285.0 (1.8) | 285.0 (2.1) |
| CO3 | 289.3 (1.8) | 289.3 (1.8) | 289.3 (2.0) | |
| peak ratio | 3.5 | 2.6 | 2.8 | |
|
| ||||
| O1s | OI | 534.9 (1.8) | 533.9 (1.7) | 534.4 (1.8) |
| Oii | 536.7 (1.6) | 535.6 (1.9) | 536.2 (1.6) | |
| peak ratio | 7.0 | 5.2 | 6.3 | |
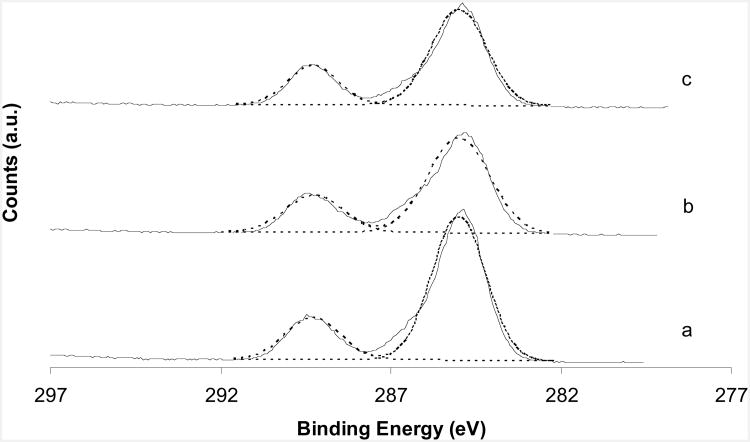
Fig. 6 shows the high resolution spectra of the C1s core levels from the three CaCO3 surfaces. Two clearly resolved peaks are at 285.0 eV (hydrocarbon: CxHy) and 289.3 eV (carbonate: CO3). The differences of shifts between hydrocarbon and carbonate peaks for the three types of CaCO3 are all around 4.3 eV. Thus, there is no chemical difference in the carbon environments in these calcium carbonates. FWHM was also different for the three calcium carbonates, ranging from 1.8 to 2.1 eV (Table 2).
Fig. 6.
XPS C1s core level spectra of (a) aragonite; (b) vaterite; (c) calcite.
Fig. 7 shows the high resolution spectra of O1s core level from the three CaCO3 surfaces. Two peaks appear, labeled as OI and OII. The trend of the OI BE position is same as that of Ca2p3/2, increasing in the order, calcite, vaterite, and aragonite. The peaks appear at 533.9, 534.4, and 534.9 eV, respectively (Table 2). The differences in these BEs is about 0.5 eV, which is different from that seen for the Ca2p3/2 peaks. The peak ratio of OI to OII also varies from 5.2 to 7.0, increasing in the same order of OI BE position.
Fig. 7.
XPS O1s core level spectra of (a) aragonite; (b) vaterite; (c) calcite.
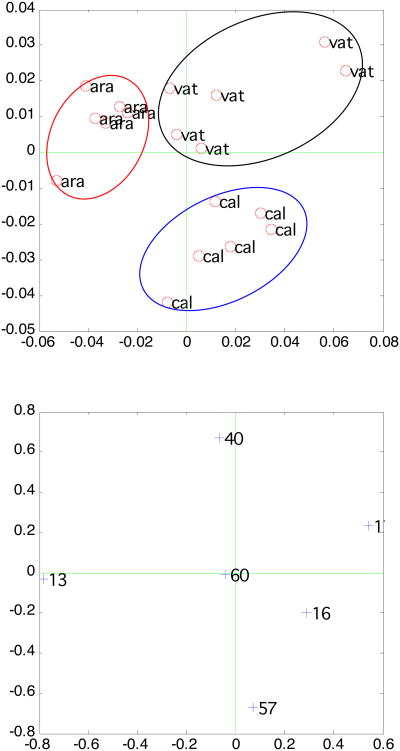
Both positive and negative ion SIMS spectra of all three polymorphic CaCO3 powders were acquired in the m/z of 0-200 range. The characteristic peaks shown in the positive spectra include Ca+ and CaOH+. Impurities such as Na+, K+, and hydrocarbon showed up in the positive ion spectra as well. The characteristic peaks shown in the negative spectra include O−, OH− and CO3−. Impurities such as Cl− and F− also showed up in the negative spectra. To avoid the complexity associated with surface contamination (hydrocarbon, sodium) that is not in any obvious way associated with calcium polymorph differences, we selected the characteristic peaks from both positive and negative spectra and repeated the PCA analysis. The selected peaks are Ca+, CaOH+ peaks from positive spectra and CH−, O−, OH− and CO3− peaks from negative spectra. The PCA analysis results are shown in Figure 8. As can be seen, all three CaCO3 are easily differentiated. This indicates that the normalized intensities of Ca+ (m/z = 40) and CaOH+ (m/z =57) ions have significant coefficients (loadings) in PC1 and PC2.
Fig 8.
Scores and loading plot of PCA results analyzing SIMS data of three calcium carbonate polymorphs.
4. Discussion
The three calcium carbonate phases were synthesized by a solution double decomposition route. Vaterite was synthesized without the use of additives. Instead, it was synthesized by increasing the reaction speed as it is a dynamically favored phase. As discussed in previous literature, increasing the speed of precipitation may assist in the formation of vaterite.17
As can be seen from Figures 1, 2 and 3, we synthesized the three CaCO3 phases, and the crystal structures match well with corresponding standard crystals. All CaCO3 phases can easily be distinguished by XRD. The 2θ peak positions can be used as a fingerprint to identify crystal phases. FTIR uses relatively less material than XRD (∼ 1mg), and the characteristic IR vibrational bands can easily differentiate each CaCO3 phase. As mentioned before, SEM images gave inconclusive results in discriminating between CaCO3 phases. However, a combined analysis using both XRD and FTIR can clearly distinguish CaCO3 bulk phases and can be used as a supplementary tool.
Surface-sensitive methods are needed for phase elucidation on ultrathin CaCO3 films or to examine the interface between CaCO3 implants and tissues. These surface analysis techniques are crucial for understanding the surface structure and surface properties of CaCO3. XPS has also been used to distinguish CaCO3 polymorphs with some success.9 XPS can distinguish different valence of inorganics, for example copper II and copper I due to their different core lectron densities.18 The differences in binding energy for elements in different oxidation states (chermical environments) is also known as a chemical shift as the shift.19 The XPS O(1s) shake-up peaks and Ca/P and O/Ca ratios were applied with success for distinguishing six calcium phosphate (CaP) phases.7 The six CaP phases each have a different chemical formula. Thus, they are relatively easier to be discriminated by XPS. On the other hand, the three CaCO3 polymorphs that share the same chemical formula are much more difficult to be distinguished. But their crystal structures are different. The atomic arrangement is also different on each polymorphic CaCO3 surface, which may lead to chemical environment differences. This enables us to discriminate the three CaCO3 phases from each other by XPS.
As seen in Figure 4, only Ca, C, and O were observed on a calcite surface. An impurity, sodium, was found in the samples of aragonite and vaterite. This impurity may come from sodium carbonate, one of the reactants for CaCO3 synthesis. As aragonite and vaterite are relatively unstable compared to calcite, the synthesized aragonite and vaterite powders were soaked in water for just short times to avoid transforming these to calcite, the most stable phase. On the contrary, calcite powder was digested in water for 12 days. Therefore, most impurities, such as sodium, might be washed away.
The Ca/C ratios were all lower than the theoretical ratio. These surface compositions are only about 80% of the expected bulk concentrations, which means that the sample powders have surface stoichiometries different from their bulk crystal composition. This further suggests that the atomic arrangement is different in the near surface region. As can be seen in Figure 5, the Ca2p3/2 photoelectron BE shifts on calcite, vaterite and aragonite surface are different. The differences between the chemical shifts of the Ca2p3/2 core level among the three CaCO3 phases are clearly significant given the anticipated BE measurement errors (0.2 eV). Calcite has the lowest Ca2p3/2 core level BE, whereas, aragonite has the highest BE. This might be related to the fact that six oxygen atoms surround one calcium atom in a calcite lattice whereas nine oxygen atoms surround one calcium atom in aragonite. This unique feature for CaCO3 samples enables us to differentiate the three CaCO3 phases. For calcium phosphate powders, there is no difference between the shifts of the Ca2p3/2 core level.20
The shift difference between the Ca2p3/2 core level and the Ca2p1/2 core level of all three calcium carbonate samples was 3.5 – 3.6 eV, showing no difference between calcium carbonate phases. All differences were within the ± 0.2 eV uncertainty.
The peak full width at half maximum (FWHM) of the core levels is also different between different CaCO3 phases. The broad feature (FWHM ∼2 eV) of the Ca2p3/2 peak on vaterite indicates that more than one species exists and may be explained by the different synthesis route used. The vaterite was synthesized by fast precipitation and water may be incorporated in the crystal structure. Thus, a calcium hydroxide species may cause the broadened XPS peak. The Ca2p3/2 peaks on calcite and aragonite surfaces were relatively sharp (FWHM1.5– 1.7 eV, Table 2) and indicate reduced or zero hydroxyl species existed.
There was no difference between the shifts of carbonate and hydrocarbon in the C(1s) high resolution spectra. A broad C(1s) peak was also seen on the vaterite surface, which is consistent with Ca (2p) spectra. The broader peaks may also suggest sample charging on the vaterite.
SIMS/PCA was also used to differentiate CaCO3 phases. Although it is also possible to use a few peaks in TOF-SIMS spectra as “fingerprints” for discriminating CaCO3 phases, it is desirable to have a more robust method such as PCA, which is a full-spectrum method. Six replicates were performed on each CaCO3 phase. From scores plots, we could differentiate the CaCO3 phases by clustering SIMS data into three groups. Some characteristic peaks are useful to specifically discriminate CaCO3 phases. Calcite was different from aragonite and vaterite because, (1) there is a more intense CaOH+ peak on calcite and (2) there is a more intense Ca+ peak on aragonite and vaterite. Vaterite has a more intense OH− peak on its surface; whereas, aragonite has a more intense CH− peak. The vaterite surface has a more intense OH− peak, which could indicate water is involved in the vaterite lattice. This result is also in agreement with the broadened features seen in the XPS Ca(2p) and C(1s) peaks. That the aragonite surfaces have a more intense CH− peak may indicate more hydrocarbon species on their surface. This is in agreement with XPS results. As seen in the ratio of CxHy to CO3 in Table 2, more hydrocarbon species (3.5) were found on aragonite compared to vaterite (2.8) and calcite (2.6).
In summary, the surfaces of the three calcium carbonate polymorphs can be well differentiated with a combination of XPS and SIMS. The Ca2p3/2 core level XP spectra can be used for CaCO3 polymorphs identification. Also the O1s could be used to distinguish CaCO3 polymorphs. Similarly, SIMS/PCA can be used to identify different CaCO3 phases based on the analysis of a number of characteristic fragments if appropriate standards are available.
Acknowledgments
We thank Deborah Leach-Scampavia for her help with XPS and TOF-SIMS. This work was supported by NSF EEC-9529161 (UWEB) and NIH RR01296 (NESAC/BIO).
References
- 1.Vuola J. Natural coral and hydroxyapatite as bone substitutes. Helsinki University Central Hospital. :2000. [Google Scholar]
- 2.Mann S. Mineralization in Biological Systems. Structure and Bonding. 1983;54:127–174. [Google Scholar]
- 3.Lucas A, Gaude J, Carel C, Michel JF, Cathelineau G. A synthetic aragonite-based ceramic as a bone graft substitute and substrate for antibiotics. International Journal of Inorganic Materials. 2001;3:87–94. [Google Scholar]
- 4.Damien CJ, Ricci JL, Christel P, Alexander H, Patat JL. Formation of a Calcium Phosphate-Rich layer on Absorbable Calcium Carbonate Bone Graft Substitutes. Calcif Tissue Int. 1994;55:151–158. doi: 10.1007/BF00297191. [DOI] [PubMed] [Google Scholar]
- 5.Grasby SE. Naturally precipitating vaterite (μ-CaCO3) spheres: Unusual carbonates formed in an extreme environment. Geochimica Et Cosmochimica Acta. 2003;67:1659–1666. [Google Scholar]
- 6.Chakrabarty D, Mahapatra S. Aragonite crystals with unconventional morphologies. J Mater Chem. 1999;9:2953–2957. [Google Scholar]
- 7.Lu HB, Campbell CT, Graham DJ, Ratner BD. Surface characterization of hydroxyapatite and related calcium phosphates by XPS and TOF-SIMS. Analytical Chemistry. 2000;72:2886–2894. doi: 10.1021/ac990812h. [DOI] [PubMed] [Google Scholar]
- 8.Baer DR, Blanchard DL, Engelhard MH, Zachara JM. The interaction of water and Mn with surfaces of CaCO3: an XPS study. Surface and Interface Analysis. 1991;17:25–30. [Google Scholar]
- 9.Gopinath CS, Hegde SG, Ramaswamy AV, Mahapatra S. Photoemission studies of polymorphic CaCO3 materials. Materials Research Bulletin. 2002;37:1323–1332. [Google Scholar]
- 10.Long JR, Dindot JL, Zebroski H, Kiihne S, Clark RH, Campbell AA, Stayton PS, Drobny GP. A peptide that inhibits hydroxyapatite growth is in an extended conformation on the crystal surface. Proc Natl Acad Sci USA. 1998;95:12083–12087. doi: 10.1073/pnas.95.21.12083. [DOI] [PMC free article] [PubMed] [Google Scholar]
- 11.Pang P, Deslandes Y, Raymond S, Pleizier G, Englezos P. Surface analysis of ground calcium carbonate filler treated with dissolution inhibitor. Ind Eng Chem Res. 2001;40:2445–2451. [Google Scholar]
- 12.Stipp SL, Kulik AJ, Franzreb K, Benoit W, Mathieu HJ. A combination of SFM and TOP-SIMS imaging for observing local inhomogenieties in morphology and composition: Aged Calcite surfaces. Surface and Interface Analysis. 1997;25:959–965. [Google Scholar]
- 13.Belu AM, Graham DJ, Castner DG. Time-of-flight secondary ion mass spectrometry: techniques and applications for the characterization of biomaterial surfaces. Biomaterials. 2003;24:3635–3653. doi: 10.1016/s0142-9612(03)00159-5. [DOI] [PubMed] [Google Scholar]
- 14.Castner DG, Hinds K, Grainger DW. X-ray photoelectron spectroscopy sulfur 2p study of organic thiol and disulfide binding interactions with gold surfaces. Langmuir. 1996;12:5083–5086. [Google Scholar]
- 15.Ni M, Ratner BD. Nacre surface transformation to hydroxyapatite in a phosphate buffer solution. Biomaterials. 2003;24:4323–4331. doi: 10.1016/s0142-9612(03)00236-9. [DOI] [PubMed] [Google Scholar]
- 16.Feng QL, Pu G, Pei Y, Cui FZ, Li HD, Kim TN. Polymorph and morphology of calcium carbonate crystals induced by proteins extracted from mollusk shell. Journal of Crystal Growth. 2000;216:459–465. [Google Scholar]
- 17.Simkiss K. Variations in the crystalline form of calcium carbonate precipitated from artificial sea water. Nature. 1964;201:492–493. [Google Scholar]
- 18.McElhaney RD, Castner DG, Ratner BD. Characterization of the Poly(ether ether ketone) - Copper interface. In: Sacher E, Pireaux JJ, Kowalczyk SP, editors. Metallization of Polymers. Washington, DC: American Chemical Society; 1990. [Google Scholar]
- 19.Vickerman JC. Surface analysis: the principal techniques. Chichester; New York: John Wiley; 1997. [Google Scholar]
- 20.Chusuei CC, Goodman DW, Van Stipdonk MJ, Justes DR, Schweikert EA. Calcium phosphate phase identification using XPS and time-of-flight Cluster SIMS. Analytical Chemistry. 1999;71:149–153. doi: 10.1021/ac9806963. [DOI] [PubMed] [Google Scholar]


