Abstract
Source-space coherence analysis has become a popular method to estimate functional connectivity based on MEG/EEG. One serious problem is that source-space coherence analysis can be confounded by spurious coherence caused due to the leakage properties of the inverse algorithm employed. Such spurious coherence is typically manifested as an artifactual large peak around the seed voxel, called seed blur, in the resulting coherence images. This seed blur often obscures important details of brain interactions. A novel method of computing coherence, called the residual coherence, is first proposed to remove the spurious coherence caused by the leakage of an imaging algorithm. We then present a theoretical analysis that shows the equivalence between the proposed residual coherence and corrected imaginary coherence proposed by others. We next extend the idea of residual coherence, and propose residual envelope correlation, which is suitable for estimating connectivity from high-frequency brain activities. Results from computer simulations demonstrate the effectiveness of the residual coherence and the residual envelope correlation.
I. INTRODUCTION
There has been tremendous interest in estimating the functional connectivity of neuronal oscillations across brain regions based on magnetoencephalography (MEG) and electroencephalography (EEG). Recently, a number of studies have begun to use source-space connectivity analysis, in which voxel time courses are first estimated by solving the inverse problem and brain interactions are then analyzed using those estimated voxel time courses.
In connectivity analysis, some kind of a measure for the interaction, called connectivity metric, must be computed, and a widely-used measure is coherence[1], [2], [3], [4]. In source-space coherence analysis, a typical procedure involves first setting a reference voxel, called the seed voxel, and computing the coherence between the time courses from the seed voxel and another voxel, referred to as the target voxel. By scanning through all target voxels in a brain, a three-dimensional mapping of source coherence, namely a source coherence image, with respect to the seed voxel can be obtained.
A serious problem in source-coherence imaging arises from spurious coherence caused by the leakage of an inverse algorithm[5] and such leakages are more or less inevitable in any inverse algorithm. One representative ramification of this spurious coherence is an artifactual large peak around the seed voxel, called seed blur, in the coherence image[6]. Quite often, the seed blur dominates the resultant coherence images, and obscures important details of the brain interactions. To remove such spurious coherence, this paper proposes residual coherence, which is the coherence between the seed and the residual signal obtained by regressing out the seed signal from the target signal. We show that this residual coherence is equivalent to the corrected imaginary coherence discussed in [7] and [8].
For high-frequency brain oscillation such as gammaor high-gamma band oscillations, instead of using coherence, envelope correlation is often used to estimate brain connectivity[9]. This is because small time jitters can cause large phase jitters at such high frequency regions and coherence could become very close to zero due to phase jitters. This paper also proposes to compute the envelope correlation between the seed and residual time courses; the envelope correlation computed in this manner is called the residual envelope correlation. We show, in our computer simulation, that an images residual envelope correlation is free from seed blur, which exists in an image of original envelope correlation.
II. METHOD
A. Residual Coherence: Definition
In source-space analysis, voxel spectra are estimated by using an inverse algorithm, and the coherence is computed between these estimated voxel spectra. Let us define the estimated spectra of the seed and the target voxels as σ̂S(f) and σ̂T (f). The estimated coherence η̂ is obtained using
| (1) |
where we omit the explicit notation of (f), the asterisk * indicates the complex conjugation, and 〈·〉 indicates trial averaging. We regress σT using σS, such that
| (2) |
where α is a real-valued multiplicative constant, and v is a residual signal, which plays a key role in this paper. The value for α is determined using
| (3) |
and is derived as
| (4) |
The residual signal is expressed as
| (5) |
The residual coherence η̂R is then obtained using
| (6) |
B. Residual Coherence in the Presence of Algorithm Leakages
Taking the leakage effects of an inverse algorithm into consideration, the estimated spectra, σ̂S and σ̂T, are expressed as
| (7) |
and
| (8) |
After several computation steps, we get
| (9) |
Thus, we get
| (10) |
and
| (11) |
Using the above equations, we can show
| (12) |
where
 (η) and
 (η) are the real and imaginary parts of the true coherence η. The right-hand side does not contain the leakage parameters d1 and d2, and thus the residual coherence η̂R is free from algorithm leakage. Note that the right-most side expression in Eq. (12) is called the corrected imaginary coherence. The corrected imaginary coherence has been derived by extending the theory of canonical coherence by Ewald et al.[7] and also by Pascual-Marqui using arguments on dependence factorization[8].
C. Envelope Correlation
Coherence is sensitive to phase jitters, and this property is problematic when we try to estimate brain interactions from activities at higher frequencies, such as gamma and high-gamma activities. This is because, at high frequencies, a small time jitter could cause a large phase jitter, and coherence could become close to zero even when there is connectivity relationships among brain activities. That is, the coherence is not appropriate as a connectivity metric for estimating brain connectivity at high frequencies. One appropriate metric for such cases is envelope (to envelope) correlation[9]. To compute the envelope correlation, we first convert the seed and target time courses to their analytic signals, such that
| (13) |
In the left-hand side of the above equation,
 [·] indicates an operator that creates an analytic signal of the real-valued time signal in the parenthesis. Let us define analytic signals from the seed- and target-voxel time courses uS(t) and uT (t), such that
| (14) |
and
| (15) |
where AS(t) and AT (t) are the amplitudes of the seed and target analytic signals, and ϕS(t) and ϕT (t) are the (instantaneous) phases. The envelope correlation is the one between the amplitudes, AS(t) and AT (t), and is computed such that
| (16) |
The envelope correlation has been used in the sensor-space analysis. However, when applied to source-space analysis, the spurious correlation (seed blur) problem apparently exists, as shown in our computer simulation.
D. Residual Envelope Correlation
We propose residual envelope correlation, which is free from the problem of seed blur. To compute the residual envelope correlation, we first compute the residual time course uR(t) using
| (17) |
where v(f) is the residual spectrum obtained in Eq. (5). Here, since v(f) is defined only for f ≥ 0, we create the residual spectrum for f < 0, such that
Since the Hermitian symmetry is hold for v(f), uR(t) is a real-valued time course, and the envelope is computed using,
| (18) |
where AR(t) is the residual envelope. Once AR(t) is computed, the residual envelope correlation ΘR is computed using
| (19) |
Since in the residual time course, the seed signal is regressed out, the residual envelope correlation is free from seed blur.
III. COMPUTER SIMULATION
A. Data Generation
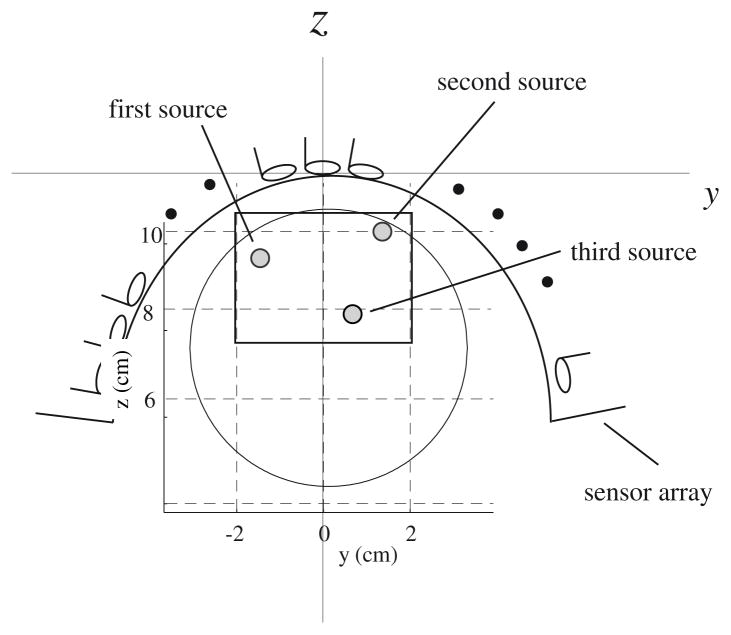
Computer simulation was performed to verify the effectiveness of the proposed methods. A sensor alignment of the 275-sensor array from the Omega™ (VMS Medtech, Coquitlam, Canada) neuromagnetometer was used. The coordinate system and source-sensor configuration used in the computer simulation are depicted in Fig. 1. A single vertical plane (x = 0 cm) was assumed at the middle of the wholehead sensor array, and three sources were assumed to exist on this plane. The (y, z) coordinates of the three sources were (−1.0, 9.5) cm, (1.5, 10.0) cm, and (1.0, 7.5) cm, respectively.
Fig. 1.
The coordinate system and source-sensor configuration used in the computer simulation. The coordinate origin was set at a location 13-cm below the center of the sensor positioned at the array center. The plane at x = 0 cm is shown. The large circle shows the cross-section of the sphere used for the forward calculation, and the small circles show the locations of the three sources. The square shows the region for which imaging results are shown in Figs. 3–6.
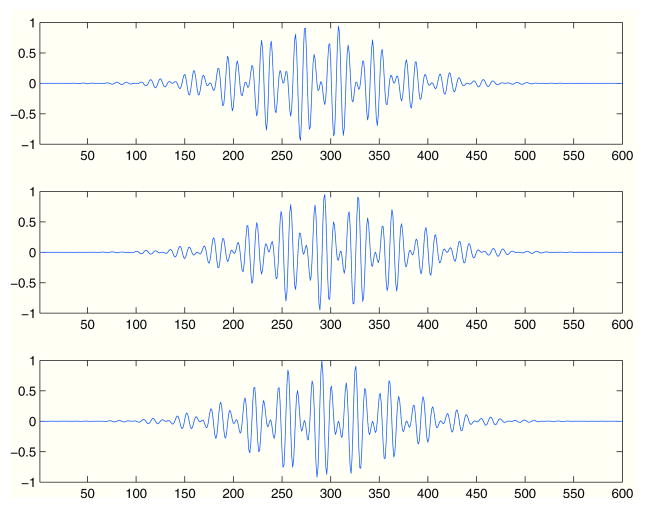
Multiple-trial measurements were simulated, in which a total of 100 trials were generated. Each trial consists of 600 time points. The time courses of the three sources for the first trial are shown in Fig. 2. The time courses simulated gammaband signals with theta-band envelopes. The time courses had, trial-to-trial, source specific time jitters. The time jitters for the three time courses were generated using Gaussian random number with the same standard deviation ω. Two kinds of experiments were performed; the first experiment with a small time jitter and the second experiment with a large time jitter. In the first experiment, the standard deviation ω for the jitter generation was set to 2 time points, and In the second experiment, it was set to 20 time points.
Fig. 2.
The time courses assigned to the three sources in the first trial. The time courses in the top, middle, and bottom panels are those for the first, second, and the third sources. These time courses have trial-to-trial time jitters.
Defining the jth-source time course as uj(t), the signal magnetic recordings bS(t) were computed using
| (20) |
where lj is the lead field vector of the jth source, which was calculated using the spherical homogeneous conductor model [10] with the sphere origin set to (0, 0, 4) cm. The simulated sensor recordings were generated by adding random noise to bS(t). Here, the signal-to-noise ratio was set to 0.5.
B. Coherence Imaging
The voxel spectra were estimated using the narrow-band adaptive beamformer[5][11] with a data-covariance matrix obtained with a gamma frequency band. Here, the data covariance matrix obtained from each trial was averaged across trials, and the averaged covariance matrix was used to compute the beamformer weight. Reconstructed source power images on the plane x = 0 cm are shown in Fig. 3. The three sources are clearly observed. We set a seed point at the second source location to compute coherence images. The seed is marked by asterisks in Fig. 3.
Fig. 3.

Results of source reconstruction on the plane x = 0. The reconstruction was performed using the adaptive beamformer. The asterisks show the location of the seed that was set for computing the coherence images shown in Figs. 3 – 6.
The coherence images from the first experiment (the experiment with a small jitter) are shown in Fig. 4. The left panel shows the magnitude coherence image and the right panel shows the residual coherence image. In the magnitude coherence image, the seed blur dominates and it obscures the other two sources interacting to the seed source. It is indeed difficult to obtain information on the interacting sources from this magnitude coherence image. On the contrary, in the residual coherence image, the intensity of the seed blur is much reduced and the two sources that interact with the second source can clearly be observed.
Fig. 4.
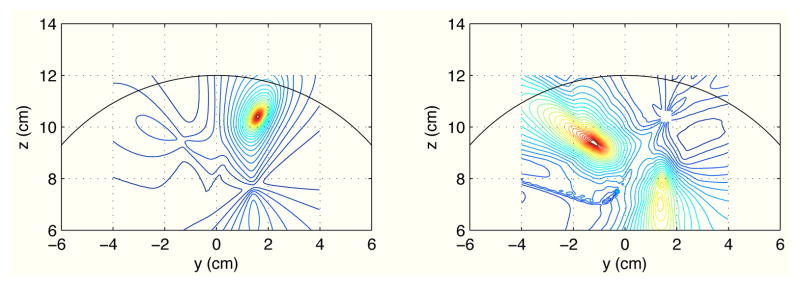
Results of imaging the gamma-band source coherence on the plane x = 0 cm. The seed was set at the second source location. The left panel shows magnitude coherence image, and the right panel shows residual coherence image.
C. Envelope Correlation Imaging
The coherence images from the second experiment (the experiment with a large jitter) are shown in Fig. 5. Since the large time jitter created a large phase jitter, neither the magnitude or residual coherence images contain meaningful connectivity relationships. The results indicate that the coherence is not appropriate as a metric to estimate the connectivity from high-frequency activities.
Fig. 5.
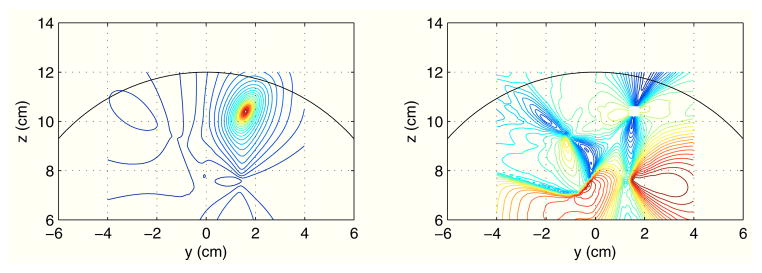
Results of imaging the gamma-band source coherence on the plane x = 0 cm. The seed was set at the second source location. The left panel shows magnitude coherence image, and the right panel shows residual coherence image.
Next, envelope-correlation imaging was performed. The results are shown in Fig. 6 in which the right panel shows the image of the original envelope correlation and the left panel shows that of the proposed residual envelope correlation. In both images, the first and the third sources that were interacting with the second (seed) sources can be observed. While the original envelope correlation image contains seed blur, the residual envelope correlation image is free from such spurious activity, demonstrating the effectiveness of the proposed residual envelope correlation.
Fig. 6.
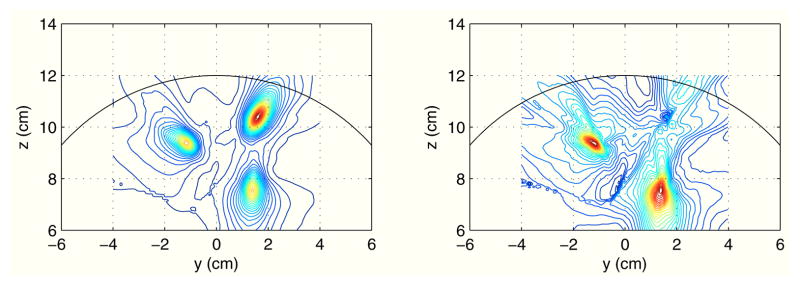
Results of imaging envelope correlation on the plane x = 0 cm. The seed was set at the second source location. The left panel shows an image of (original) envelope correlation, and the right panel shows an image of proposed residual envelope correlation.
In summary, this paper has proposed two kinds of novel metrics for estimating brain connectivity in source space; the residual coherence and the residual envelope correlation. Both of the two metrics are effective in removing seed blur, which is spurious coherence caused by the leakage properties of the inverse algorithm. The effectiveness of the proposed connectivity metrics was demonstrated by computer simulations.
References
- 1.Gross J, Kujara J, Hämäläinen M, Timmermann L, Schnitzler A, Salmelin R. Dynamic imaging of coherent sources: Studying neural interactions in the human brain. Proc Natl Acad Sci USA. 2001;98:694–699. doi: 10.1073/pnas.98.2.694. [DOI] [PMC free article] [PubMed] [Google Scholar]
- 2.Guggisberg AG, Honma SM, Findlay AM, Dalal SS, Kirsch HE, Berger MS, Nagarajan SS. Mapping functional connectivity in patients with brain lesions. Annals of Neurology. 2007;63:193–203. doi: 10.1002/ana.21224. [DOI] [PMC free article] [PubMed] [Google Scholar]
- 3.Miltner WHR, Braun C, Arnold M, Witte H, Taub E. Coherence of gamma-band EEG activity as a basis for associative learning. Nature. 1999;397:434–436. doi: 10.1038/17126. [DOI] [PubMed] [Google Scholar]
- 4.Nunez PL, Srinivasan R, Westdorf AF, Wijesinghe RS, Tucker DM, Silberstein RB, Cadusch PJ. EEG coherency I: statistics, reference electrode, volume conduction, Laplacians, cortical imaging, and interpretation at multiple scale. Electroenceph Clin Neurophysiol. 1997;103:499–515. doi: 10.1016/s0013-4694(97)00066-7. [DOI] [PubMed] [Google Scholar]
- 5.Sekihara K, Nagarajan SS. Adaptive spatial filters for electromagnetic brain imaging. Berlin, Heidelber: Springer-Verlag; 2008. [Google Scholar]
- 6.Sekihara K, Owen JP, Trisno S, Nagarajan SS. Removal of spurious coherence in MEG source-space coherence analysis. IEEE Trans Biomed Eng. 2011;58:3121–9. doi: 10.1109/TBME.2011.2162514. [DOI] [PMC free article] [PubMed] [Google Scholar]
- 7.Ewald A, Marzetti L, Zappasodi F, Meinecke FC, Nolte G. Estimating true brain connectivity from EEG/MEG data invariant to linear and static transformations in sensor space. NeuroImage. 2012;60:476–488. doi: 10.1016/j.neuroimage.2011.11.084. [DOI] [PubMed] [Google Scholar]
- 8.Pascual-Marqui RD. Instantaneous and lagged measurements of linear and nonlinear dependence between groups of multivariate time series:frequency decomposition. ArXiv documents:0711.1455. URL: http://arxiv.org/abs/0711.1455.
- 9.Bruns A, Eckhorn R. Task-related coupling from high- to low-frequency signals among visual cortical areas in human subdural recordings. International Journal of Psychophysiology. 2004;51:97–116. doi: 10.1016/j.ijpsycho.2003.07.001. [DOI] [PubMed] [Google Scholar]
- 10.Sarvas J. Basic mathematical and electromagnetic concepts of the biomagnetic inverse problem. Phys Med Biol. 1987;32:11–22. doi: 10.1088/0031-9155/32/1/004. [DOI] [PubMed] [Google Scholar]
- 11.Dalal SS, Guggisberg AG, Edwards E, Sekihara K, Findlay AM, Canolty RT, Berger MS, Knight RT, Barbaro NM, Kirsch HE, Nagarajan SS. Five-dimensional neuroimaging: Localization of the time-frequency dynamics of cortical activity. NeuroImage. 2008;40:1686–1700. doi: 10.1016/j.neuroimage.2008.01.023. [DOI] [PMC free article] [PubMed] [Google Scholar]


