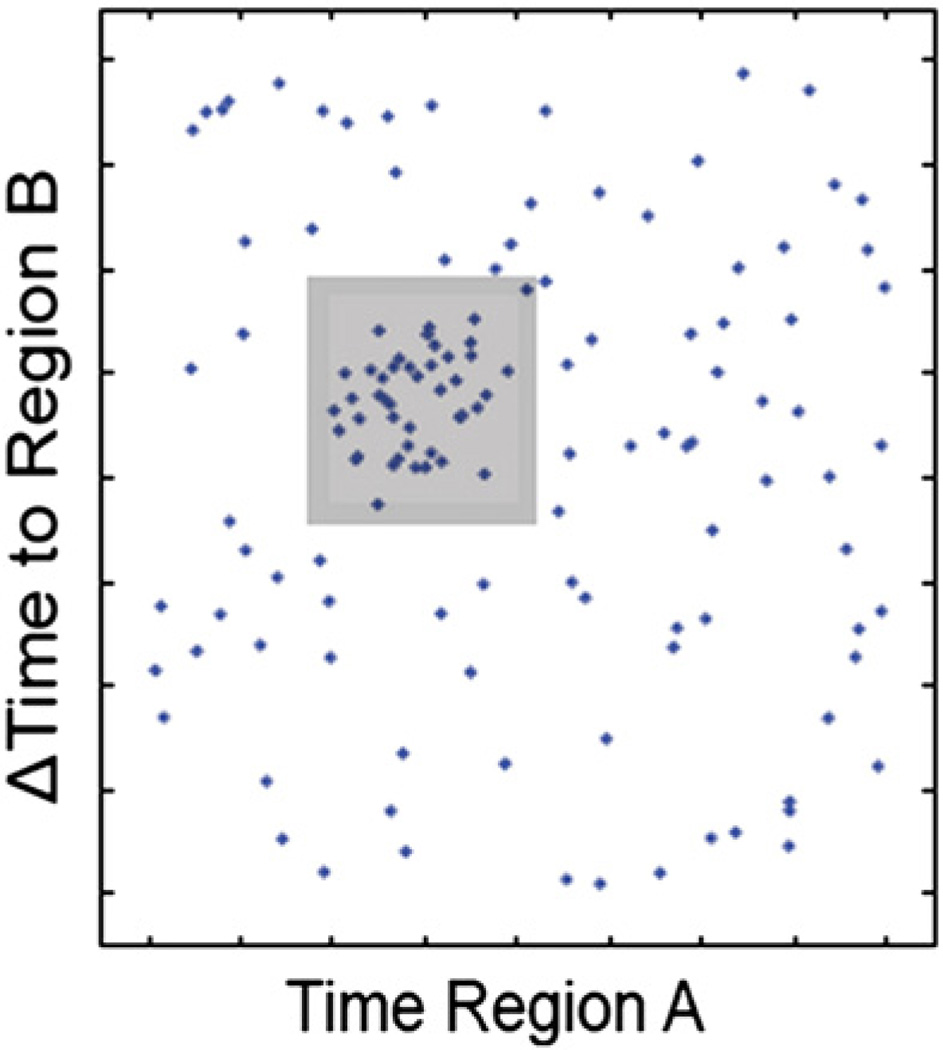
Fig. 3.
Shown is a bi-regional point plane, the X and Y axes of which represent latencies of individual salient events and inter-event intervals, respectively. A sliding adjustable rectangular window searches for clusters containing a minimum number of subjects. A cluster within the plane defines an event pair satisfying both absolute and relative time constraints. For further details see text.
Reproduced from Fig. A1 in Shahaf et al. (2012).

