

Abstract
Mitochondria peroxy yellow 1 (MitoPY1) is a small-molecule fluorescent probe that selectively tracks to the mitochondria of live biological specimens and responds to local fluxes of hydrogen peroxide (H2O2) by a turn-on fluorescence enhancement. This bifunctional dye uses a triphenylphosphonium targeting group and a boronate-based molecular switch to selectively respond to H2O2 over competing reactive oxygen species (ROS) within the mitochondria. MitoPY1 can be used to measure mitochondrial H2O2 levels in both cell culture and tissue models. In this protocol, we describe the synthesis of MitoPY1 and how to use this chemical tool to visualize mitochondrial H2O2 in live cells. The preparation of MitoPY1 is anticipated to take 7–10 d, and assays involving microscopy of cultured mammalian cells can be performed in 1–2 d.
INTRODUCTION
ROS modulate a variety of disparate pathological and physiological events in biological systems, including growth factor signaling1, wound healing2, stem cell maintenance and neurogenesis3,4, and circadian rhythm5,6. Whether a particular ROS acts as a physiological signaling molecule or a mediator of oxidative stress and disease depends both on its identity and its location within the cell7–9. Mitochondria are a primary source of endogenous cellular H2O2, a particularly important ROS10–13. This is primarily because of the inherent ‘leakiness’ of the electron transport chain, meaning that the reduction of molecular oxygen to water is imperfect and rogue reducing equivalents can escape and react with O2 to form superoxide, which is quickly reduced to H2O2 (ref. 14). In line with recently uncovered roles for physiological processes mediated by mitochondrial redox changes including growth signaling and neuronal firing15–17, new methods for detecting ROS in this specific locale have been developed18, including small-molecule19–21 and protein-based fluorescent sensors (refs. 22–26 and Table 1).
Table 1.
Advantages and limitations of different fluorescence-based methods for mitochondrial ROS detection.
| Tool | Application | Pros | Cons | Ref. |
|---|---|---|---|---|
| MitoSOX | Detection of nonspecific mitochondrial ROS levels, detection of superoxide specifically using selective excitation |
Sensitive to many ROS, yet can achieve conditional superoxide specificity, visible excitation and emission for general ROS, does not require transfection |
Irreversible, requires sophisticated imaging techniques to image superoxide specifically, superoxide- specific excitation requires near-UV light, and subsequent photostability issues can lead to false positives |
19 |
| MitoHR/MitoAR | Detection of mitochon- drial highly reactive oxygen species, including hydroxyl radical, peroxynitrite and hypochlorite |
Specific for a small class of ROS, visible excitation and emission, does not require transfection, photostability limits false positives |
Irreversible, does not detect only one specific ROS |
20 |
| MitoPY1 | Detection of mitochon- drial H2O2 |
H2O2 specificity, compatible with other boronate-based dyes targeted to various locales, visible excitation and emission, does not require transfection, photostability limits false positives |
Irreversible, relatively slow kinetics | 21 |
| Protein-based sensors |
Detection of various ROS in multiple organelles |
Variable specificities for ROS, genetically targetable to any organelle, does not require addition of exogenous small molecules, good for long-term monitoring of redox state, reversible |
Require transfection, generally rely on cysteine oxidation, expression of redox-active proteins over long periods of time may alter redox state of system |
22 – 26 |
Our laboratory has used the H2O2-mediated conversion of aryl boronates to phenols as a general strategy to construct a variety of small-molecule probes that respond selectively to endogenous H2O2 over other competing ROS4,27–32. This protocol describes a recipe-style preparation of MitoPY1 (Fig. 1a), a first-generation H2O2-specific fluorophore for detecting this specific ROS within the mitochondria of living systems21, as well as a procedure for imaging mitochondrial H2O2 in cultured cells.
Figure 1.

Mitochondria Peroxy Yellow 1 (MitoPY1). (a) Scheme for the synthesis. (b) Scheme showing H2O2-mediated activation of MitoPY1.
MitoPY1 is a bifunctional molecule that combines a boronate-masked xanthene fluorophore scaffold for selective H2O2 detection and a triphenylphosphonium targeting group for mitochondrial localization, taking advantage of the organelle-specific proton gradient33–35. H2O2-mediated boronate to phenol conversion of MitoPY1 triggers subsequent opening of the bottom-ring lactone to expose a fully conjugated xanthene fluorophore that is brightly fluorescent (Fig. 1b). MitoPY1 selectively and efficiently localizes to the mitochondria of a variety of common mammalian cell lines, where it can respond to local changes in H2O2 levels with a turn-on fluorescence increase. MitoPY1 is capable of visualizing mitochondrial H2O2 generation triggered by the small-molecule oxidative stress inducer paraquat. In addition, MitoPY1 has recently been used to detect endogenous H2O2 in various cell culture models36,37, as well as to measure mitochondrial H2O2 levels in tissue isolates of the rat renal medullary thick ascending limb38. These studies revealed that sodium uptake results in increased mitochondrial H2O2 production, suggesting a link between hypertension and oxidative stress. Advantages of MitoPY1 include ROS specificity, organelle-specific detection, visible excitation and emission, the ability to use this probe simultaneously with boronate-based probes targeted to other organelles, and the ability to use this technique in tissues and perhaps whole organisms without the need for transfection. Drawbacks include the irreversible reaction with H2O2, slower than optimal reaction kinetics and the current availability of only a single emission color.
The synthetic procedure is described on the 100-mg scale to yield MitoPY1 in the 10-mg range, which is sufficient for many biological assays. However, we have found that this synthetic procedure is scalable, such that compounds 1, 2 and 3 can be made on the gram scale, yielding hundreds of milligrams of MitoPY1 without any issues. In addition, this synthetic procedure may be applied to create other mitochondrion-localized bifunctional fluorescent probes. The fluorescent scaffold used permits the mitochondrion-targeting triphenylphosphonium group to be added at the final stage of the synthesis, so that many reactions could potentially be used to apply other protecting or sensing groups onto the phenol of compound 1 or at the triflate position of compound 2.
In the procedure below, we describe an example experiment using adherent mammalian cells grown on coverslips. We recommend using three replicates for each treatment type. Conditions that would be expected to affect H2O2 concentration are applied after addition of MitoPY1 to the medium. For a positive control, we recommend treating cells with H2O2 (Step 53). If desired, a mitochondrion-specific control dye can be added simultaneously with the MitoPY1 solution at Step 51 in order to confirm the expected localization of the MitoPY1 signal.
For each cell type, an initial experiment should be performed to determine the most appropriate length of time to incubate the cells with MitoPY1 before applying the conditions affecting H2O2 concentration. This time interval depends on the baseline H2O2 production of the cell type and the dye uptake properties of the specific cell or tissue type.
The approaches described here have been found to be useful in detecting mitochondrial levels of H2O2 in a variety of human cell lines and tissue samples. One caveat is that peroxynitrite could also deprotect the boronate group if it is present at sufficient concentrations, but this species is typically present at much lower levels than peroxide39; nevertheless, proper controls must always be done to fully validate the presence of H2O2 in a biological system. Common controls include administering antioxidants such as N-acetylcysteine, general flavin inhibitors such as diphenyleneiodonium and H2O2-specific scavengers such as catalase; another control is to genetically manipulate the putative source of the H2O2. In addition, because the fluorescence signal is influenced by probe uptake, intracellular reaction rate and intracellular concentration of H2O2, quantification of the endogenous concentration of H2O2 is challenging. The data obtained using MitoPY1 are therefore best used in relative terms (i.e., control versus stimulated, disease versus healthy) unless extensive calibrations have been performed in a given biological model.
Multiple images taken in various fields should be acquired for each condition and experiments should be repeated at least in triplicate to obtain average fluorescent intensities under various conditions. Alternatively, once microscopy has been used to validate the localization of MitoPY1 in each new biological model, flow cytometry can be implemented to quantify the average fluorescent intensity under various conditions. We anticipate that a similar protocol should also be adequate for use in transparent organisms such as zebrafish embryos or Caenorhabditis elegans, as related boronate-based fluorescent probes have been shown to work in vivo32.
MATERIALS
REAGENTS
 All chemicals and reactions used in this protocol are potentially harmful, and thus a lab coat, gloves and eye protection should be used.
(4-Iodobutyl)triphenylphosphonium (IBTP), prepared as described elsewhere40
2-(2,4-Dihydroxybenzoyl)benzoic acid, prepared as described elsewhere41
1-(3-Hydroxyphenyl)-piperazine (Sigma-Aldrich, cat. no. 651672)
N-phenyl-bis(trifluoromethanesulfonamide) (Sigma-Aldrich, cat. no. 295973)
Trifluoroacetic acid (TFA; Sigma-Aldrich, cat. no. T6508)
Fmoc-Cl (Sigma-Aldrich, cat. no. 160512)
Pd(dppf) Cl2 · CH2Cl2 (Sigma-Aldrich, cat. no. 379670)
Piperidine (Sigma-Aldrich, cat. no. 104094)
Bis(pinacolato)diboron (Sigma-Aldrich, cat. no. 473294)
Potassium acetate (Sigma-Aldrich)
Hydrogen peroxide, 30% (wt/vol) (H2O2; Sigma-Aldrich)
Silica gel 60
Sodium sulfate
Sodium carbonate (Na2CO3; Sigma-Aldrich)
Sodium bicarbonate (NaHCO3; Sigma-Aldrich)
DMSO, HPLC grade (EMD)
Ethyl acetate for chromatography (Fisher Scientific)
Hexanes for chromatography (Fisher Scientific)
Methanol for chromatography (Fisher Scientific)
Dichloromethane for chromatography (Fisher Scientific)
Diethyl ether (anhydrous; Fisher Scientific)
Toluene (anhydrous; Fisher Scientific)
Acetonitrile (distilled from CaH2)
N,N-Dimethyl formamide (DMF; anhydrous; SureSeal, Sigma-Aldrich)
Millipore-purified water
DMEM (Invitrogen)
Glutamine (Sigma-Aldrich)
FBS (Sigma-Aldrich)
Poly-l-lysine (Sigma-Aldrich)
Dulbecco’s phosphate-buffered saline (DPBS; Sigma-Aldrich)
Cells for imaging experiments (see Reagent Setup)
EQUIPMENT
Heavy-walled pressure flasks (50–200 ml) and caps
Heavy-walled pressure tube (15 ml) and cap
Hot plate magnetic stirrer with contact thermometer oil bath
Blast shield
Dual nitrogen-vacuum manifold with vacuum pump (or, alternatively, another source of either nitrogen or argon)
Electric oven
Rotary evaporator
Rotary evaporator vial adaptor (VWR, cat. no. CG-1318)
Erlenmeyer flasks (100–500 ml)
Beakers (100–500 ml)
Single-neck, round-bottomed flasks (50–300 ml)
Schlenk tube, 15 ml
Disposable scintillation vials, 20 ml
Needles
Syringes
Aluminum foil
Büchner funnel
Fritted filter
Stir bars of various sizes
Rubber septae
Fluted filter paper
Columns for chromatography
Separatory funnels (100–300 ml)
Graduated cylinders
Disposable glass Pasteur pipettes
Pipette bulbs
Analytical thin-layer chromatography (TLC) plates (250-μm thickness)
Inert-atmosphere glove box (or, alternatively, a glove bag)
Microwave reactor
PCR strips with caps
Desiccator with vacuum manifold
Desiccant
Ziploc bags
Cell culture plates, 24 wells
Coverslips, 18 mm
Petri dishes, 35 mm
Fluorescence microscope
REAGENT SETUP
Cells for imaging, grown on glass coverslips
Grow cells for imaging on glass coverslips in medium in a 24-well plate, coating the coverslips with the matrix most appropriate for the cell lines. Mammalian cell lines HEK 293T, Cos-7, HeLa and CHO.K1 are typically used. A representative example of cell culturing is as follows: briefly, HEK 293T cells were cultured in DMEM supplemented with 10% (vol/vol) FBS and glutamine (2 mM). The day before imaging, cells were passaged and plated in 18-mm glass coverslips coated with poly-l-lysine (50 μg ml−1) in each well of a 24-well plate. Adherent cells for imaging were grown to 50–80% confluency.
EQUIPMENT SETUP
Petri dishes
In our laboratory, the cells on the coverslips were transferred to Petri dishes and were analyzed using water-immersion microscope objectives; this protocol can be readily adapted to coverslip holders and inverted microscopes with oil-based objectives or any other culturing technique for preparing cells, tissues or organisms for visualization by microscopy. Medium containing serum and phenol red should be avoided.
PROCEDURE
synthesis of Fmoc-piperazinerhodol (1)  10–12 h, plus purification
1∣ Inspect a heavy-walled pressure flask and cap for cracks or breaks, and ensure that the threaded Teflon cap with o-ring seals well.
 Ensure that the pressure flask is completely intact in order to avoid explosion.
2∣ To the flask, add 1.24 g (4.8 mmol, 1.0 eq.) of 2-(2,4-dihydroxybenzoyl)benzoic acid and 853 mg (4.8 mmol, 1.0 eq.) of 1-(3-hydroxyphenyl)-piperazine. Add a magnetic stir bar that can rotate freely in the flask.
3∣ Dissolve the contents of the flask in ~20 ml of TFA.
 TFA is corrosive and volatile and should be handled in a fume hood.
4∣ Firmly screw the Teflon cap with o-ring into place to ensure that the pressure flask is completely sealed.
5∣ Securely attach the flask with a clamp into a room temperature (20–25 °C) oil bath placed on a temperature-controlled heating element with stirrer.
6∣ Before turning on any heat, place a blast shield around the heating element.
 For safety concerns, make sure that if the heavy-walled flask were to rupture, no contents would be able to spray out past the blast shield.
7∣ Heat the oil bath to 95 °C while stirring the flask.
8∣ After 3 h, turn off the heating element and allow the reaction to cool to room temperature.
9∣ Once the mixture is completely cool, remove the flask from the oil bath and carefully remove the cap.
10∣ Add 300 ml of diethyl ether and a stir bar to a 500-ml beaker.
11∣ While the diethyl ether is vigorously stirring, slowly pour the contents of the heavy-walled flask into the diethyl ether. A red precipitate should form.
12∣ Filter the diethyl ether though a medium fritted filter using low vacuum.
13∣ Once the liquid phase has passed through the frit, immediately turn off the vacuum and begin dissolving the solid filtrate in methanol.
 Probably because of the presence of residual TFA, the solid precipitate will begin to form an oil immediately after filtering, which is why it is important to dissolve the solid into methanol immediately after filtration is complete.
14∣ Transfer the methanol solution into a 500-ml round-bottomed flask and dry it under reduced pressure using a rotary evaporator and a heated water bath. After all of the solvents have been removed, a red solid should remain. This crude product can then be stored at room temperature and will be used for the following reaction without further purification.
15∣ Dry a 15-ml Schlenk tube containing a magnetic stir bar in an electric oven at 130 °C for at least 4 h.
16∣ Begin the flow of N2 to flush air from the N2 line. Remove the dry 15-ml Schlenk tube from the oven with a magnetic stir bar from Step 15, and while it is still hot attach the N2 line to the tube. Attach a rubber septum to the Schlenk tube and insert a needle into the septum. Open the valve on the Schlenk tube to cool the reaction vessel under a flow of N2.
17∣ After the glassware has cooled to room temperature, add 1.09 g of the crude product from Step 14, 845 mg (3.27 mmol, 0.68 eq.) of Fmoc-Cl and 686 mg (8.16 mmol, 1.7 eq.) of NaHCO3 while continuing the flow of N2. Re-seal the tube with the septum, add 20 ml of anhydrous acetonitrile with a needle and syringe, and stir the reaction mixture at room temperature under an atmosphere of N2.
18∣ After 3 h, pour the reaction mixture into a separatory funnel and add 100 ml of ethyl acetate. Shake and separate the layers and wash the organic layer three times with water (100 ml each wash) and once with NaCl brine (100 ml), shaking and separating as before.
19∣ Take the organic layer and dry it over ~10 g of anhydrous sodium sulfate for 10–15 min, allowing the solution to stand with occasional agitation until it is completely translucent and the solid sodium sulfate moves freely in the flask. Gravity-filter the mixture through fluted filter paper and remove the solvent by rotary evaporation.
20∣ Purification by silica gel column chromatography (column diameter: 5–8 cm; silica gel column height: 25–40 cm) using 1:1 hexanes/ethyl acetate as an eluent yields 654 mg of compound 1 as a red solid in ~39% overall yield. Rf compound 1 = 0.33 (50% ethyl acetate in hexanes); it appears bright red on a silica gel TLC plate after allowing it to stand for 5 min.
The identity and purity of the compound can be established by proton NMR spectroscopy (1H NMR), carbon NMR spectroscopy (13C NMR) and mass spectrometry (MS).  The product can be stored in the dark at −20 °C for at least a week, but it should generally be used in the next step as soon as possible.
Synthesis of Fmoc-piperazinerhodoltriflate (2)  24 h, plus purification
21∣ Dry the 15-ml Schlenk tube and a magnetic stir bar overnight in an electric oven at 130 °C.
22∣ Cool the glassware under a flow of N2 as described in Step 16.
23∣ To the Schlenk tube, add 400 mg (0.64 mmol, 1.0 eq.) of compound 1, 458 mg (1.28 mmol, 2.0 eq.) of N-phenyl bis(trifluoromethanesulfonamide) and 340 mg (3.21 mmol, 5.0 eq.) of Na2CO3.
24∣ Seal the tube with a rubber septum and add 8 ml of anhydrous DMF by a needle and syringe.
25∣ Stir the reaction mixture overnight (10–12 h) at room temperature under an atmosphere of N2, with the Schlenk tube covered with aluminum foil to exclude light.
26∣ Pour the reaction into a separatory funnel and add 100 ml of ethyl acetate. Shake and separate the layers and wash the organic layer three times with water (100 ml each wash), shaking and separating as before.
27∣ Take the organic layer, dry it over ~10 g of sodium sulfate for 10–15 min, gravity-filter it through fluted filter paper and remove the solvent by rotary evaporation.
28∣ Purify the product by silica gel column chromatography (column diameter: 3–5 cm; silica gel column height: 30–45 cm) using 1:1 hexanes/ethyl acetate as an eluent. This should yield 222 mg of compound 2 as a white solid in 46% yield. Rf compound 2 = 0.69 (50% ethyl acetate in hexanes); the product spot is faintly red, after allowing it to stand for 5–10 min. The identity and purity of the compound can be established by 1H NMR, 13C NMR and MS.
 At this point, the solid can be stored in the dark at −20 °C for at least 3–6 months.
Synthesis of Fmoc-piperazinerhodolboronate (3)  8–12 h, plus purification
29∣ Dry the 15-ml pressure tube and a magnetic stir bar overnight in an electric oven at 130 °C.
30∣ Bring compound 2, Pd(dppf) Cl2·CH2Cl2, bis(pinacolato)diboron, potassium acetate, anhydrous toluene and the 15-ml pressure tube and threaded Teflon cap with o-ring into an inert-atmosphere glove box. Alternatively, an inert-atmosphere glove bag should be sufficient to keep O2 and H2O out of the subsequent steps.
31∣ While working in the glove box, add 222 mg (0.29 mmol, 1.0 eq.) of compound 2, 68 mg of Pd(dppf) Cl2·CH2Cl2 (0.08 mmol, 0.25 eq.), 74 mg of bis(pinacolato)diboron (0.29 mmol), 1.0 eq.), 82 mg (0.80 mmol, 2.8 eq.) of potassium acetate and 10 ml of anhydrous toluene to the pressure tube. Seal the tube tightly with the cap and bring the reaction vessel out of the glove box.
32∣ Heat the tube in a temperature-controlled microwave reactor for 4 h at 110 °C.
33∣ After the reaction has cooled to room temperature, carefully open the pressure tube and dilute the reaction with 50 ml of dichloromethane, transfer all of the contents to a 100-ml round-bottomed flask and then remove the solvents by rotary evaporation.
34∣ Purify the product by silica gel column chromatography (column diameter: 1–3 cm; silica gel column height: 20–30 cm) using 1:1 hexanes/ethyl acetate as an eluent. This should result in 151 mg of compound 3 as a white solid in 74% yield. Rf compound 3 = 0.69 (50% ethyl acetate in hexanes); immediately after running the TLC plate, the product spot is colorless but turns bright red on the silica gel TLC plate after allowing it to stand for 5 min. The identity and purity of the compound can be established by 1H NMR, 13C NMR and MS.
 At this point, the solid can be stored in the dark at −20 °C for at least 1–2 months.
Synthesis of MitoPY1 (4)  36–48 h, plus purification
35∣ Add 35 mg (48 μmol, 1.0 eq.) of compound 3 to a 20-ml scintillation vial and dilute the reaction with 5 ml of a 15% (vol/vol) piperidine solution in acetonitrile. Cover the reaction with aluminum foil to protect it from light.
36∣ After stirring the reaction for 30 min at room temperature, remove the solvent by rotary evaporation using the vial adaptor.
37∣ Move the scintillation vial containing dry, Fmoc-deprotected compound 3 plus containers holding the other required reagents and equipment—IBTP, sodium bicarbonate, degassed anhydrous acetonitrile and a scintillation vial cap—into an inert-atmosphere glove box. The dry reagents can be preloaded into the vial, but the solvent should be added separately in the glove box. Generally, we store the dry components in the glove box to ensure that they stay dry.
38∣ Add 55 mg (96 μmol, 2.0 eq.) of IBTP, 30 mg (240 μmol, 5.0 eq.) of sodium bicarbonate, 5 ml of anhydrous acetonitrile and a stir bar to the scintillation vial containing Fmoc-deprotected compound 3. Cover the reaction vessel with aluminum foil and stir it at room temperature in the inert-atmosphere glove box.
 We have found that the triphenylphosphonium group is prone to degradation during the course of this particular reaction if it is exposed to atmospheric oxygen and/or H2O, which is why we attempt to keep the reaction as oxygen-free and H2O-free as possible. This reaction could also potentially be run in a Schlenk tube using standard air-free technique or an inert-atmosphere glove bag, as long as care is taken to keep oxygen out of the reaction.
39∣ After 24 h, remove the reaction vessel from the glove box, gravity-filter the mixture through fluted filter paper and remove the solvent by rotary evaporation.
40∣ Purify the product by silica gel column chromatography (column diameter: 1–3 cm; silica gel column height: 20–30 cm) using 4.5:4.5:1 dichloromethane/ethyl acetate/methanol as an eluent. This should result in 35 mg of MitoPY1 as a light pink solid in 76% yield. Rf compound 4 = 0.59 (4.5:4.5:1 dichloromethane/ethyl acetate/methanol). Because of boronate deprotection on silica gel, the product may not be readily detectable by TLC, and an additional analytical technique such as liquid chromatography–mass spectrometry (LC-MS) should be used to confirm the presence of the product. The identity and purity of the compound can be established by 1H NMR, 13C NMR, MS and spectroscopic measurements (Fig. 2).
Figure 2.
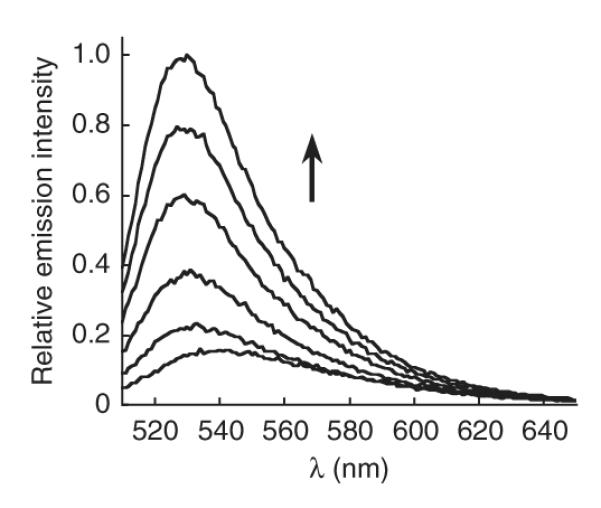
Fluorescence turn-on response of 5 μM MitoPY1 to H2O2. Time points represent 0, 5, 15, 30, 45 and 60 min after the addition of 100 μM H2O2. Excitation at 503 nm.
 The column should be run as quickly as possible, as the boronate group is prone to degradation when it is left on silica for too long.

 At this point, the solid can be stored in the dark at −20 °C for months. We recommend storing the product in a vial within a Ziploc bag containing desiccant.
Preparation of dry MitoPY1 stocks  12–16 h
41∣ Prepare a 5 mM stock of MitoPY1 (MW 863 g mol−1, assuming Cl− counterion) by dissolving 4.3 mg of MitoPY1 per ml of methanol solvent. Alternatively, if the yield of the product is too low to provide an accurate mass measurement, the molar extinction coefficient of MitoPY1 can be used (510 nm, ε = 14,200 M−1 cm−1). In this case, stock solutions of MitoPY1 can be checked for concentration by dissolving 1 μl of the stock into 1 ml of HEPES and measuring the absorbance. The stock can then be corrected on the basis of these measurements until the concentration is accurate.
42∣ Aliquot out the solution into PCR tubes in 20-μl portions.
43∣ Remove the solvent from the tubes by placing them in a desiccator under weak vacuum overnight, protected from light. Seal the PCR tubes and store them in a Ziploc bag with desiccant at −20 °C.
 Dry stocks of MitoPY1 can be stored for months in the dark at −20 °C.
Validation of MitoPY1 activity  2–6 h
2–6 h
-
44∣ Remove an aliquot of dry MitoPY1 from the freezer and allow it to warm to room temperature. Dilute the contents with 20 μl of DMSO to make a 5 mM stock solution.
 Once diluted, the MitoPY1 solution should be used the same day owing to potential degradation of the boronate.
 45∣ Make 2 ml of a 5 μM MitoPY1 stock in DPBS by adding 2 μl of MitoPY1 to 2 ml of DPBS and mixing the contents. Split the solution into two separate 1-ml portions.
46∣ Make a 100 mM stock solution of H2O2 by adding 11 μl of 30% (wt/vol) H2O2 into 989 μl of H2O. Treat one portion of the MitoPY1 solution from Step 36 as a positive control by adding 1 μl of the 100 mM H2O2 stock to obtain a final concentration of 100 μM H2O2 and add 1 μl of H2O to the other portion as a negative control.
47∣ Immediately begin reading the fluorescence intensity of both the positive and negative control samples using a fluorimeter, exciting them with 503-nm light and either collecting an emission spectra or collecting at 530 nm, depending on the capabilities of the instrument. Alternatively, a plate reader can be used to monitor the course of the reaction, so long as the sensitivity of the instrument is adequate. The H2O2-treated positive control sample should increase in fluorescence intensity over time (Fig. 2), whereas the negative control should remain constant.

MitoPY1 labeling of live cells  variable; 30–90 min
-
48∣ Remove an aliquot of dry MitoPY1 from the freezer and allow it to warm to room temperature. Dilute the contents with 20 μl of DMSO to make a 5 mM stock solution.
 Once diluted, the MitoPY1 solution should be used the same day.
 49∣ Make 2 ml of a 10 μM solution of MitoPY1 in DPBS by adding 4 μl of MitoPY1 to 2 ml of DPBS and mixing.
50∣ Remove the 24-well plate of cells from the incubator and remove the cell growth medium from two of the wells. Add 1 ml of the 10 μM MitoPY1 DPBS solution to each well, and place the plate of cells back into the incubator.
 A mitochondrion-specific control dye, such as the MitoTracker series, can be added simultaneously with MitoPY1. We have generally found that MitoTracker Deep Red at 25–100 nM is most compatible with MitoPY1, as it is red-shifted relative to MitoPY1 and does not produce a substantial amount of ROS upon illumination.
51∣ After 15–90 min, depending on the rate of dye uptake of the cell type being used, remove the 24-well plate of cells from the incubator. Wash the wells by removing the MitoPY1 solution and replacing it with 1 ml of fresh, warm DPBS. Repeat the DPBS wash once.
52∣ Treat one well with experimental conditions and one with control conditions. As a positive control, stimulation with 100 μM H2O2 should be carried out. To do this, make a 100 mM solution of H2O2 by adding 11 μl of 30% (wt/vol) H2O2 into 989 μl of H2O. Add 1 μl of this solution to one well, and 1 μl of H2O to the control well. Place the 24-well plate of cells back into the incubator.
-
53∣ After 15–90 min, remove the cells from the incubator and wash each well with 1 ml of warm DPBS twice (15 min is what we think is the shortest time required to see a robust response, and 90 min is a conservative upper limit as to how long cells can be kept in medium without serum before this will affect the results). Transfer the two coverslips into a 35-mm Petri dish containing 3 ml of warm DPBS.
 Depending on the conditions being tested, this protocol can be adapted accordingly. For overnight treatments, simply wash the cells before adding the MitoPY1 solution. As fluorescence intensities will be compared between control cells and stimulated cells, it is crucial for direct comparison that for each experiment a control cell slide be used that was simultaneously loaded with the same MitoPY1 stock as stimulated cells.
Imaging MitoPY1-labeled cells  variable; 1–12 h
54∣ MitoPY1 can be imaged using any type of fluorescence microscope, including epifluorescence, confocal and multiphoton instruments. For standard confocal experiments, the best results were obtained with either 488- or 510-nm excitation, and collection between 527 and 580 nm. Alternatively, MitoPY1 can be detected by flow cytometry. In this case, the cells should be loaded with the dye and stimulated in an analogous fashion; at the end of the stimulation, the cells should be removed from the culture container using cell-specific protocols, and then they should be analyzed using the GFP channel on a flow cytometer.


Troubleshooting advice can be found in Table 2.
Table 2.
Troubleshooting table.
| Step | Problem | Possible reason | Solution |
|---|---|---|---|
| 34 | Reaction fails | O2 and/or H2O in the reaction | Make sure the reaction is set up in air-free conditions and make sure all reagents are as dry as possible |
| 40 | Product sticks to column |
Silica can deprotect the pinacol to yield the boronic acid, which is hydrophilic and is very difficult to get off of the column |
Run the column as quickly as possible, keep solvent flowing throughout the purification |
| 47 | Product does not respond to H2O2 |
Impurities in the final preparation | Purification of MitoPY1 requires a balance between running the column fast enough so that pinacol deprotection does not occur and slow enough to purify away from possible contaminants, especially triphenylphosphonium by-products, which tend to streak through the column |
| 54 | High fluorescent background in cells |
Boronate converted phenol | MitoPY1 should be stored in dry, cool conditions to maintain the boronate. Boronate deprotection will yield fluorescent product, which will in turn increase the background fluorescence of the experiment and lower the sensitivity of the assay. Care should be taken to get MitoPY1 as pure as possible |
| Low fluorescent background of cells |
Pinacol deprotected | The boronic acid form of MitoPY1 is less cell permeable, which leads to less accumulation of the dye and less sensitivity of the assays. Stocks of MitoPY1 can be checked by LC-MS for the ratio of boronate to boronic acid, which should be primarily boronate in the final preparations. MitoPY1 should be applied to cells immediately after addition to aqueous buffer, as the boronate will slowly convert to the boronic acid in the presence of H2O |

With appropriate precursors in hand, the synthesis and purification of MitoPY1 (4) is anticipated to require 7–10 d. Imaging experiments will require 1–2 d with cells in culture.
Steps 1–20, synthesis of Fmoc-piperazinerhodol (1): 10–12 h, plus purification
Steps 21–28, synthesis of Fmoc-piperazinerhodoltriflate (2): 24 h, plus purification
Steps 29–34, synthesis of Fmoc-piperazinerhodolboronate (3): 8–12 h, plus purification
Steps 35–40, synthesis of MitoPY1 (4): 36–48 h, plus purification
Steps 41–43, preparation of dry MitoPY1 stocks: 12–16 h
Steps 44–47, validation of MitoPY1 activity: 2–6 h
Steps 48–53, MitoPY1 labeling of live cells: variable; 30–90 min
Step 54, imaging MitoPY1-labeled cells: variable; 1–12 h
ANTICIPATED RESULTS
Using MitoPY1 to detect mitochondrial H2O2
MitoPY1 has spectroscopic properties similar to YFP. Specifically, in 20 mM HEPES, pH 7, MitoPY1 features two major visible-region absorptions (λabs = 489 nm, ε = 14,300 M−1 cm−1; 510 nm, ε = 14,200 M−1 cm−1) and a weak emission (λem = 540 nm, ϕ = 0.019). Reaction of MitoPY1 with H2O2 triggers a fluorescence increase by its conversion to MitoPY1ox (Fig. 2), which possesses one major absorption band at 510 nm (ε = 22,300 M−1 cm−1) and enhanced emission (λem = 528 nm, ϕ = 0.405). MitoPY1 selectively detects H2O2 over a host of other potentially competing ROS, including superoxide, nitric oxide, hypochlorite and hydroxyl radical.
Figure 3 shows the ability of MitoPY1 to detect oxidative-stress levels of H2O2 in the mitochondria of live HeLa cells.
Figure 3.

Imaging mitochondrial H2O2 in live cells with MitoPY1. HeLa cells were loaded with 10 μM MitoPY1 in DPBS for 45 min at 37 °C. The medium was then exchanged for fresh DPBS containing 25 nM Mitotracker Deep Red and 1 μM Hoechst. After the addition of either H2O (control) or 100 μM H2O2, the cells were incubated for 60 min at 37 °C. (a–d) Control cells were then imaged with MitoPY1 (a), Mitotracker Deep Red (b), overlay of MitoPY1 (green), Mitotracker Deep Red (red) and Hoechst (blue) (c), or overlay of bright-field and Hoechst (blue) (d). Scale bar, 40 μm. (e–h) H2O2-treated cells were imaged with MitoPY1 (e), Mitotracker Deep Red (f), overlay of MitoPY1 (green), Mitotracker Deep Red (red) and Hoechst (blue) (g), or overlay of bright-field and Hoechst (blue) (h). Scale bar, 40 μm. (i–l) The region of H2O2-treated cells denoted in e is enlarged, showing MitoPY1 (i), Mitotracker Deep Red (j), overlay of MitoPY1 (green), Mitotracker Deep Red (red) and Hoechst (blue) (k), or overlay of bright field and Hoechst (blue) (l). Scale bar, 10 μm.
Analytical data
Fmoc-piperazinerhodol (1)
Yield: 39%, red solid. 1H NMR (CDCl3, 400 MHz): δ 7.99 (1H, d, J = 7.6 Hz), 7.74 (2H, d, J = 7.6 Hz), 7.57–7.66 (2H, m), 7.55 (2 H, d, J = 7.6 Hz), 7.37 (2H, t, J = 7.2 Hz), 7.29 (2H, t, J = 7.2 Hz), 7.14 (1H, d, J = 7.6 Hz), 6.71 (1H, d, J = 2.0 Hz), 6.65 (1H, d J = 2.0 Hz), 6.49–6.63 (4H, m), 4.47 (2H, d, J = 6.4 Hz), 4.22 (1H, t, J = 6.4 Hz), 3.55 (4H, bs), 3.14 (4H, bs). 13C NMR (CDCl3,100 MHz): δ 170.03, 159.59, 155.23, 152.82, 152.65, 152.58, 152.41, 143.76, 141.29, 134.92, 129.63, 129.15, 128.81, 127.73, 127.07, 127.00, 125.06, 124.82, 124.18, 129.97, 112.59, 112.18, 110.35, 109.87, 102.82, 102.33, 67.37, 47.99, 47.25, 43.20 (broad multiplet). HR-FABMS: calculated for [M+] 623.2171, found 623.2182.
Fmoc-piperazinerhodoltriflate (2)
Yield: 46%, white solid. 1H NMR (CDCl3, 400 MHz): δ 8.04 (1H, d, J = 7.2 Hz), 7.76 (2H, d, J = 7.6 Hz), 7.69 (1H, dt, J = 1.2, 7.6 Hz), 7.64 (1H, dt, J = 7.6, 1.2 Hz), 7.57 (2H, d, J = 7.2 Hz), 7.38 (2H, t, J = 7.2 Hz), 7.30 (2H, dt, J = 1.2, 7.2 Hz), 7.23 (1H, d, J = 2.4 Hz), 7.16 (1H, d, J = 7.2 Hz), 6.94 (1H, dd, J = 2.4, 8.8 Hz), 6.88 (1H, d, J = 8.8 Hz), 6.70 (1H, d, J = 2.0 Hz), 6.66 (1H, d, J = 8.8 Hz), 6.61 (1H, dd, J = 2.0, 8.8 Hz), 4.48 (2H, d, J = 2.4 Hz), 4.23 (1H, t, J = 2.4 Hz), 3.56 (4H, bs), 3.16 (4H, bs). 13C NMR (CDCl3, 100 MHz): δ 169.18, 155.09, 152.77, 152.49, 152.18, 151.85, 149.93, 143.83, 141.31, 135.37, 130.14, 130.06, 128.73, 127.73, 127.07, 126.36, 125.23, 124.86, 123.87, 119.98, 119.86, 116.52, 112.78, 110.42, 108.77, 102.23, 81.96, 67.29, 47.87, 47.30, 43.33 (broad multiplet). HR-FABMS: calculated for [MNa+] 777.1494, found 777.1501.
Fmoc-piperazinerhodolboronate (3)
Yield: 74%, white solid. 1H NMR (CDCl3, 400 MHz): δ 8.02 (1H, d, J = 6.4 Hz), 7.77 (3H, t, J = 7.6 Hz), 7.56–7.68 (4H, m), 7.37–7.45 (3H, m), 7.33 (2H, t, J = 8.0 Hz), 7.22 (1H, d, J = 6.8 Hz), 6.81 (1H, d, J = 8.0 Hz), 6.69 (2H, d, J = 7.6 Hz), 6.59 (1H, dd, J = 2.4, 8.8 Hz), 4.50 (2H, d, J = 6.8 Hz), 4.26 (1H, t, J = 6.4 Hz), 3.60 (4H, bs), 3.16 (4H, bs), 1.35 (12H, s). 13C NMR (CDCl3, 100 MHz): δ 169.65, 155.09, 153.44, 152.69, 152.31, 150.84, 143.88, 141.34, 153.09, 129.70, 129.27, 128.73, 128.04, 127.75, 127.25, 127.09, 126.37, 125.07, 124.90, 123.82, 123.44, 121.60, 120.01, 112.27, 109.47, 102.60, 84.20, 82.85, 67.29, 48.13, 47.34, 24.86 (no signal for carbon attached to boronate observed). HR-FABMS: calculated for [MNa+] 733.3082, found 733.3085.
MitoPY1 (4)
Yield: 76%, light pink solid. 1H NMR (CDCl3/10% CD3OD, 300 MHz): δ 7.96 (1H, d, J = 7.2 Hz), 7.76-7.83 (3H, m), 7.55-7.75 (15H, m), 7.35 (1H, dd, J = 8.0, 1.2 Hz), 7.09 (1H, d, J = 7.2 Hz), 7.71 (1H, d, J = 7.6 Hz), 6.67 (1H, d, J = 3.2 Hz), 6.60 (1H, d, J = 8.8 Hz), 6.56 (1H, dd, J = 2.0, 8.8 Hz), 3.36-3.47 (2H, m), 3.23-3.29 (4H, m), 2.74-2.81 (4H, m), 2.62-2.70 (2H, m), 1.88-1.94 (2H, m), 1.65-1.76 (2H, m), 1.29 (12H, s). 13C NMR (CDCl3/10% CD3OD, 125 MHz): δ 170.08, 153.13, 152.27, 150.08, 135.30, 135.28, 133.55, 133.47, 130.64, 130.54, 129.81, 129.17, 128.64, 127.09, 126.16, 124.97, 123.85, 123.36, 121.31, 118.00, 117.32, 84.23, 83.36, 74.96, 56.25, 52.33, 49.95, 24.61, 20.07 (coupling to 31P is not resolved). 31P NMR (CDCl3/10% CD3OD, 162 MHz): δ 23.80. HR-FABMS: calculated for [M+] 827.3781, found 827.3780.
ACKNOWLEDGMENTS
This work was supported by the US National Institutes of Health (NIH) (GM 79465). C.J.C. is an Investigator with the Howard Hughes Medical Institute. B.C.D. is a Fellow of the Jane Coffin Childs Memorial Fund for Medical Research. V.S.L. acknowledges Amgen for a graduate fellowship.
Footnotes
AUTHOR CONTRIBUTIONS B.C.D. and V.S.L. performed experiments. B.C.D., V.S.L. and C.J.C. designed experiments and wrote the paper.
COMPETING FINANCIAL INTERESTS The authors declare no competing financial interests.
Reprints and permissions information is available online at http://www.nature.com/reprints/index.html.
References
- 1.Sundaresan M, Yu ZX, Ferrans VJ, Irani K, Finkel T. Requirement for generation of H2O2 for platelet-derived growth factor signal transduction. Science. 1995;270:296–299. doi: 10.1126/science.270.5234.296. [DOI] [PubMed] [Google Scholar]
- 2.Niethammer P, Grabher C, Look AT, Mitchison TJ. A tissue-scale gradient of hydrogen peroxide mediates rapid wound detection in zebrafish. Nature. 2009;459:996–999. doi: 10.1038/nature08119. [DOI] [PMC free article] [PubMed] [Google Scholar]
- 3.Le Belle JE, et al. Proliferative neural stem cells have high endogenous ROS levels that regulate self-renewal and neurogenesis in a PI3K/Akt-dependant manner. Cell Stem Cell. 2011;8:59–71. doi: 10.1016/j.stem.2010.11.028. [DOI] [PMC free article] [PubMed] [Google Scholar]
- 4.Dickinson BC, Peltier J, Stone D, Schaffer DV, Chang CJ. Nox2 redox signaling maintains essential cell populations in the brain. Nat. Chem. Biol. 2011;7:106–112. doi: 10.1038/nchembio.497. [DOI] [PMC free article] [PubMed] [Google Scholar]
- 5.O’Neill JS, Reddy AB. Circadian clocks in human red blood cells. Nature. 2011;469:498–503. doi: 10.1038/nature09702. [DOI] [PMC free article] [PubMed] [Google Scholar]
- 6.O’Neill JS, et al. Circadian rhythms persist without transcription in a eukaryote. Nature. 2011;469:554–558. doi: 10.1038/nature09654. [DOI] [PMC free article] [PubMed] [Google Scholar]
- 7.Winterbourn CC. Reconciling the chemistry and biology of reactive oxygen species. Nat. Chem. Biol. 2008;4:278–286. doi: 10.1038/nchembio.85. [DOI] [PubMed] [Google Scholar]
- 8.Murphy MP, et al. Unraveling the biological roles of reactive oxygen species. Cell Metab. 2011;13:361–366. doi: 10.1016/j.cmet.2011.03.010. [DOI] [PMC free article] [PubMed] [Google Scholar]
- 9.Dickinson BC, Chang CJ. Chemistry and biology of reactive oxygen species in signaling or stress responses. Nat. Chem. Biol. 2011;7:504–511. doi: 10.1038/nchembio.607. [DOI] [PMC free article] [PubMed] [Google Scholar]
- 10.Lambeth JD. NOX enzymes and the biology of reactive oxygen. Nat. Rev. Immunol. 2004;4:181–189. doi: 10.1038/nri1312. [DOI] [PubMed] [Google Scholar]
- 11.Rhee SG. Cell signaling. H2O2, a necessary evil for cell signaling. Science. 2006;312:1882–1883. doi: 10.1126/science.1130481. [DOI] [PubMed] [Google Scholar]
- 12.D’Autreaux B, Toledano MB. ROS as signalling molecules: mechanisms that generate specificity in ROS homeostasis. Nat. Rev. Mol. Cell Biol. 2007;8:813–824. doi: 10.1038/nrm2256. [DOI] [PubMed] [Google Scholar]
- 13.Paulsen CE, Carroll KS. Orchestrating redox signaling networks through regulatory cysteine switches. ACS Chem. Biol. 2010;5:47–62. doi: 10.1021/cb900258z. [DOI] [PMC free article] [PubMed] [Google Scholar]
- 14.Murphy MP. How mitochondria produce reactive oxygen species. Biochem. J. 2009;417:1–13. doi: 10.1042/BJ20081386. [DOI] [PMC free article] [PubMed] [Google Scholar]
- 15.Giorgio M, et al. Electron transfer between cytochrome c and p66Shc generates reactive oxygen species that trigger mitochondrial apoptosis. Cell. 2005;122:221–233. doi: 10.1016/j.cell.2005.05.011. [DOI] [PubMed] [Google Scholar]
- 16.Veeramani S, Yuan TC, Lin FF, Lin MF. Mitochondrial redox signaling by p66Shc is involved in regulating androgenic growth stimulation of human prostate cancer cells. Oncogene. 2008;27:5057–5068. doi: 10.1038/onc.2008.143. [DOI] [PMC free article] [PubMed] [Google Scholar]
- 17.Bao L, et al. Mitochondria are the source of hydrogen peroxide for dynamic brain-cell signaling. J. Neurosci. 2009;29:9002–9010. doi: 10.1523/JNEUROSCI.1706-09.2009. [DOI] [PMC free article] [PubMed] [Google Scholar]
- 18.Dickinson BC, Srikun D, Chang CJ. Mitochondrial-targeted fluorescent probes for reactive oxygen species. Curr. Opin. Chem. Biol. 2010;14:50–56. doi: 10.1016/j.cbpa.2009.10.014. [DOI] [PMC free article] [PubMed] [Google Scholar]
- 19.Robinson KM, et al. Selective fluorescent imaging of superoxide in vivo using ethidium-based probes. Proc. Natl. Acad. Sci. USA. 2006;103:15038–15043. doi: 10.1073/pnas.0601945103. [DOI] [PMC free article] [PubMed] [Google Scholar]
- 20.Koide Y, Urano Y, Kenmoku S, Kojima H, Nagano T. Design and synthesis of fluorescent probes for selective detection of highly reactive oxygen species in mitochondria of living cells. J. Am. Chem. Soc. 2007;129:10324–10325. doi: 10.1021/ja073220m. [DOI] [PubMed] [Google Scholar]
- 21.Dickinson BC, Chang CJ. A targetable fluorescent probe for imaging hydrogen peroxide in the mitochondria of living cells. J. Am. Chem. Soc. 2008;130:9638–9639. doi: 10.1021/ja802355u. [DOI] [PMC free article] [PubMed] [Google Scholar]
- 22.Hanson GT, et al. Investigating mitochondrial redox potential with redox-sensitive green fluorescent protein indicators. J. Biol. Chem. 2004;279:13044–13053. doi: 10.1074/jbc.M312846200. [DOI] [PubMed] [Google Scholar]
- 23.Belousov VV, et al. Genetically encoded fluorescent indicator for intracellular hydrogen peroxide. Nat. Methods. 2006;3:281–286. doi: 10.1038/nmeth866. [DOI] [PubMed] [Google Scholar]
- 24.Meyer AJ, Dick TP. Fluorescent protein-based redox probes. Antioxid. Redox Signal. 2010;13:621–650. doi: 10.1089/ars.2009.2948. [DOI] [PubMed] [Google Scholar]
- 25.Markvicheva KN, et al. A genetically encoded sensor for H2O2 with expanded dynamic range. Bioorg. Med. Chem. 2011;19:1079–1084. doi: 10.1016/j.bmc.2010.07.014. [DOI] [PubMed] [Google Scholar]
- 26.Albrecht SC, Barata AG, Grosshans J, Teleman AA, Dick TP. In vivo mapping of hydrogen peroxide and oxidized glutathione reveals chemical and regional specificity of redox homeostasis. Cell Metab. 2011;14:819–829. doi: 10.1016/j.cmet.2011.10.010. [DOI] [PubMed] [Google Scholar]
- 27.Lippert AR, Van de Bittner GC, Chang CJ. Boronate oxidation as a bioorthogonal reaction approach for studying the chemistry of hydrogen peroxide in living systems. Acc. Chem. Res. 2011;44:793–804. doi: 10.1021/ar200126t. [DOI] [PMC free article] [PubMed] [Google Scholar]
- 28.Chang MC, Pralle A, Isacoff EY, Chang CJ. A selective, cell-permeable optical probe for hydrogen peroxide in living cells. J. Am. Chem. Soc. 2004;126:15392–15393. doi: 10.1021/ja0441716. [DOI] [PMC free article] [PubMed] [Google Scholar]
- 29.Miller EW, Tulyathan O, Isacoff EY, Chang CJ. Molecular imaging of hydrogen peroxide produced for cell signaling. Nat. Chem. Biol. 2007;3:263–267. doi: 10.1038/nchembio871. [DOI] [PubMed] [Google Scholar]
- 30.Dickinson BC, Huynh C, Chang CJ. A palette of fluorescent probes with varying emission colors for imaging hydrogen peroxide signaling in living cells. J. Am. Chem. Soc. 2010;132:5906–5915. doi: 10.1021/ja1014103. [DOI] [PMC free article] [PubMed] [Google Scholar]
- 31.Miller EW, Dickinson BC, Chang CJ. Aquaporin-3 mediates hydrogen peroxide uptake to regulate downstream intracellular signaling. Proc. Natl. Acad. Sci. USA. 2010;107:15681–15686. doi: 10.1073/pnas.1005776107. [DOI] [PMC free article] [PubMed] [Google Scholar]
- 32.Dickinson BC, Tang Y, Chang Z, Chang CJ. A nuclear-localized fluorescent hydrogen peroxide probe for monitoring sirtuin-mediated oxidative stress responses in vivo. Chem. Biol. 2011;18:943–948. doi: 10.1016/j.chembiol.2011.07.005. [DOI] [PMC free article] [PubMed] [Google Scholar]
- 33.Murphy MP, Smith RA. Targeting antioxidants to mitochondria by conjugation to lipophilic cations. Annu. Rev. Pharmacol. Toxicol. 2007;47:629–656. doi: 10.1146/annurev.pharmtox.47.120505.105110. [DOI] [PubMed] [Google Scholar]
- 34.Cocheme HM, et al. Measurement of H2O2 within living Drosophila during aging using a ratiometric mass spectrometry probe targeted to the mitochondrial matrix. Cell Metab. 2011;13:340–350. doi: 10.1016/j.cmet.2011.02.003. [DOI] [PMC free article] [PubMed] [Google Scholar]
- 35.Cocheme H.sM., et al. Using the mitochondria-targeted ratiometric mass spectrometry probe MitoB to measure H2O2 in living Drosophila. Nat. Protoc. 2012;7:946–958. doi: 10.1038/nprot.2012.035. [DOI] [PubMed] [Google Scholar]
- 36.Lu J, et al. S100B and APP promote a gliocentric shift and impaired neurogenesis in Down syndrome neural progenitors. PloS ONE. 2011;6:e22126. doi: 10.1371/journal.pone.0022126. [DOI] [PMC free article] [PubMed] [Google Scholar]
- 37.Woolley JF, et al. H2O2 production downstream of FLT3 is mediated by p22phox in the endoplasmic reticulum and is required for STAT5 signalling. PLoS ONE. 2012;7:e34050. doi: 10.1371/journal.pone.0034050. [DOI] [PMC free article] [PubMed] [Google Scholar]
- 38.Ohsaki Y, et al. Increase of sodium delivery stimulates the mitochondrial respiratory chain H2O2 production in rat renal medullary thick ascending limb. Am J. Physiol. Renal. Physiol. 2012;302:F95–F102. doi: 10.1152/ajprenal.00469.2011. [DOI] [PMC free article] [PubMed] [Google Scholar]
- 39.Sikora A, Zielonka J, Lopez M, Joseph J, Kalyanaraman B. Direct oxidation of boronates by peroxynitrite: mechanism and implications in fluorescence imaging of peroxynitrite. Free Radic. Biol. Med. 2009;47:1401–1407. doi: 10.1016/j.freeradbiomed.2009.08.006. [DOI] [PMC free article] [PubMed] [Google Scholar]
- 40.Lin TK, et al. Specific modification of mitochondrial protein thiols in response to oxidative stress: a proteomics approach. J. Biol. Chem. 2002;277:17048–17056. doi: 10.1074/jbc.M110797200. [DOI] [PubMed] [Google Scholar]
- 41.Chang CJ, et al. ZP8, a neuronal zinc sensor with improved dynamic range; imaging zinc in hippocampal slices with two-photon microscopy. Inorg. Chem. 2004;43:6774–6779. doi: 10.1021/ic049293d. [DOI] [PubMed] [Google Scholar]