Abstract
Background
Panic disorder (PD) is a heterogeneous syndrome that can present with a variety of symptom profiles that potentially reflect distinct etiologic pathways. The present study represents the most comprehensive examination of phenotypic variance in PD with and without agoraphobia for the purpose of identifying clinically relevant and etiologically meaningful subtypes.
Method
Latent class (LC) and factor mixture analysis were used to examine panic symptom data ascertained from three national epidemiologic surveys [Epidemiological Catchment Area (ECA), National Comorbidity Study (NCS), National Epidemiologic Survey on Alcohol and Related Conditions (NESARC), Wave 1], a twin study [Virginia Adult Twin Study of Psychiatric and Substance Use Disorders (VATSPSUD)] and a clinical trial (Cross-National Collaborative Panic Study [CNCPS]).
Results
Factor mixture models (versus LC) generally provided better fit to panic symptom data and suggested two panic classes for the ECA, VATSPSUD and CNCPS, with one class typified by prominent respiratory symptoms. The NCS yielded two classes, but suggested both qualitative and quantitative differences. The more contemporary NESARC sample supported a two and three class model, with the three class model suggesting two variants of respiratory panic. The NESARC’s three class model continued to provide the best fit when the model was restricted to a more severe form of PD/panic disorder with agoraphobia.
Conclusions
Results from epidemiologic and clinical samples suggest two panic subtypes, with one subtype characterized by a respiratory component and a second class typified by general somatic symptoms. Results are discussed in light of their relevance to the etiopathogenesis of PD.
Keywords: Exploratory factor analysis, factor mixture models, latent class, panic disorder, respiratory, subtypes
Introduction
Panic disorder (PD) is a heterogeneous psychiatric syndrome characterized by unexpected, recurrent panic attacks that are accompanied by persistent apprehension about the possibility of having additional attacks, worry about the implications of attacks or behavioral modifications as a direct result of the attacks (APA, 2000). According to the DSM-IV (APA, 2000), a panic attack must involve at least four of 13 somatic and cognitive symptoms, permitting for considerable variability in panic symptom profiles. Interestingly, while variation in panic attack symptomatology is recognized and expected, our current nosologic system does not acknowledge the possibility of etiological-based variants of PD, which may manifest in panic symptom presentation.
Although panic attacks are not unique to PD, they are the hallmark feature of this condition. Various etiological theories of panic have been proposed, with early views maintaining that hyperventilation was the proximate cause of panic attacks. During hyperventilation, an individual expires more carbon dioxide (CO2) than is metabolically produced, thereby inducing respiratory alkalosis (i.e. decreased blood CO2 levels), which was hypothesized to trigger panic attacks. Gorman et al. (1984) tested this theory by having a small group of patients with DSM-III (American Psychiatric Association, 1980) defined PD hyperventilate under two different conditions, including ambient room air and in 5% CO2-enriched air. The level of 5% CO2 was chosen because it closely approximates the typical concentration of CO2 in the lungs. With this concentration, inspiration and expiration are in balance, thereby preventing respiratory alkalosis. Gorman and colleagues predicted that hyperventilating in room air, but not in 5% CO2-enriched air, would provoke panic attacks in patients with PD. Counter to their hypothesis, a larger number of patients panicked (approximately 58%) in response to hyperventilation under the 5% CO2 air mixture compared with ambient room air. This study demonstrated that CO2 reliably provoked panic attacks in a subset of patients with PD and initiated a line of research into the panic–respiratory link.
The observation of frequent hyperventilation among patients with PD together with findings of increased sensitivity to respiratory stimulants (e.g. CO2-enriched air mixtures, sodium lactate infusion; Gorman et al. 1988, 2001; Lousberg et al. 1988; Pain et al. 1988; Sanderson et al. 1989; Papp et al. 1993, 1997; Sasaki et al. 1996; Klein, 1993) led to the development of several theories regarding the pathogenesis and nature of PD. Chief among these theories is Klein’s (1993) suffocation alarm hypothesis. Klein postulated that humans have a neural-based suffocation alarm monitor that screens for potential asphyxiation. Increasing partial pressure CO2 (pCO2) levels signal the potential for suffocation and, during this process, individuals with PD experience dyspnea (air hunger/shortness of breath). Based on Klein’s theory, individuals with the first subtype (i.e. respiratory) should be hypersensitive to hypercapnic challenges and engage in chronic hyperventilation as a means of maintaining arterial pCO2 levels below the threshold for provocation of a panic attack.
Around this time, Briggs et al. (1993) were also investigating panic symptom variation. They were the first and, to our knowledge, only researchers to empirically derive panic subtypes (person-centered approach) rather than relying on clinical observations, theory or variable-based statistical methods (e.g. factor analysis). Using data collected as part of the Cross-National Collaborative Panic Study, Second Phase Investigators (CNCPS) (1992), they conducted cluster and principle components analysis of DSM-III (APA, 1980) panic symptom endorsements. Support for a respiratory and a non-respiratory class of panic was found, with the respiratory subtype typified by five primary symptoms (dyspnea, choking/smothering sensations, fear of dying, chest pain/discomfort, paresthesias) and a generally high endorsement of all other panic symptoms. By contrast, the non-respiratory group of PD patients was distinguished by panic attacks marked by tachycardia, dizziness, tremors and generalized sweating (Briggs et al. 1993).
In all, PD appears to be a heterogeneous condition that is likely characterized by multiple pathophysiologic pathways. Although the respiratory/non-respiratory panic subtypes hold promise, they have not been rigorously researched. That is, beyond the original Briggs et al. study (1993), no data-driven study has replicated these subtypes. In addition, the Briggs et al. (1993) study was based on a clinical sample. It is possible that individuals with PD who seek treatment differ from those who do not and it is possible that more than two subtypes of panic may surface in a community sample. Finally, advanced statistical methods specifically designed to detect homogeneous classes within populations have been developed in recent years, but have not been used to investigate the typology of panic. Thus, this study represents a comprehensive exploration of panic symptoms, with the goal of identifying clinically relevant and useful classes of panic.
Latent class analysis (LCA) and factor mixture modeling (FMM) will be used to explore panic symptoms in both community and treatment-seeking samples. These methods represent a person-centered approach to explore population heterogeneity with the goal of identifying potential subtypes. We also focus exclusively on examining symptom variability associated with PD/panic disorder with agoraphobia (PDA) versus panic attacks in general. Given the exploratory nature of this study coupled with limited available data-driven studies of panic subtypes, no a priori hypotheses are offered regarding the number or structure of to-be-identified panic subtypes.
Method
Subjects in this study were respondents in one of four epidemiological surveys [Epidemiologic Catchment Area (ECA), National Comorbidity Study (NCS), National Epidemiologic Survey on Alcohol and Related Conditions, Wave 1 (NESARC-1)], a twin epidemiological study [Virginia Adult Twin Study of Psychiatric and Substance Use Disorders (VATSPSUD)] or participants in a clinical trial for PD/PDA (CNCPS). Demographic and descriptive information for all datasets is presented in Table 1. All epidemiological surveys and the clinical trial largely cohered in assessing panic attack symptoms during the respondent’s ‘worst’ attack. Nonetheless, there were differences in the number of symptoms queried and minor differences in the wording of symptom questions. Panic symptoms were harmonized (e.g. separate queries for faintness and dizziness were combined) to produce similarity across samples and to map most closely to the current DSM-IV (APA, 2000) panic attack criteria. See bottom of Table 1 for assessed symptoms by dataset. Additional, relevant information concerning the datasets is provided below.
Table 1.
Descriptive information and rates of panic disorder (PD) with and without agoraphobia by dataset and proportion of respondents endorsing panic attack symptoms
| Epidemiological samples | Clinical sample | ||||
|---|---|---|---|---|---|
| Dataset | ECA | NCS | NESARC-1 | VATSPSUD | CNCPS |
| Mode | Phone | Face-to-face | Face-to-face | Phone | Face-to-face |
| Interview | NIMH-DIS | UM-CIDI | AUDADIS-IV | SCID | SCID-UP |
| Dates | 1980–1985 | 1990–1992 | 2001–2002 | 1987–1997 | Mid-1980s |
| Eligible N | 20861 | 8098 | 43093 | 2396 | 1168 |
| DSM version | DSM-III | DSM-III-R | DSM-IV | DSM-III-R | DSM-III |
| % Female | 59.0 | 52.6 | 57.0 | 100% | 61.0 |
| % Experiencing a panic attack/episode in the past year | 64.0 | 62.0 | 38.0 | – | – |
| % Lifetime prevalence (n) : | |||||
| PD without agoraphobia | 1.2/254 | 2.2/168 | 4.2/1800 | 2.5/60 | 43.8/509 |
| PD with agoraphobia | 0.5/97a | 1.4/192a | 1.1/494 | 1.8/42 | 56.2/652 |
| Total | 351 | 360 | 2294 | 102 | 1161b |
| Panic symptom | Endorsement rate | ||||
| Dyspneac | 0.60 | 0.74 | 0.85 | 0.73 | 0.78 |
| Chest pain | 0.48 | 0.74 | 0.58 | 0.54 | 0.63 |
| Chokingc | 0.43 | 0.42 | 0.40 | 0.47 | 0.67 |
| Paresthesias | 0.39 | 0.43 | 0.49 | 0.42 | 0.55 |
| Fear of dyingd | 0.68 | 0.50 | 0.56 | 0.51 | 0.66 |
| Dizzy/Faint | 0.69 | 0.72 | 0.73 | 0.71 | 0.90 |
| Tachycardia | 0.87 | 0.96 | 0.95 | 0.94 | 0.90 |
| Trembling | 0.75 | 0.78 | 0.73 | 0.75 | 0.78 |
| Sweating | 0.75 | 0.78 | 0.75 | 0.62 | 0.78 |
| Hot/Cold flashes | 0.65 | 0.63 | 0.65 | 0.62 | 0.82 |
| Dereal/deperson | 0.52 | 0.59 | 0.62 | 0.69 | 0.52 |
| Fear of going crazyd | – | 0.53 | 0.58 | 0.73 | 0.59 |
| Nausea | – | 0.43 | 0.53 | 0.56 | 0.57 |
ECA, Epidemiologic Catchment Area; NCS, National Comorbidity Study ; NESARC-1, National Epidemiologic Survey on Alcohol and Related Conditions, Wave 1 ; VATSPSUD, Virginia Adult Twin Study of Psychiatric and Substance Use Disorders; CNCPS, Cross-National Collaborative Panic Study, Second Phase Investigators ; UM-CIDI, University of Michigan version of the Composite International Diagnostic Interview ; NIMH-DIS, National Institutes of Mental Health Diagnostic Interview Schedule; SCID, adapted version of the Structured Clinical Interview for DSM-III-R; AUDADIS-IV, Alcohol Use Disorder and Associated Disabilities Interview Schedule-IV.
DSM-III Agoraphobia with panic attacks.
Missing data for seven cases.
In the DSM-III and DSM-III-R, the choking and smothering symptoms were combined. In DSM-IV, smothering was combined with dyspnea and not with choking.
Fear of dying and fear of going crazy were combined in the DSM-III but separated in later versions of the DSM.
The symbol ‘—’ indicates that the symptom was not assessed.
Panic symptom assessment
CNCPS
The CNCPS (1992) was a large multi-center trial of alprazolam, imipramine and placebo. To meet inclusion criteria for this study, participants had to meet modified DSM-III (APA, 1980) criteria for the diagnosis of PD. Modified criteria included a history of at least one spontaneous panic attack with at least four panic attack symptoms or having had at least one panic attack with three or more panic attack symptoms per week for the 3 weeks before study entry. Patients had to be between the ages of 18 and 65 years. Study investigators and their staff received extensive training in the use of the SCID-UP interview and other assessment measures (CNCPS, 1992). Patients from 13 countries (Belgium, Brazil, Canada, Colombia, Denmark, France, Germany, Italy, Mexico, Spain, Sweden, UK and USA) participated.
ECA Study
The ECA study was based on DSM-III (APA, 1980) criteria for PD, which required an individual to experience at last three spontaneous panic attacks within a 3-week period. Panic attacks were defined as ‘ discrete periods of apprehension or fear ’ and at least four of 12 prescribed panic symptoms had to occur during the attack. One of the more substantial differences between the current DSM-IV (APA, 2000) and its third version (APA, 1980) was that PD could not be associated with agoraphobia. Thus, individuals presenting with panic attacks in the presence of agoraphobia were given the diagnosis of agoraphobia with panic attacks. In an effort to maximize diagnostic resemblance with the other datasets as well as increase the sample size, symptom data of individuals diagnosed with agoraphobia with panic attacks (n=97) were combined with data from respondents meeting PD criteria (n=254), resulting in a total sample size of 351 respondents.
NCS
To again maximize diagnostic resemblance with other datasets as well as increase the sample size, symptom data of individuals diagnosed with agoraphobia with panic attacks (n=86) were combined with data from respondents meeting DSM-III-R (APA, 1987) PD/PDA criteria (n=274), resulting in a total sample size of 360 respondents.
VATSPSUD
VATSPSUD is a longitudinal, population-based study of adult twins born in Virginia, who were interviewed to assess common psychiatric disorders, personality and a large number of psychosocial risk and protective factors. Twin pairs were treated as singletons. Altogether, 102 twins met full criteria for PD/PDA.
NESARC
The NESARC is a longitudinal survey focusing on psychiatric conditions associated with drug and alcohol use in adults. Symptom data from respondents endorsing a lifetime history of PD/PDA who completed wave 1 of the NESARC were examined.
Statistical method
A recently developed hybrid statistical model known as factor mixture modeling [FMM; aka finite mixture modeling, item response theory mixture modeling] was used to analyze panic symptom data. FMM represents the ‘mixture’ of factor analysis and LCA. Factor analysis is a variable centered approach, which models an underlying continuous dimension, while LCA is a statistical method for detecting classes of related cases (not variables) from multivariate data. Classes are ‘ latent ’ because they are not observed directly but rather they are identified based on a set of manifest variables (e.g. symptoms). LCA is a highly constrained model that has one of the most simple within-class structures (Lubke, 2010), which may be too simple should people within a cluster exhibit variation on the trait. Thus, FMM allows for the examination of continuous dimensionality and categorical subtypes in one integrated, single collective model (Jedidi et al. 1997; Yung, 1997; Dolan & van der Maas, 1998; Muthén & Shedden, 1999).
Although not a primary focus of this paper, exploratory factor analyses (EFAs) were undertaken to examine panic symptom dimensions and to determine the consistency between the symptom loadings across all five datasets. These data are included as supplementary material (see Supplementary Tables 1 and 2, online). EFA is based on the assumption of a single homogeneous population, which is not appropriate if there are clusters in the population (Lubke, 2010). It is important to remember that EFA results are based on the unweighted pooled covariance matrix. That is, covariances between items may be due in part to mean differences between classes and not reflect a factor structure within classes. Thus, a factor structure observed at the variable level does not necessarily translate at the latent class (LC) level.
Overall, EFA results indicated that two to three factors generally provided the best fit at the variable level. Residual variances also suggested that many of the panic symptoms had small portions (i.e. 10–30%) of common variance explained by the factors, indicating that while multiple factors generally emerged, the factors did not account for significant item variance. This suggests that it may not be necessary to specify a multi-factorial structure within classes. Nonetheless, FMMs containing one to four classes with three factors were examined. Multi-class, three factor models always yielded poorer fit [as indexed by the Bayesian Information Criterion (BIC)] compared with multiclass, one factor models. For this reason, all presented model outcomes are based on a unifactorial model.
Our analyses followed a stepwise approach, wherein we first examined the most restrictive models (LCA) and followed with FMMs of increasing leniency. In the first series of FMMs, factor loadings were constrained to be equal across groups while thresholds and residual variances were free and factor means were fixed to zero (referred to as the partially invariant model; Muthen & Muthen, 2007, p. 399). For the second series of FMMs, all parameters were allowed to be non-invariant across classes (referred to as the non-invariant model). The best fitting LC or FMM is reported.
Although our ultimate goal was to achieve a fully non-invariant model, this is not always possible because, as model complexity increases, there is generally an associated increase in the number of potential misspecifications, which can lead to convergence problems and/or biased results (Lubke, 2010). Thus, constraints are sometimes necessary to estimate class-specific parameters and identify the model. It should be noted that intercepts (thresholds) are typically not invariant across classes. Thus, stipulating noninvariant intercepts is the critical factor and allowing this parameter to be freely estimated across classes indicates that the panic symptom items are measuring a different, unique construct within each class (B. Muthen, personal communication, October 2009).
One to four class FMM and LC models were examined across all datasets. Solutions corresponding to different numbers of distinct classes were compared for fit to the data using two primary indices: BIC and the bootstrap likelihood ratio test (BLRT). A recent Monte Carlo simulation study concluded that the BLRT proved to be the most consistent indicator of classes (Nylund et al. 2007). The BLRT provides a test of k class to a model with k-1 classes, where a significant p value favors k over k-1 classes. The BIC performed the best of the information criterions (ICs), but not as well as the BLRT. A low BIC value indicates the best fitting model. Final class selection is based on the collective input of these fit indices as well as model interpretability and consideration of parameter estimates. For example, a LC model may produce a lower BIC, but review of bivariate model fit indices (i.e. standardized residuals) may indicate problems with conditional independence between LC indicators (i.e. panic symptoms). The maximum likelihood robust estimator was used in all analyses.
All analyses include 11 (ECA) to 13 (NCS, NESARC-1, VATSPSUD, CNCPS) panic attack symptoms. As previously mentioned, we are interested in determining the structure of panic in persons with PD or PDA. Thus, for analyses involving respondents in epidemiological surveys, only individuals meeting criteria for PD or PDA are included, with the noted exceptions (e.g. agoraphobia with panic attacks). Moreover, this approach created epidemiological datasets of PD/PDA comparable with the CNCPS. All analyses were conducted in Mplus 5.2 (Muthen & Muthen, 2007).
Results
Table 2 presents fit indices and model statistics for the partially invariant FMM and LC models. Fully noninvariant FMMs converged for the NESARC and the CNCPS and these results are presented directly in the Results section (not in Table 2). A fully non-invariant model did not converge for the ECA, NCS or VATSPSUD. All presented figures illustrate posterior probabilities associated with the model selected as best fitting.
Table 2.
Fit indices and class statistics for latent class and factor mixture models
| Dataset name |
Class no. |
Partially invariant FMMd |
Latent class models |
||||||||||
|---|---|---|---|---|---|---|---|---|---|---|---|---|---|
| pars | BIC | LMR | VLMR | BLRT | logL | pars | BIC | LMR | VLMR | BLRT | logL | ||
| ECA | 1 | 22 | 4712.24 | – | – | – | −2291.65 | 11 | 4825.30 | – | – | – | −2380.42 |
| N=351 | 2 | 35 | 4700.18 | 0.0014 | 0.0016 | 0.0000 | −2247.53 | 23 | 4687.20 | 0.0000 | 0.0000 | 0.0000 | −2276.20 |
| 3 | 48 | 4745.26 | 0.3201 | 0.3272 | 0.0698 | −2231.28 | 35 | 4704.23 | 0.1008 | 0.0968 | 0.0000 | −2249.55 | |
| 4 | 61 | 4796.23 | 0.6741 | 0.6773 | 0.6000 | −2215.57 | 47 | 4737.31 | 0.0496 | 0.0470 | 0.0100 | −2230.93 | |
| NCS | 1 | 26 | 5349.07 | – | – | – | −2598.02 | 13 | 5559.93 | – | – | – | −2741.70 |
| N=360 | 2 | 41 | 5387.69 | 0.3230 | 0.3171 | 0.0000 | −2573.18 | 27 | 5360.86 | 0.0000 | 0.0000 | 0.0000 | −2600.97 |
| 3 | 56 | 5443.85 | 0.9241 | 0.9229 | 0.5000 | −2557.12 | 41 | 5409.38 | 0.2911 | 0.2854 | 0.1304 | −2584.02 | |
| 4 | 71 | 5494.17 | 1.0 | 1.0 | 0.6667 | −2538.13 | 55 | 5459.58 | 0.6311 | 0.6269 | 0.1500 | −2567.92 | |
| NESARC-1b | 1 | 26 | 33560.73 | – | – | – | −16675.90 | 13 | 35216.22 | – | – | – | −17557.81 |
| N=2294 | 2 | 41 | 33280.46 | 0.0003 | 0.0003 | 0.000 | −16476.39 | 27 | 33409.22 | 0.0000 | 0.0000 | 0.0000 | −16600.15 |
| 3 | 56 | 33244.28 | 0.0504 | 0.0492 | 0.000 | −16407.15 | 41 | 33301.51 | 0.0027 | 0.0026 | 0.0000 | −16492.13 | |
| 4 | 71 | 33298.49 | 0.0357 | 0.0348 | 0.000 | −16378.42 | 55 | 33301.22 | 0.0884 | 0.0865 | 0.0000 | −16437.81 | |
| NESARC-1c | 1 | 26 | 4639.29 | – | – | – | −2244.22 | 13 | 4825.18 | – | – | – | −2374.88 |
| N=331 | 2 | 41 | 4648.24 | 0.1592 | 0.1554 | 0.000 | −2205.18 | 27 | 4619.70 | 0.0000 | 0.0000 | 0.0000 | −2231.52 |
| 3 | 56 | 4700.44 | 0.3951 | 0.3591 | 0.150 | −2187.76 | 41 | 4651.54 | 0.3395 | 0.3341 | 0.0000 | −2206.83 | |
| 4 | 71 | 4741.92 | 0.3732 | 0.3703 | 0.010 | −2164.98 | 55 | 4696.48 | 0.5695 | 0.5666 | 0.0638 | −2188.68 | |
| VATSPSUD | 1 | 26 | 1353.80 | – | – | – | −619.77 | 13 | 1345.34 | – | – | – | −644.11 |
| N=102 | 2 | 41 | 1366.61 | 0.1332 | 0.1298 | 0.000 | −593.22 | 27 | 1353.07 | 0.1134 | 0.1078 | 0.0000 | −617.21 |
| 3 | 56 | 1400.23 | 0.2466 | 0.2425 | 0.1100 | −577.07 | 41 | 1372.51 | 0.3087 | 0.3017 | 0.0000 | −596.17 | |
| 4a | 71 | 55 | 1408.99 | 0.2431 | 0.2381 | 0.6850 | −583.65 | ||||||
| CNCPSb | 1 | 26 | 16411.63 | – | – | – | −8114.10 | 13 | 16710.44 | – | – | – | −8309.36 |
| N=1159 | 2 | 41 | 16328.44 | 0.0002 | 0.0001 | 0.0000 | −8019.59 | 27 | 16409.70 | 0.0000 | 0.0000 | 0.0000 | −8109.61 |
| 3 | 56 | 16370.71 | 0.0202 | 0.0193 | 0.0000 | −7987.81 | 41 | 16356.43 | 0.0008 | 0.0008 | 0.0000 | −8033.58 | |
| 4 | 71 | 16437.01 | 0.0000 | 0.0000 | 0.3333 | −7968.04 | 55 | 16388.59 | 0.1034 | 0.1008 | 0.0000 | −8000.28 | |
FMM, Factor mixture modeling; LMR, Lo-Mendell-Rubin likelihood ratio test ; VLMR, Vuong-Lo-Mendell-Rubin likelihood ratio test ; ECA, Epidemiologic Catchment Area; NCS, National Comorbidity Study; VATSPSUD, Virginia Adult Twin Study of Psychiatric and Substance Use Disorders.
The standard errors of the model parameter estimates could not be computed, therefore the model did not converge. Model non-convergence was not related to exceeding the maximum number of iterations, but rather it was related to difficulties in optimizing the fitting function.
The fully non-invariant, two class model was the best fitting for National Epidemiologic Survey on Alcohol and Related Conditions (NESARC) and Cross-National Collaborative Panic Study, Second Phase Investigators (CNCPS). The Bayesian Information Criterion (BIC) and bootstrap likelihood ratio test (BLRT) values are reported in Results section.
NESARC Wave 1 (NESARC-1) respondents with panic disorder/panic disorder with agoraphobia onset in past 12 months who sought treatment.
Partially invariant models where factor loadings were constrained to be equal across groups; intercepts and residual variances free ; factor means fixed at zero in all groups.
Clinical sample
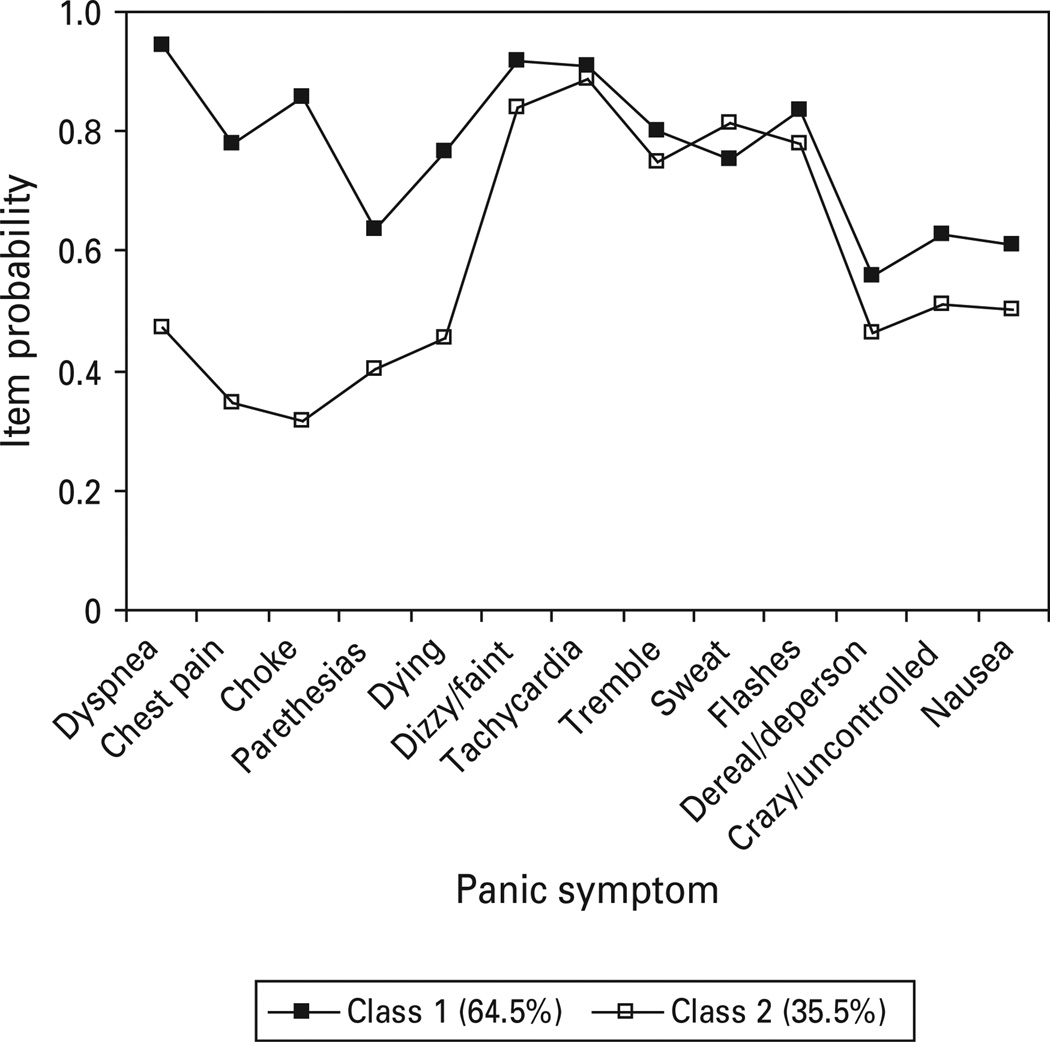
Although a lower BIC resulted for the two class one factor partially-invariant model versus the two class fully non-invariant model, examination of standardized residuals suggested that the fully non-invariant model provided slightly better fit. Thus, the CNCPS was best represented by a two class, one factor FMM (BIC=16394.50, BLRT=0.0000), with class 1 (respiratory) including 64.5% of treatment-seeking individuals who were distinguished by significant respiratory symptoms (dyspnea, chest pain, choking, paresthesias, fear of dying; see Fig. 1) as well as generally high endorsement of almost all panic symptoms. The remaining 35.5% of respondents fell in class 2 (non-respiratory), which was characterized by low endorsements on respiratory symptoms, but high endorsement rates for all general somatic panic symptoms.
Fig. 1.
Panic symptom profile (finite mixture modeling partially invariant two class, one factor) for Cross-National Collaborative Panic Study, Second Phase Investigators respondents meeting DSM-III criteria for panic disorder with or without agoraphobia.
Epidemiological samples
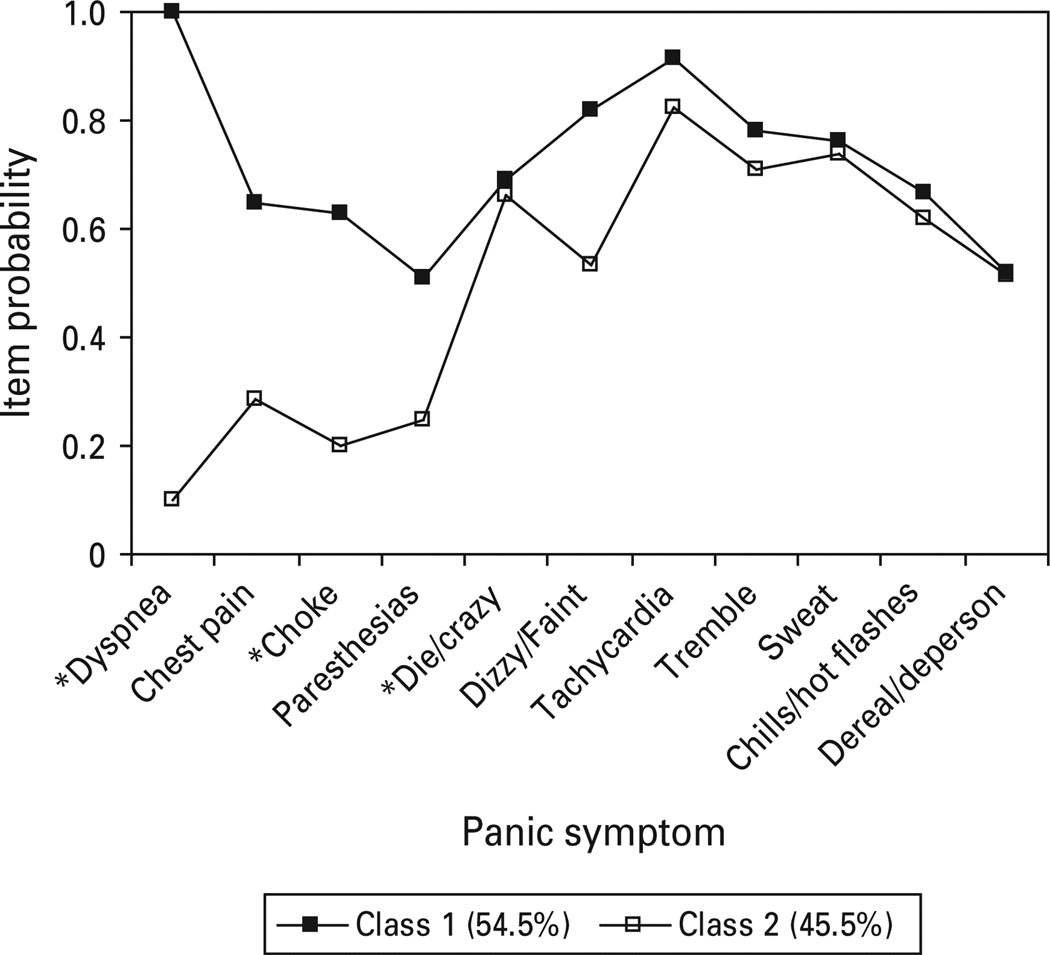
The two class, one factor FMM provided the best overall fit to ECA panic data (Fig. 2). Symptom probabilities indicated two classes, with class 1 respondents characterized by high endorsements of respiratory symptoms (dyspnea, chest pain, choking/smothering, paresthesias) as well as the dizzy/faint symptom and generally elevated probabilities for all other symptoms. This class accounted for 54.5% of respondents. By contrast, class 2 is characterized by low symptom probabilities for respiratory symptoms, but elevations on general somatic symptoms (tachycardia, trembling, sweating, chills/hot flashes) relative to the respiratory items. Unfortunately, fear of dying and fear of going crazy were aggregated in the ECA study. As a result, the ability of this symptom to differentiate at the class level could not be fully determined.
Fig. 2.
Panic symptom profile (FMM partially invariant two class, one factor) for Epidemiologic Catchment Area respondents meeting DSM-III criteria for panic disorder or agoraphobia with panic attacks.
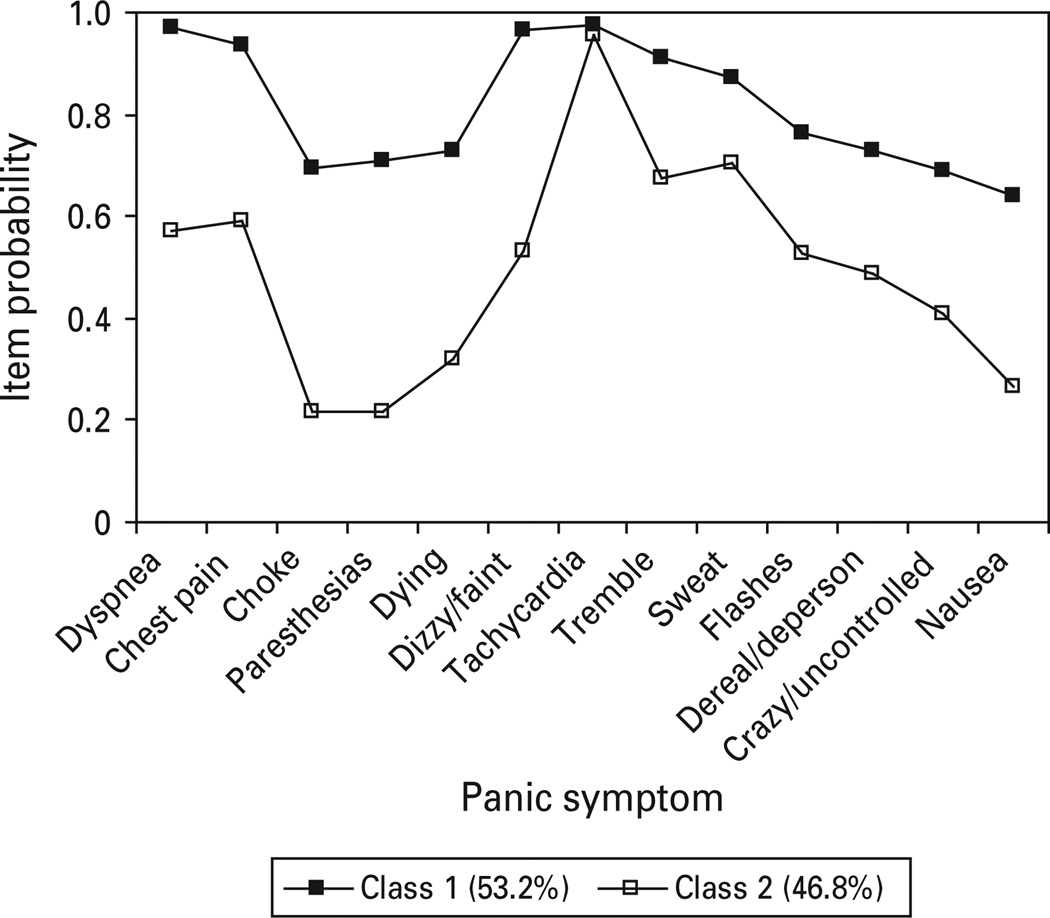
The NCS was best captured by a two class LC model (Fig. 3). Class 1 (respiratory) exhibited high elevations for all five respiratory symptoms as well as high endorsement rates for all other panic symptoms. Class 2 only exhibited lower endorsement of choking, paresthesias and fear of dying. Although between class differences were rather large for several respiratory symptoms, there also appeared to be significance between class differences for most all other panic items, suggesting a quantitative difference.
Fig. 3.
Panic symptom profile (latent class two class) for NCS respondents meeting DSM-III-R criteria for panic disorder with or without agoraphobia.
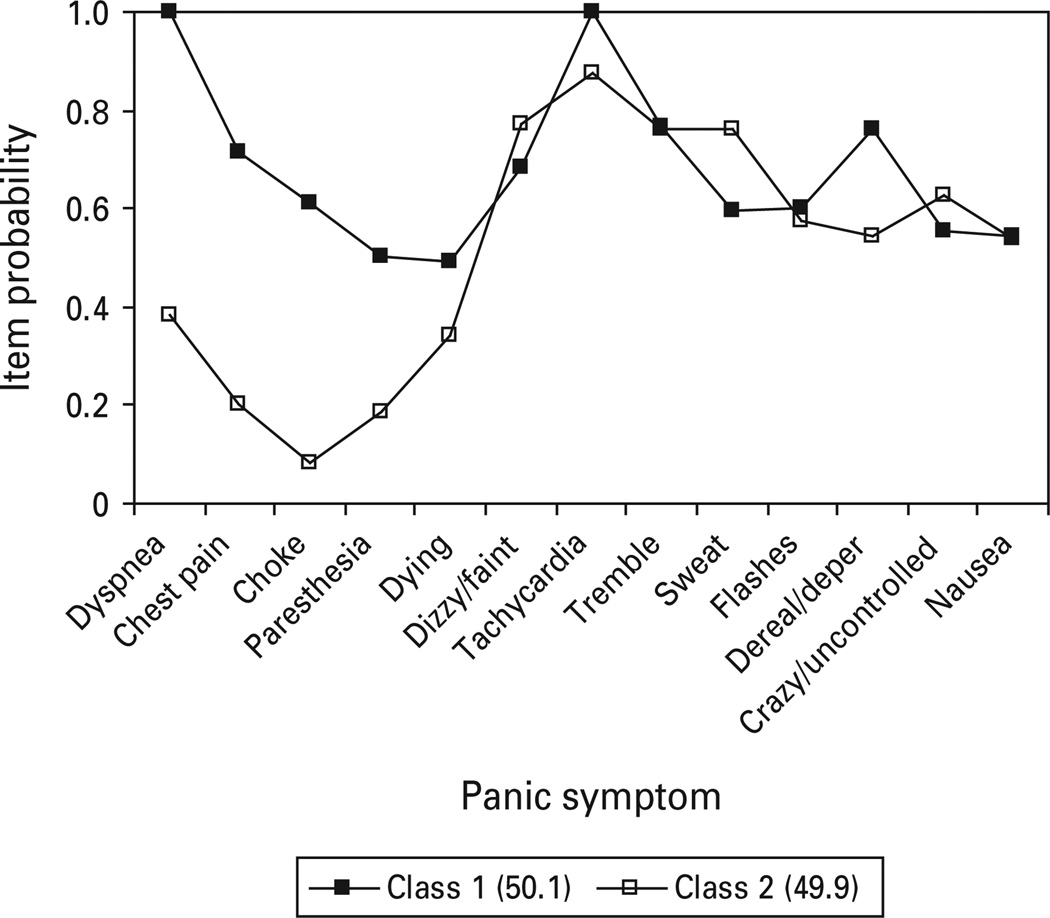
The VATSPSUD study supported a two class, one factor FMM (Fig. 4). Class 1 (50.1%) and class 2 (49.9%) exhibited robust differences for four of the five respiratory symptoms, including dyspnea, chest pain, choking, paresthesia, as well as one non-respiratory symptom (depersonalization/derealization). Class 2 is characterized by high endorsement of general somatic symptoms, particularly tachycardia, trembling and sweating.
Fig. 4.
Panic symptom profile (finite mixture modeling partially invariant two class, one factor) for Virginia Adult Twin Study of Psychiatric and Substance Use Disorders respondents meeting DSM-III-R criteria for panic disorder with or without agoraphobia.
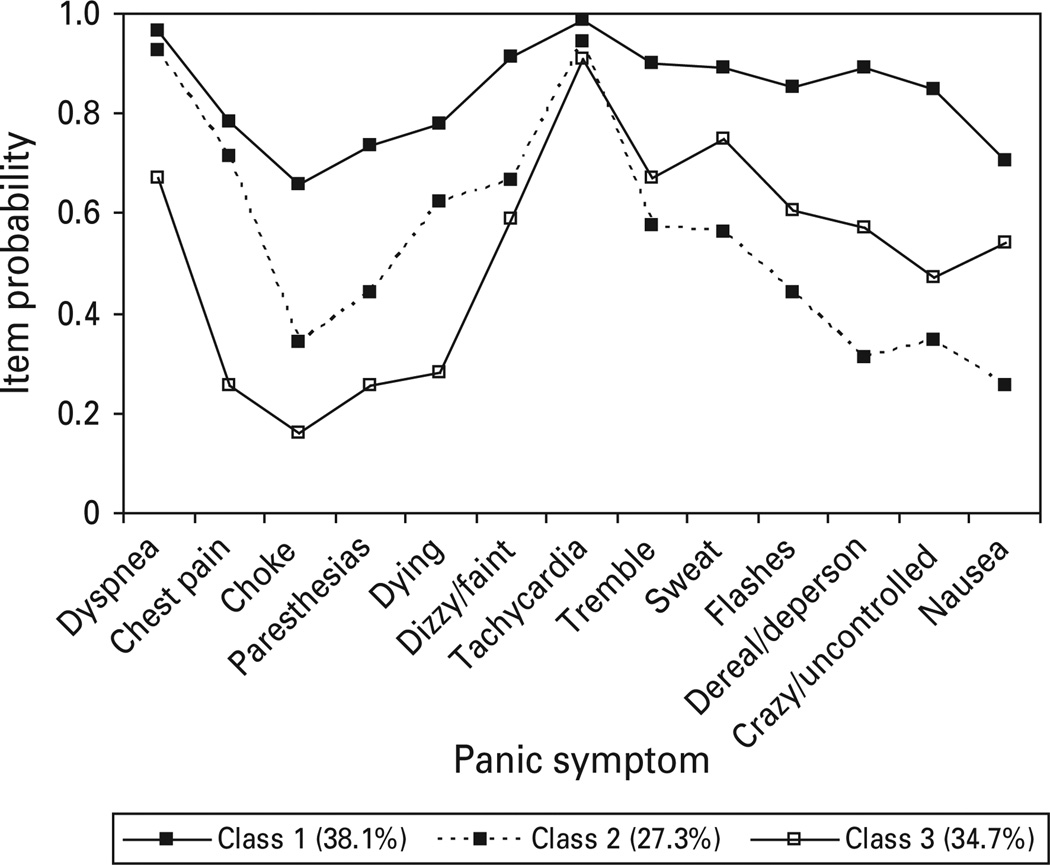
The fully non-invariant model converged for the NESARC, with fit indices suggesting two reasonable models as best fitting. One model included a one factor, three class partially invariant FMM and the second was a one factor, two class fully non-invariant FMM (BIC=33275.46, BLRT p=0.000). Review of the symptom probability profiles for the three class partially invariant model (Fig. 5) indicates that class 1 includes 38.1% of respondents and is characterized by generally high item probabilities across all assessed respiratory and general somatic symptoms. Class 2 appears to be a milder respiratory class, typified by high endorsements of several respiratory-related symptoms (dyspnea, chest pain, fear of dying) as well as dizzy/faint and tachycardia; this class accounts for approximately 27.3% of the sample. By contrast, individuals in class 3 (34.7% of respondents) were distinguished by low endorsement of respiratory symptoms, with the exception of dyspnea, but high endorsement of several general somatic symptoms (tachycardia, tremble, sweat and chills/hot flashes). Endorsement rates of dyspnea and tachycardia were elevated across all three classes and, therefore, did not discriminate significantly between classes.
Fig. 5.
Panic symptom profile (finite mixture modeling partially invariant three class, one factor) for National Epidemiologic Survey on Alcohol and Related Conditions, Wave 1 respondents meeting DSM-IV criteria for panic disorder with or without agoraphobia.
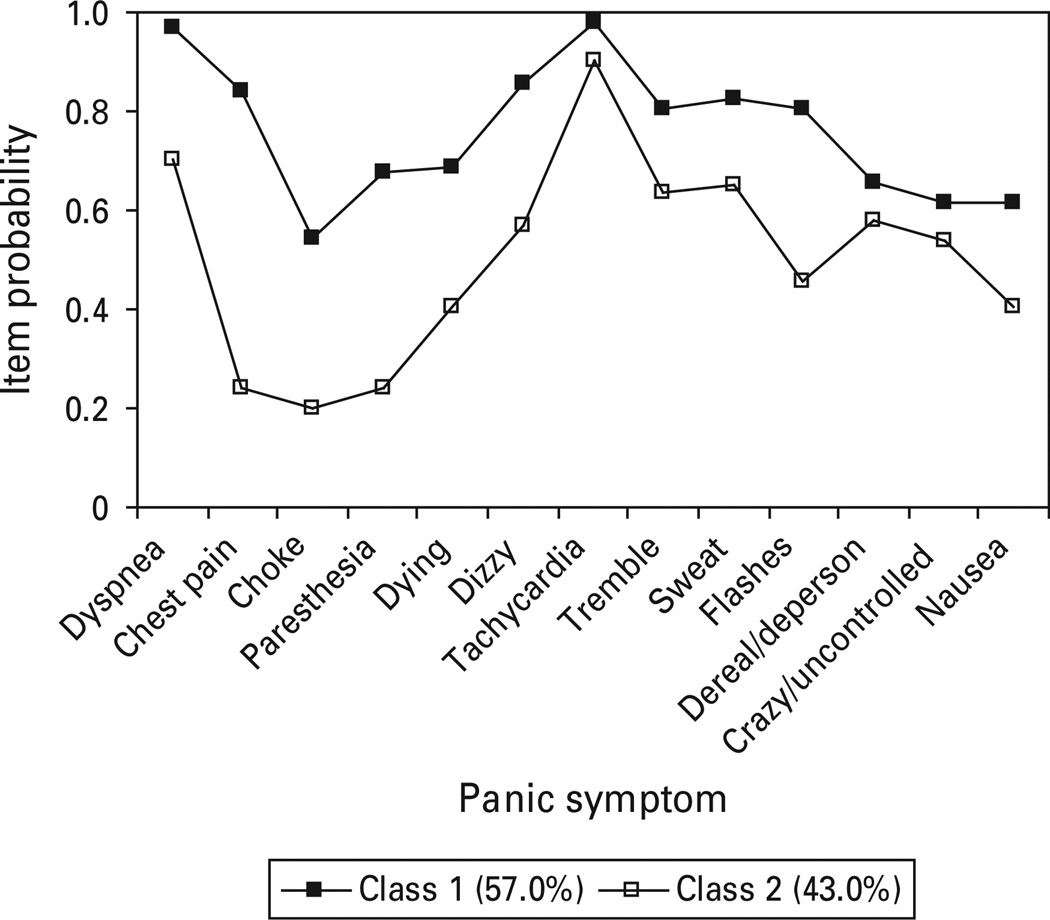
Class 1 of the fully non-invariant two class model (Fig. 6) represented 57% of the sample and exhibited fairly robust differences for four of the five respiratory symptoms, including chest pain, choking, paresthesia and fear of dying, as well as most other panic symptoms. Class 2 is characterized by very low symptom probabilities for all respiratory symptoms, except dyspnea, and elevations on several general somatic symptoms (tachycardia, trembling, sweating).
Fig. 6.
Panic symptom profile (finite mixture modeling fully non-invariant two class, one factor) for National Epidemiologic Survey on Alcohol and Related Conditions, Wave 1 respondents meeting DSM-IV criteria for panic disorder with or without agoraphobia.
For all datasets, a two class solution was the best fit, with the exception of the NESARC. We questioned whether this difference arose from the NESARC’s inclusion of milder cases of PD due to a broadening of DSM (DSM-IV versus DSM-III/DSM-III-R) PD criteria. Where possible, we compared the NESARC and other epidemiologic samples on several severity markers. NESARC respondents meeting DSM-IV criteria for PD/PDA had a later age of onset (mean= 33.49±16.49) versus the ECA (mean=25.10±16.19), NCS (mean=24.65±9.95) and VATSPSUD (mean= 24.28±8.83) respondents. Agoraphobia was present in 51.6% of the ECA sample, 38.7% of NCS and 41.2% of VATSPSUD compared with 21.5% of the NESARC sample (among persons with PD). Moreover, only 38% of respondents in the NESARC reported experiencing a panic attack/panic episode in the past 12 months, a rate significantly lower than the ECA (64%) and NCS (62%) studies. Thus, the NESARC appeared to capture more respondents with PD/PDA, who were currently asymptomatic, as well as potentially less severe cases in general. There was no straight-forward way to create greater equivalency between the NESARC and the other epidemiologic samples. Therefore, NESARC cases that most closely resembled the CNCPS were selected to determine whether a two class model would unequivocally surface as the best fitting. Thus, NESARC respondents with current PD/PDA who sought treatment specifically for panic attacks (n=331) were selected for a second analysis.
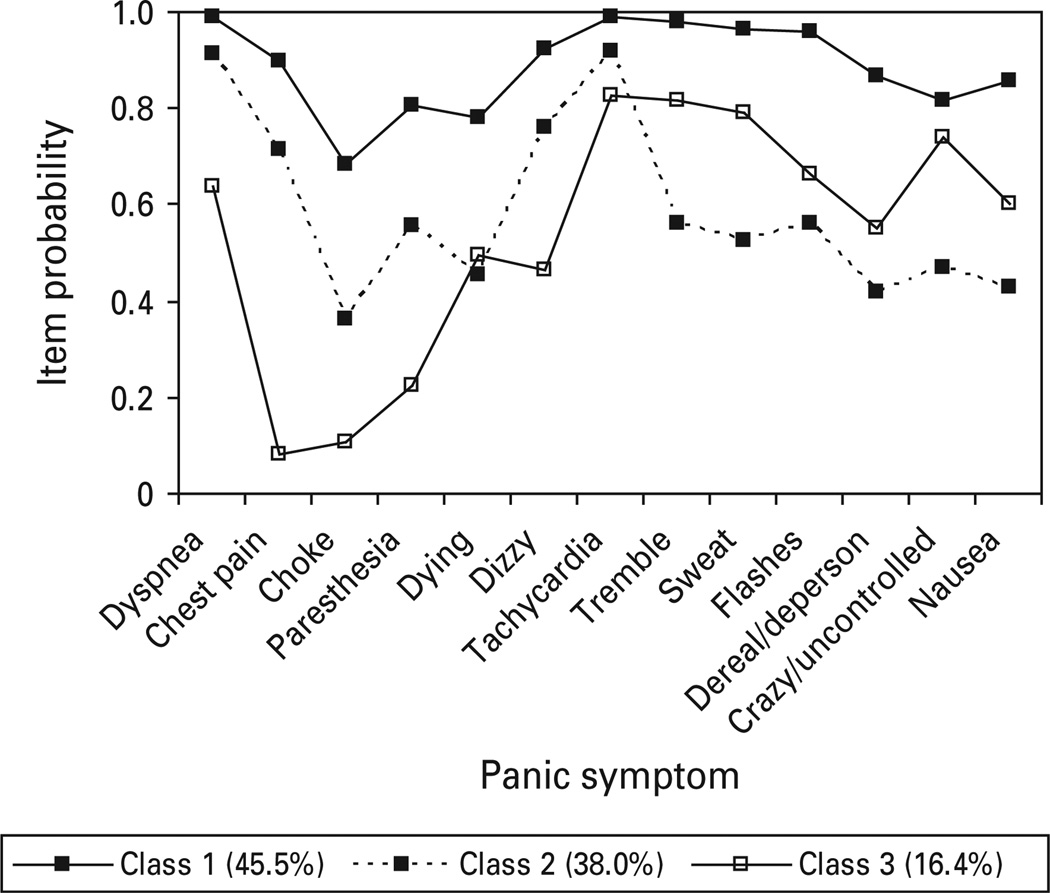
When LC and FMM analyses were restricted to only those NESARC respondents reporting current panic and treatment for panic, a three class LC model was the best fitting (Fig. 7) and continued to reflect a similar pattern observed for the three class, one factor FMM in the full NESARC PD/PDA sample. Class symptom probabilities indicated that class 1 (45.5%) was characterized by elevations on respiratory and general somatic symptoms. Class 2 demonstrated elevations on dyspnea, chest pain, dizziness and tachycardia, while class 3 exhibited elevations on several general somatic symptoms as well as dyspnea.
Fig. 7.
Panic symptom profile (latent class three class) for National Epidemiologic Survey on Alcohol and Related Conditions respondents meeting DSM-IV criteria for panic disorder with or without agoraphobia who experienced a panic episode within the past year and sought treatment for panic attacks.
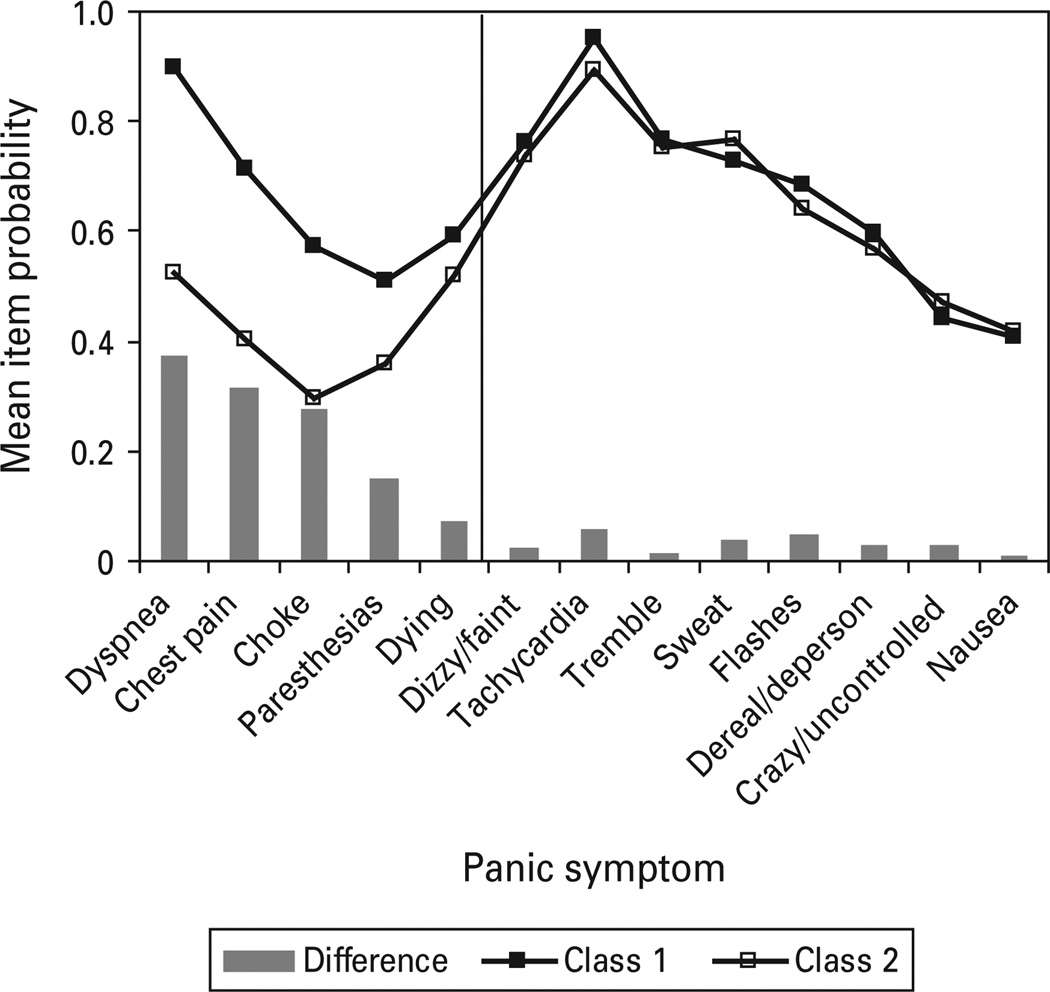
Unweighted mean symptom probabilities were calculated for class 1 (respiratory) and class 2 (nonrespiratory) using all datasets (see Fig. 8), with bars representing mean differences between the two classes. The two class model (versus three class partially invariant) non-invariant model was used to represent NESARC respondents.
Fig. 8.
Unweighted mean item probabilities of all respiratory (class 1) and non-respiratory (class 2) classes.
Discussion
This is the first study to conduct a comprehensive empirical examination of panic symptoms across multiple epidemiological datasets and a clinical sample for the purpose of determining whether individuals with PD/PDA tend to covary in distinct subgroups as a function of symptomatic likeness. Two analytic approaches were used, LCA and FMM, with the latter approach allowing for the dimensional nature of panic symptoms to be considered within classes. Also, our analyses were unique in that they included samples from community and treatment-seeking populations who met criteria for PD/PDA under varying versions of the DSM.
Results from the ECA, VATSPSUD and our analysis of the CNCPS were in agreement with those of Briggs et al. (1993), who originally found evidence for respiratory/non-respiratory panic. Examination of panic symptoms attained from these samples revealed two clearly distinct classes, with one class distinguished by marked respiratory symptoms as well as elevations across most of the other panic symptoms. By contrast, the non-respiratory class exhibited low endorsement rates of respiratory symptoms but high endorsement of non-respiratory panic symptoms. Outcomes associated with the NCS were somewhat mixed, with an item probability profile suggesting both qualitative and quantitative differences between the two classes, although proportions of respondents classified in each class were similar to the other datasets. Unlike the ECA, VATSPSUD and NESARC, the NCS asked all probe questions up front to determine which psychiatric disorders to query. The ECA and NESARC, however, asked probe questions immediately preceding each disorder specific section of the clinical interview. It is possible that this methodological difference affected data acquisition.
The more contemporary NESARC generally supported a respiratory/non-respiratory typology, although a milder form of respiratory panic emerged in this sample. When the FMM analysis of the NESARC data was limited to PD cases who were symptomatic in the past year and sought treatment for panic, a three class model continued to best capture the data. Interestingly, dyspnea, a primary respiratory symptom, was not highly discriminating in the NESARC sample. The inability of this symptom to statistically differentiate classes is not surprising given that 85% of the NESARC sample endorsed this symptom as occurring during their last worst panic attack, a percentage higher than all other datasets.
With the exception of the NCS, outcomes associated with the DSM-III (ECA) and DSM-III-R (VATSPSUD, CNCPS) yielded rather well-defined respiratory and non-respiratory subtypes. Results of the larger, DSM-IV-based NESARC suggested the possible presence of a milder variant of respiratory panic. This milder form of respiratory panic may be an artefact of the expanded DSM PD criteria or it may represent increased power to detect unique classes. Additional research is needed to determine the validity of this intermediate class of respiratory panic. If it does represent a distinct group of people, the nature of this subtype and its longitudinal trajectory will be interesting to map.
As mentioned, we did examine one to four class, three factor FMMs, with the three factors corresponding to the factors that emerged from each sample’s EFA. In no case did the multi-factorial model fit the data better than the unifactorial model. In all, the symptom-focused EFA approach provided a different perspective on the structure underlying panic symptomatology. Our results indicate, however, that it would be incomplete to rely solely on a variable focused procedure alone as the class models provided an added richness, informing about groups of similar people and not merely groups of related symptoms.
Although the respiratory class tended to endorse all panic symptoms at high rates, this subtype may or may not represent a more severe form of PD. That is, increased symptom number does not necessarily indicate greater illness severity and whether these subtypes are associated with differing etiologies remains to be determined. As a next step, clinical features, co-morbidity, demographic and psychosocial factors should also be examined to determine possible class differences beyond the symptom level. Longitudinal data would allow the opportunity to examine the stability of panic subtypes over time as well as the relationship between subtypes and development of other psychiatric conditions. Recognition of the heterogeneity of PD and subsequent classification of individuals with PD/PDA into specific subgroups based on symptom profiles may enable more accurate evaluation of etiologic factors and may aid development of more effective pharmacological and psychosocial interventions.
The results of this study should be considered in light of several potential limitations. First, the present study focused on panic attacks occurring in the context of PD/PDA and not those occurring across the range of anxiety disorders. As mentioned, panic is not unique to PD and panic attacks can be provoked by exposure to a phobic stimulus or in response to a stressful life event. For this reason, panic attack criteria are defined separately from PD criteria. An interesting next step would be to determine whether respiratory and non-respiratory forms of panic also occur in the context of other anxiety disorders and among samples endorsing non-clinical panic attacks. An additional limitation of the present study is that analyses relied upon DSM binary diagnostic symptoms; there may be other types of measures that more accurately capture the experience of panic. Clinical cases in the CNCPS were also based on ongoing PD/PDA, whereas epidemiological cases were often based on the respondent’s retrospective account, which likely diminished the reliability of epidemiologic data. Thus, differences between the clinical and epidemiologic samples probably reflect greater measurement error associated with data collection in the field versus the clinic. Finally, some of our models included non-invariant intercepts and residual variances, but invariant factor loadings. As stated previously, allowing non-invariant intercepts indicates that the panic symptom items are measuring a different, unique construct within each class. Nonetheless, testing fully non-invariant models is a next step, although it should be noted that fully non-invariant models may not always emerge as the best fitting.
Supplementary Material
Acknowledgements
Preparation of this manuscript was supported by grant K01-MH-080953 from the National Institutes of Health/National Institute of Mental Health to the first author (R.R-N). The National Epidemiologic Survey on Alcohol and Related Conditions (NESARC) was sponsored and conducted by the National Institute on Alcohol Abuse and Alcoholism (NIAAA), with supplemental support from the National Institute on Drug Abuse. The availability of data from the ECA, NCS and Cross-National Collaborative Panic Study (CNCPS) are acknowledged with gratitude.
Footnotes
Supplementary information accompanies this paper on the Journal’s website (http://journals.cambridge.org).
Declaration of Interest
None.
References
- APA. Diagnostic and Statistical Manual of Mental Disorders. 3rd edn. Washington, DC: American Psychiatric Association; 1980. [Google Scholar]
- APA. Diagnostic and Statistical Manual of Mental Disorders. 3rd edn revised. Washington, DC: American Psychiatric Association; 1987. [Google Scholar]
- APA. Diagnostic and Statistical Manual of Mental Disorders. 4th edn revised. Washington, DC: American Psychiatric Association; 2000. [Google Scholar]
- Briggs AC, Stretch DD, Brandon S. Subtyping of panic disorder by symptom profile. British Journal of Psychiatry. 1993;163:201–209. doi: 10.1192/bjp.163.2.201. [DOI] [PubMed] [Google Scholar]
- CNCPS. Drug treatment of panic disorder : comparative efficacy of alprazolam, imipramine, and placebo. British Journal of Psychiatry. 1992;160:191–202. doi: 10.1192/bjp.160.2.191. [DOI] [PubMed] [Google Scholar]
- Dolan CV, van der Maas HJL. Fitting multivariate normal mixtures subject to structural equation modeling. Psychometrika. 1998;63:227–253. [Google Scholar]
- Gorman JM, Askanazi J, Liebowitz MR, Fyer AJ, Stein J, Kinney JM, Klein DF. Response to hyperventilation in a group of patients with panic disorder. American Journal of Psychiatry. 1984;141:857–861. doi: 10.1176/ajp.141.7.857. [DOI] [PubMed] [Google Scholar]
- Gorman JM, Fyer MR, Goetz R, Askanazi J, Liebowitz MR, Fyer AJ, Kinney J, Klein DF. Ventilatory physiology of patients with panic disorder. Archives of General Psychiatry. 1988;45:31–39. doi: 10.1001/archpsyc.1988.01800250035006. [DOI] [PubMed] [Google Scholar]
- Gorman JM, Kent J, Martinez J, Browne S, Coplan J, Papp LA. Physiological changes during carbon dioxide inhalation in patients with panic disorder, major depression, and premenstrual dysphoric disorder : evidence for a central fear mechanism. Archives of General Psychiatry. 2001;58:125–131. doi: 10.1001/archpsyc.58.2.125. [DOI] [PubMed] [Google Scholar]
- Jedidi K, Jagpal H, DeSarbo W. STEMM: a general finite mixture structural equation model. Journal of Classification. 1997;14:23–50. [Google Scholar]
- Klein DF. False suffocation alarms, spontaneous panics, and related conditions. An integrative hypothesis. Archives of General Psychiatry. 1993;50:306–317. doi: 10.1001/archpsyc.1993.01820160076009. [DOI] [PubMed] [Google Scholar]
- Lousberg H, Griez E, van den Hout MA. Carbon dioxide chemosensitivity in panic disorder. Acta Psychiatrica Scandinavica. 1988;77:214–218. doi: 10.1111/j.1600-0447.1988.tb05103.x. [DOI] [PubMed] [Google Scholar]
- Lubke G. Latent variable mixture models. In: Hancock GR, Mueller RO, editors. The Reviewer’s Guide to Quantitative Methods in the Social Sciences. New York: Routledge; 2010. pp. 209–220. [Google Scholar]
- Muthén B, Shedden K. Finite mixture modeling with mixture outcomes using the EM algorithm. Biometrics. 1999;55:463–469. doi: 10.1111/j.0006-341x.1999.00463.x. [DOI] [PubMed] [Google Scholar]
- Muthen LK, Muthen BO. Mplus User’s Guide. 5th edn. Los Angeles: Muthen & Muthen; 2007. [Google Scholar]
- Nylund K, Asparouhov T, Muthén B. Deciding on the number of classes in latent class analysis and growth mixture modeling: a Monte Carlo simulation study. Structural Equation Modeling. 2007;14:535–569. [Google Scholar]
- Pain MC, Biddle N, Tiller JW. Panic disorder, the ventilatory response to carbon dioxide and respiratory variables. Psychosomatic Medicine. 1988;50:541–548. doi: 10.1097/00006842-198809000-00010. [DOI] [PubMed] [Google Scholar]
- Papp LA, Klein DF, Gorman JM. Carbon dioxide hypersensitivity, hyperventilationa and panic disorder. American Journal of Psychiatry. 1993;150:1149–1157. doi: 10.1176/ajp.150.8.1149. [DOI] [PubMed] [Google Scholar]
- Papp LA, Martinez JM, Klein DF, Coplan JD, Norman RG, Cole R, de Jesus MJ, Ross D, Goetz R, Gorman JM. Respiratory psychophysiology of panic disorder : three respiratory challenges in 98 subjects. American Journal of Psychiatry. 1997;154:1557–1565. doi: 10.1176/ajp.154.11.1557. [DOI] [PubMed] [Google Scholar]
- Sanderson WC, Rapee RM, Barlow DH. The influence of an illusion of panic attacks induced via inhalation of 5.5% carbon dioxide-enriched air. Archives of General Psychiatry. 1989;46:157–162. doi: 10.1001/archpsyc.1989.01810020059010. [DOI] [PubMed] [Google Scholar]
- Sasaki I, Akiyoshi J, Sakurai R, Tsutsumi T, Ono H, Yamada K, Fujii I. Carbon dioxide induced panic attach in panic disorder. JapanProgress in Neuro- Psychopharmacology & Biological Psychiatry. 1996;20:1145–1158. doi: 10.1016/s0278-5846(96)00102-9. [DOI] [PubMed] [Google Scholar]
- Yung YF. Finite mixtures in confirmatory factor-analysis models. Psychometrika. 1997;3:297–330. [Google Scholar]
Associated Data
This section collects any data citations, data availability statements, or supplementary materials included in this article.


