

Abstract
Epidermal growth factor (EGF) in corneal epithelial cells stimulates proliferation by inducing capacitative calcium entry (CCE). However, neither the identity nor the mechanism of activation of the plasma membrane influx pathway that mediates CCE is known. Accordingly, we determined, in human corneal epithelial cells, whether or not (i) CCE is dependent upon stimulation of store-operated channel (SOC) activity, (ii) the canonical transient receptor potential (TRP) protein isoform TRPC4 is a component of such channels, and (iii) suppression of TRPC4 protein expression decreases EGF-induced stimulation of SOC activity and proliferation. The whole cell patch-clamp technique was used to monitor TRPC4-mediated stimulation of SOC activity following intracellular calcium store depletion and induction of CCE. TRPC4 small interfering RNA transfection suppressed TRPC4 protein expression. Reverse transcription-PCR and Western blot analysis were used to assess knockdown efficiency of mRNA and protein expression. [3H]Thymidine incorporation was used to evaluate EGF-induced mitogenesis. Ca2+ transients were measured by single-cell fluorescence imaging. TRPC4 knockdown decreased mRNA and protein expression by 89 and 87%, respectively. In these cells, EGF-induced SOC activation elicited by intracellular calcium store depletion was obviated; 2) EGF-induced CCE fell by 76%; 3) EGF-induced stimulation of SOC activity was eliminated; and 4) EGF-induced increases in proliferation fell by 54%. Thus, TRPC4 is a component of SOC in human corneal epithelial cells whose activation by EGF is requisite for an optimum mitogenic response to this growth factor.
Maintenance of the optical attributes and transparency of the cornea is essential for normal vision. These properties are partially dependent upon the ability of the outer corneal epithelial layer to elicit fluid flow from the stromal layer into the tear film layer. These flows are not as great as those mediated by the inner endothelial layer, but are essential to the maintenance of ocular surface health (1). Another epithelial property required for normal vision is that this layer provides a barrier function against noxious agents and toxins (2). Barrier properties are maintained by the tight junctional integrity that exists between neighboring epithelial cells. They depend upon continuous proliferation of basal layer cells to replace the differentiating superficial cell layers that are ultimately sloughed off into the tears. Therefore, corneal epithelial function is sustained provided the basal cells proliferate at a rate adequate for replacing the dying cells in the superficial layers.
Corneal epithelial basal cell proliferation is controlled by a host of cytokines, e.g. epidermal growth factor (EGF),2 that activate their cognate receptors in the deeper layers of the epithelium. Following injury to the corneal epithelial layer, wound repair is stimulated by autocrine-mediated increases in the synthesis of EGF and various other growth factors. EGF stimulates wound closure in vitro by a myriad of signaling pathways. One of the events in these cascades includes the activation of calcium transients through stimulation of capacitative calcium entry (CCE) (3). According to this paradigm, depletion of intracellular calcium stores (ICS) occurs as a result of calcium loss through inositol 1,4,5-trisphosphate (IP3) receptor-linked pathways. Such losses elicit a feedback signal to the plasma membrane and result in the activation of store-operated channels (SOC) (4–7).
In the corneal epithelium, however, neither the nature of the feedback signal nor the mechanisms underlying the increases in plasma membrane calcium influx induced by this growth factor are known (8). Using tissues other than the corneal epithelium, two different alternatives have been proposed to describe how ICS depletion activates plasma membrane calcium influx. One is the conformational coupling model, which involves direct communication between IP3 receptors in the ICS and plasma membrane-permeable channels (9, 10). The other involves communication between ICS and these channels due to release of a diffusible signal from the ICS, the so-called calcium influx factor (11, 12). Irrespective of the specific mechanism, calcium entry occurs with variable ionic selectivity after activation of SOC.
Transient receptor potential (TRP) proteins are members of a super-family made up of five different major subfamilies (13). They are components of plasma membrane influx pathways, activated directly by depletion of ICS and/or receptor-linked signal transduction cascades. One such subfamily is the canonical family, i.e. TRPC, which contains seven different isoforms (14). Calcium influx-dependent proliferation occurs through plasma membrane channels that contain a variety of TRPC isoforms, including TRPC1, TRPC4, and TRPC6 (15, 16). However, in corneal epithelial cells, there is no information regarding a role for TRPC expression in mediating CCE and the mitogenic response to EGF. Furthermore, the importance of such expression to SOC function has not been described.
In rabbit corneal epithelial cells (RCEC), EGF induces ICS depletion, which in turn triggers CCE (3). This effect of EGF is fully suppressed by 2-aminoethoxydiphenyl borate (2-APB). However, the mechanism of this effect could not be clarified because there is increasing realization that 2-APB can have numerous other effects besides suppression of SOC activity (17). 2-APB can have multiple effects, even within the same tissue. In some cases, 2-APB blocks IP3 receptor-mediated calcium release from ICS and gap junctional coupling (18–21), whereas it also activates the heat-sensitive TRP protein channel TRPV3 (22). 2-APB also inhibits the activity of heterologously expressed TRPC1 and TRPC3 (18, 23, 24) as well as TRPC5 (25, 26) and TRPV6. Other studies have shown that 2-APB activates TRPV3 (14, 27–29). Therefore, the mechanism whereby EGF induces CCE in RCEC could not be completely characterized in our previous study (3).
In RCEC, TRPC4 expression is plasma membrane-delimited, suggesting that it may be a component of an ionic influx pathway whose activation elicits CCE. Our finding in RCEC that 2-APB has corresponding inhibitory effects on EGF-induced CCE and an increase in proliferation is consistent with such a suggestion (3). However, given the complex pharmacology of 2-APB, the possible importance of TRPC4 expression to these responses is unknown. Such uncertainty is further indicated by the aforementioned finding that 2-APB can inhibit influx pathways composed of TRPC1 and TRPC3, which are two of the four other TRPC isoforms whose gene expression was detected in RCEC. Therefore, it is not possible to draw any conclusions about the importance of TRPC4 expression to CCE and the mitogenic function of EGF. On the other hand, TRPC4 expression may be requisite for EGF to induce increases in corneal epithelial SOC activity because, in human mesangial cells, the stimulation by EGF of such activity is dependent on TRPC4 expression (30, 31).
We describe in human corneal epithelial cells (HCEC) the involvement of TRPC4 gene and protein expression in eliciting SOC activation required for (i) EGF-induced increases in plasma membrane calcium influx and (ii) the mitogenic response to this growth factor. Our results indicate that TRPC4 protein expression is required for EGF stimulation of SOC activity. This dependence is evident, as EGF had no stimulatory effect on plasma membrane calcium influx and SOC activity following TRPC4 knockdown. Finally, TRPC4 expression is requisite for EGF to induce optimum increases in proliferation.
MATERIALS AND METHODS
Cell Culture
SV40-immortalized HCEC (a generous gift from Dr. Araki-Sasaki) were cultured at 37 °C with 5% CO2 and 95% ambient air in Dulbecco’s modified Eagle’s medium/nutrient mixture F-12 (Invitrogen) supplemented with 6% fetal bovine serum, 5 ng/ml EGF, and 5 μg/ml insulin as described previously (32). Cell cycle arrest was achieved by culturing cells in serum- and EGF-free Dulbecco’s modified Eagle’s medium/nutrient mixture F-12 for 24 h before experimentation.
Fluorescence Cell Imaging
Cells grown on 22-mm circular coverslips were loaded with 2 μm fura2 acetoxymethyl ester (Molecular Probes, Inc., Eugene, OR) at room temperature for 30 min and then washed (33). Cells were continuously superfused at 34 °C in a perfusion chamber (the base of which was formed by a coverslip) that was placed on the stage of an inverted microscope (Nikon Diaphot 200). Cells were then alternately illuminated at 340 and 380 nm, and emission was monitored every 5 s at 510 nm using a digital imaging system. The field of interest contained ~6–10 cells. A mean running ratio was calculated for each region. Changes in fluorescence intensity were estimated as described (34). If a vehicle contained Me2SO, its final concentration was <0.1%. The n values provided indicate the number of experiments per data point.
Cell Proliferation
[3H]Thymidine incorporation was performed as described (3). Following 24 h of serum starvation in medium supplemented with 0.5% bovine serum albumin, both transfected and nontransfected cells were incubated at 37 °C for 1 h with 1 μCi/ml [3H]thymidine (3.3–4.8 TBq/mmol) and then washed three times with ice-cold 5% trichloroacetic acid. Cell lysates were solubilized with 0.2 N NaOH and 2% SDS. Radioactivity was monitored using a liquid scintillation counter, and the data were normalized to cellular protein content using a modified Lowry assay.
RNA Extraction and Reverse Transcription (RT)-PCR
Total RNA was isolated using TRIzol, and cDNA was synthesized using the Super-Script RT kit (Invitrogen) following the manufacturer’s instructions. PCR was performed as described previously (3), and the amplified products were separated on 1.0% agarose gels. The expression levels of the housekeeping gene glyceraldehyde-3-phosphate dehydrogenase were evaluated in parallel. The glyceraldehyde-3-phosphate dehydrogenase sense and antisense primers were 5′-TGACCCCTTCATTGACCTTC-3′ and 5′-GGTCATAAGTCCCTCCAGGA-3′, respectively (35). Band intensities were measured using SigmaScan Pro5 and were normalized to those for glyceraldehyde-3-phosphate dehydrogenase, which are expressed in arbitrary units.
Immunoblot Analysis
Transfected and non-transfected HCEC were gently washed twice with cold phosphate-buffered saline and then scraped into homogenization buffer. Homogenization Buffer components: (150 mmol/liter NaCl, 50 mmol/liter Tris HCl, 1 mmol/liter EGTA, 1 mmol/liter EDTA, 1% Nonidet P-40, 0.1% sodium deoxycholate, 0.1% SDS, 20 μg/ml aprotinin, 10 μg/mL leupeptin, and 200 μmol/liter phenylsulfonyl fluoride). Subsequent steps were performed as described (36). Membranes were first exposed overnight at 4 °C to anti-TRPC4 primary antibody (diluted 1:1000; a kind gift of Dr. Michael X. Zhu) (37). They were then washed three times with phosphate-buffered saline/Tween detergent and horseradish peroxidase-conjugated anti-rabbit IgG secondary antibody was applied for 1 h at room temperature. Bound antibody was evaluated using an ECL detection system (Amersham Biosciences). Anti-β-actin monoclonal antibody (Upstate Biotechnology, Inc.) was used to test for equal protein loading.
Synthesis and Transfection of Small Interfering RNA (siRNA)
The 21-nucleotide siRNA sequences specifically targeting human TRPC4 were designed and synthesized using the Silencer siRNA construction kit (Ambion Inc.). The four specific TRPC4 target sequences used in this study are listed in TABLE ONE. The siRNAs were transfected into HCEC using Oligofectamine (Invitrogen) as transfection reagent. After transfection, cells were incubated at 37 °C in Opti-MEM; reduced serum medium and fresh growth medium were added at 24 h post-transfection. All experimental measurements were performed at 48–72 h post-transfection. Non-targeting siRNA (siCONTROL, Dharmacon, Inc.) was used as a control for monitoring non-sequence-specific effects.
TABLE ONE.
Target sequences of TRPC4 siRNA
| siRNA | Target sequence | Position in gene sequence |
GC content |
|---|---|---|---|
| % | |||
| siRNA1 | AAATGTTAATGCTCCCTATAG | 24 | 33.3 |
| siRNA2 | AATGAATTCAAGTCGGAGTAT | 703 | 33.3 |
| siRNA3 | AAATTAAACAGATGTGGGATG | 1250 | 33.3 |
| siRNA4 | AAATATTCAACTGGAATCTCG | 2646 | 33.3 |
Electrophysiological Measurements
Coverslips with HCEC were mounted on the stage of an upright microscope (Olympus BX50WI). The cells were superfused with a sodium- and potassium-free extracellular bath solution containing 120 mmol/liter N-methyl-d-glucamine, 5.4 mmol/liter CsCl, 1.0 mmol/liter MgCl2, 10 mmol/liter glucose, 10 mmol/liter HEPES acid, and 0.5 mmol/liter EGTA (pH adjusted to 7.2). Cyclopiazonic acid (CPA) (Calbiochem), an inhibitor of the ICS Ca2+/Mg2+-ATPase pump, activated SOC currents (ISOC) through passive depletion of ICS. In brief, cells were first incubated with 10 μm CPA. After 10 min, 5 mm Ca2+ was applied to the bath to induce CCE. Control currents were measured with CPA in the bath. ISOC was recorded after induction of CCE. Pipettes of soft glass with a resistance of 2–5 megaohms were pulled using a Universal Puller. Pipettes for whole cell recordings were filled with a solution containing 130 mmol/liter CsCl, 4.0 mmol/liter MgCl2, 10 mmol/liter EGTA, and 10 mmol/liter HEPES salt (pH adjusted to 7.2). Membrane currents were recorded using an EPC 8 amplifier (HEKA, Lamprecht, Germany). Electrical stimulation, data storage, and processing were performed using TIDA software (HEKA) in conjunction with a PC/AT compatible computer. All electrophysiological experiments were performed at room temperature. Membrane capacitances and access resistances were calculated from the capacitative current transient induced by a 90-mV hyperpolarization from the holding potential (0 mV) of 50-ms duration. Mean access resistances of 41 ± 3 megaohms (n = 18) and mean membrane capacitances of 38 ± 3 picofarads (pF) (n = 25) were measured in the whole cell configuration in both non-transfected and siRNA-transfected cells. Pipette and membrane capacitances and access resistances were compensated with an EPC 8 patch-clamp amplifier. The liquid junction potential was estimated experimentally as well as theoretically and corrected for at the beginning of each measurement (38). If drugs were added in a Me2SO-containing stock solution, the concentration was kept <0.1% (v/v), which did not affect the patch-clamp recordings (data not shown). Whole cell currents (ISOC) were recorded for 300 ms using voltage steps ranging between −120 and +20 mV (20-mV increments).
Chemicals
All chemicals were purchased from Sigma unless indicated otherwise.
Data Analyses
All values are reported as means ± S.E. The numbers of replicates are indicated in each case in parentheses. Statistical significance was determined with Student’s t test. p values <0.05 were taken to be significant.
RESULTS
To assess the role of TRPC4 in mediating EGF-induced responses, its gene expression was knocked down using each of four different siRNA candidates specifically targeting suppression of TRPC4 protein expression. Fig. 1 shows the RT-PCR product yields obtained with TRPC4 siRNA2, which was as effective as TRPC4 siRNA3 in eliciting TRPC4 gene expression knockdown. Forty-eight hours after transfection, TRPC4 gene expression decreased by 89 ± 0.3% (n = 3; p < 0.001) from the control value. RT omission was performed to assess genomic DNA contamination; lack of any cDNA product in the negative control lane reflects undetectable contamination. Similarly, Oligofectamine as vehicle by itself had no effect on TRPC4 gene expression. Fig. 1 (lower panel) shows that that levels of glyceraldehyde-3-phosphate dehydrogenase gene expression were invariant, indicating loading condition equivalence.
FIGURE 1. Effect of siRNA knockdown of TRPC4 mRNA.
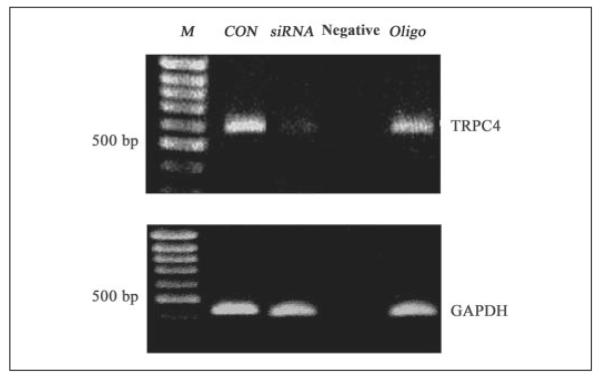
First lane, DNA ladder (protein molecular size markers (M)); second lane, non-transfected cells (control (CON)); third lane, siRNA knockdown of TRPC4 mRNA; fourth lane, non-transfected cells for negative control; fifth lane, non-transfected cells exposed to Oligofectamine (Oligo). RT-PCR showed that TRPC4 siRNA significantly decreased TRPC4 mRNA expression by 88%. GAPDH, glyceraldehyde-3-phosphate dehydrogenase.
Fig. 2 compares variations in TRPC4 protein expression levels resulting from exposure to the following conditions: (i) non-transfected cells, (ii) cells transfected with noncoding siRNA (siCONTROL), (iii) cells transfected with TRPC4 siRNA2 or siRNA3, and (iv) pre-absorption by specific anti-TRPC4 antibody of its peptide recognition sequence. A single band corresponding to TRPC4 with an apparent molecular mass of ~90 kDa was detected, whereas pre-exposure of anti-TRPC4 antibody to its targeted epitope eliminated detection of the aforementioned band. There was no significant difference between the TRPC4 expression levels in the control and siCONTROL cells. On the other hand, siRNA2 and siRNA3 effectively decreased TRPC4 protein expression by 85 ± 0.3% (n = 4; p < 0.005) and 89 ± 0.2% (n = 4; p < 0.004), respectively, relative to that measured in non-transfected and siCONTROL cells. These results indicate that the TRPC4 siRNA sequence designs were sufficiently selective to suppress TRPC4 protein expression.
FIGURE 2. siRNA knockdown of TRPC4 protein expression.
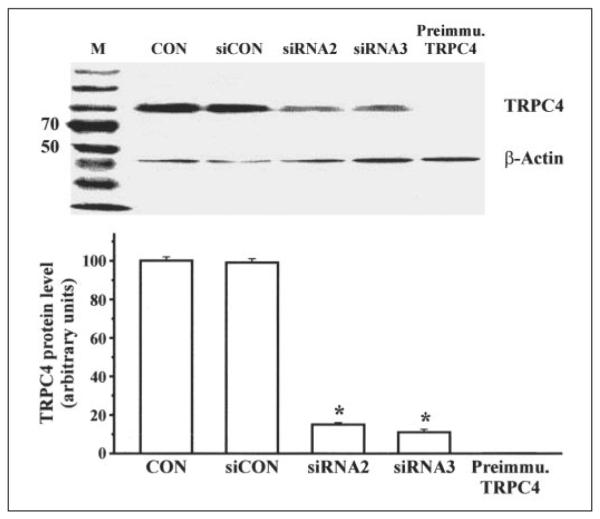
First lane, protein molecular mass markers (M; in kDa); second lane, non-transfected cells (control (Con)); third lane, cells transfected with siCONTROL (siCON; non-targeting siRNA); fourth lane, cells transfected with siRNA2; fifth lane, cells transfected with siRNA3. In the sixth lane, anti-TRPC4 antibody pre-absorbed to epitope recognized by this antibody did not detect the TRPC4 band. Immunoblot analyses showed that two of the four synthesized TRPC4 siRNAs (i.e. siRNA2 and siRNA3) effectively decreased TRPC4 protein expression relative to their controls. Preimmu., preimmune.
EGF induces depletion of ICS, which results in CCE in RCEC (3). The increases in plasma membrane influx associated with this response can be characterized by employing the calcium add-back protocol. This procedure entails initial emptying of ICS content, followed by repletion of the bathing solution calcium composition. The height of the transient resulting from Ca2+ add-back is at least partially reflective of the extent of SOC activation. We considered the dependence of SOC activation on TRPC4 protein expression by comparing the responses to calcium add-back in TRPC4 siRNA-transfected HCEC with those in non-transfected cells. As shown in Fig. 3, ICS were initially depleted of Ca2+ content by inhibition of ICS Ca2+/Mg2+-ATPase activity with 10μm CPA in Ca2+-free medium containing 1 mm EGTA. After addition of CPA, a Ca2+ transient frequently occurred, confirming depletion of ICS Ca2+ content. Following replacement of the medium with its calcium (1 mm)-containing counterpart, there was a rapid increase in the F340 nm/F380 nm ratio, which was at least partially due to SOC activation. In non-transfected cells, Ca2+ add-back induced an increase in the F340 nm/F380 nm ratio of >1 arbitrary unit (control set to 100%), whereas in TRPC4 siRNA2-transfected cells, the CCE amplitude was reduced by 76 ± 2% (n = 5; p < 0.005). This decline in amplitude indicates that activation of SOC pathways composed of TRPC4 contributes to the calcium add-back response.
FIGURE 3. Inhibitory effect of TRPC4 knockdown on induction of CCE.
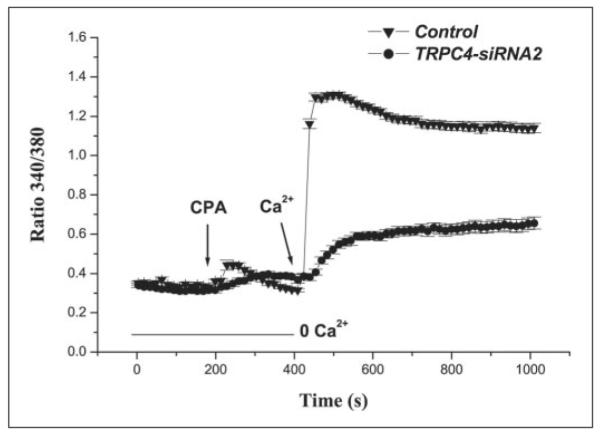
ICS calcium depletion with 10 μm CPA induced a CCE response that was significantly decreased in TRPC4 siRNA2-transfected cells (●) compared with non-transfected HCEC (▾).
To further substantiate the role of SOC activation in eliciting a rise in calcium influx following ICS depletion, we determined the effect of 0.5 mm Ni2+ on CCE amplitude. At high concentrations (in the mm range), this cation is a SOC blocker (39–41). In Fig. 4A, a typical recording shows that, with Ni2+, the CPA-induced CCE increase fell to 68 ± 3% (n = 5) of the control value set equal to 100%. This response was followed by a slight but insignificant increase to a stable value (83 ± 7%, n = 5). Subsequent removal of Ca2+ from the bath caused the transient to fall to the value measured prior to Ca2+ addition. Fig. 4B summarizes the results obtained with this procedure. The average changes in the ratio closely correspond to those observed in Fig. 4A, indicating that SOC activation makes a substantial contribution to CCE.
FIGURE 4. Inhibitory effect of the SOC blocker nickel chloride on CCE amplitude.

A, during exposure to Ca2+-free medium containing 0.5 mm EGTA, ICS depletion resulted from addition of 10 μm CPA to the bathing medium. Following emptying of ICS calcium content, calcium add-back (1 mm) elicited a rise in calcium. Such an increase decreased with nickel chloride (0.5 mm), resulting from inhibition of SOC activation (n = 5). Washout of nickel chloride-containing solution failed to restore the F340 nm/F380 nm ratio to its pre-inhibited level. B, summary of results from five different cells.
To directly assess the increases in calcium flux resulting from ICS depletion, we measured currents of non-transfected and TRPC4 siRNA2-transfected cells using the whole cell mode of the patch-clamp technique. As illustrated in Fig. 5A, cells were exposed to a solution lacking Na+ and K+ to eliminate any currents that could result from their presence. In addition, the bath solution contained 5 μm nifedipine to block voltage-dependent L-type channel activity, and the pipette solution contained 0.1 mm DIDS to inhibit chloride channel activity. The stimulation protocol used to characterize SOC activity is shown in Fig. 5B. The holding potential was set to 0 mV to eliminate any possible contributions by voltage-dependent calcium channel activity. The current responses in the absence and presence of bath calcium (i.e. 5 mm) using this protocol and following ICS depletion with 10 μm CPA are shown in Fig. 5C. Subsequent to Ca2+ medium supplementation and in the continued presence of CPA, both inward and outward currents increased, which is indicative of SOC activity. Fig. 5D shows the current density-voltage relationship, wherein the current is normalized to capacitance to obtain current density (pA/pF). In the absence and presence of calcium, current densities were measured using the stimulation protocol shown in Fig. 5B after establishing the whole cell configuration. In the absence of bath calcium, some increases in inward currents were detected. By contrast, with 5 mm calcium in the bath, the current increased significantly. Specifically, the maximum inward current (at −120 mV) increased from −5.92 ± 1.03 to −13.94 ± 3.00 pA/pF (n = 5; p < 0.04). These results indicate that ICS depletion induces SOC activation.
FIGURE 5. Identification of SOC currents by passive store depletion in non-transfected HCEC.

A, experimental design; B, voltage pulse protocol; C, depolarization pulse-induced currents after establishing the whole cell configuration (0 mm) (upper panel) and currents induced in the same cell after CPA-induced store depletion (10 min) in the presence of 5 mm Ca2+ (lower panel); D, current-voltage relationship (I-V plot). After breaking into the whole cell configuration (0 mm) (○), no SOC currents were observed; 10 min later, a significant increase in CPA-induced SOC currents could be observed with 5 mm Ca2+ as charge carrier (n = 5) (●). HP, holding potential.
To assess the importance of TRPC4 expression to SOC activation, we determined whether SOC activity induced by ICS depletion is suppressed in TRPC4 siRNA2-transfected cells. Fig. 6A compares the current profiles obtained with the same voltage protocol used to characterize the non-transfected cells shown in Fig. 5B. In transfected cells, no effect of the charge carrier was visible. Fig. 6B shows that, in contrast to non-transfected cells, the current density-voltage relationship was identical irrespective of the presence or absence of Ca2+ in the bath solution. In particular, at −120 mV, the maximum inward current was −8.67 ± 1.73 pA/pF in the absence of extracellular calcium and −9.88 ± 1.95 pA/pF in its presence (n = 5; p = 0.71). Identical patterns of Ca2+-dependent changes in current density behavior were observed in siCONTROL RNA-transfected and non-transfected cells. This similarity suggests that the transfection procedure per se did not affect SOC functional activity. Thus, following ICS depletion, plasma membrane Ca2+ influx through SOC is dependent upon TRPC4 protein expression.
FIGURE 6. Suppression of SOC currents in TRPC4 siRNA-transfected HCEC.

A, currents after establishing the whole cell configuration (0 mm) (upper panel) and currents induced in the same cell after CPA-induced store depletion (10 min) in the presence of 5 mm Ca2+ (lower panel); B, current-voltage plot of the experiment shown in A. After breaking into the whole cell configuration (0 mm) (○), there were no significant increases in CPA-induced SOC currents observed in TRPC4 siRNA-transfected HCEC (5 mm; n = 5) (●).
To determine whether TRPC4 activation contributes to EGF increases in SOC activity, we compared the effects of this mitogen in non-transfected and TRPC4 siRNA3-transfected cells. This was done using the experimental and stimulation protocols shown in Fig. 5 (A and B). As shown in non-transfected cells (Fig. 7A), 20 ng/ml EGF increased the currents associated with SOC activity. Fig. 7B shows the current density-voltage relationship measured in the absence and presence of EGF over the voltage range of −120 to 20 mV. In the absence of EGF, the maximum current measured at −120 mV was −3.76 ± 0.83 pA/pF. Interestingly, during exposure to 20 ng/ml EGF at this voltage, this current increased by 2.3-fold, i.e. to −12.37 ± 3.34 pA/pF (n = 4; p < 0.005). These results indicate that EGF-induced CCE is dependent upon EGF activation of SOC. The same experiments shown in Fig. 7 (A and B) were repeated in TRPC4 siRNA-transfected cells (C and D). In contrast to its effect in non-transfected cells, EGF did not affect the currents over the entire voltage range used to evaluate SOC activity (Fig. 7C). Fig. 7D shows that, at −120 mV, the maximum current densities in the absence and presence of EGF were indistinguishable from one another (i.e. −5.34 ± 1.54 and −6.83 ± 2.77 pA/pF, respectively (n = 4); p > 0.64). Thus, EGF-induced increases in SOC activity are dependent on TRPC4 protein expression.
FIGURE 7. EGF-induced SOC activation is dependent on TRPC4 protein expression.

A, currents after establishing the whole cell configuration (upper panel) and EGF (20 ng/ml)-induced increases in SOC inward currents (lower panel). B, I-V plot. After breaking into the whole cell configuration (○), a significant increase in EGF-induced SOC currents was observed in non-transfected HCEC (20 ng/ml EGF; n = 4; p < 0.005). C, no significant increases in currents observed in either the absence (upper panel) or presence (lower panel) of 20 ng/ml EGF in TRPC4 siRNA-transfected HCEC. D, I-V plot revealing that EGF-induced increases in SOC currents were suppressed in TRPC4 siRNA-transfected HCEC (n = 4; p > 0.64).
The dependence of the mitogenic response to EGF on TRPC4 protein expression was determined by comparing its effect on proliferation in non-transfected and transfected cells. Fig. 8 shows that, relative to the control group, EGF increased proliferation by >3-fold. In contrast, following TRPC4 knockdown with either of two candidate siRNAs (siRNA2 and siRNA3) for this isoform, the mitogenic response was suppressed by 54 ± 0.2% (n = 4; p < 0.002) and 58 ± 0.2% (n = 4; p < 0.005), respectively. That these declines were not caused by the transfection procedure is indicated by the fact that proliferation in cells exposed only to Oligofectamine was identical to that in non-transfected control cells. Therefore, TRPC4 protein expression is essential for EGF-induced SOC activation and optimum increases in cell proliferation.
FIGURE 8. TRPC4 knockdown inhibits EGF-induced HCEC proliferation.

First bar, nontransfected HCEC (control (Con)); second bar, non-transfected HCEC plus 5 ng/ml EGF; third bar, HCEC transfected with siRNA2 plus 5 ng/ml EGF; fourth bar, HCEC transfected with siRNA3 plus 5 ng/ml EGF; fifth bar, HCEC transfected with transfection reagent (Oligofectamine). The mitogenic responses to EGF (5 ng/ml) in cells transfected with either siRNA 2 or siRNA3 were reduced relative to their non-transfected counterparts. *, p < 0.05.
DISCUSSION
The purposes of this study were to determine in HCEC (i) the dependence of EGF-induced stimulation of CCE and proliferation on TRPC4 protein expression and (ii) the association between TRPC4 expression and EGF-induced stimulation of SOC activity. The results obtained with HCEC may be extrapolated to RCEC, as there is an identical pattern of TRPC gene expression in the two tissues (3). Our approach to these questions entailed determining the dependence of TRPC4 protein expression on EGF-induced stimulation of SOC activity and proliferation. In this study, we have shown that EGF-induced mitogenesis and SOC activation are dependent upon TRPC4 protein expression. Only one other study, in which human mesangial cells were used, made this assessment (30). In this previous study, EGF also induced increases in SOC activity through pathways composed of TRPC4. However, EGF-induced SOC activation occurred through an IP3-independent mechanism. However, in HCEC, such activation by EGF is IP3-dependent. It is known that channels containing TRPC isoforms in different tissue types either are activated by store depletion or are receptor-operated (43). It is unclear, however, why the mechanism of control of a channel composed of a specific TRPC isoform is not the same for all tissues. Interestingly, there is also evidence that, within the same tissue, both modes of regulation could exist. One possible explanation for such variability is that, within a given channel, TRPC isoforms can exist in either homomeric or heteromeric configurations with other members of this subfamily (44).
To determine the mechanism of regulation of channels mediating CCE in HCEC, we knocked down TRPC4 expression. Our attention was drawn to the involvement of this isoform because changes in its gene and protein expression have corresponding effects on cell proliferation in a number of other tissues (39, 45). Expression of the TRPC4 gene was suppressed by 88% with two of four TRPC4 siRNAs (i.e. siRNA2 and siRNA3) following 72 h of transfection (Fig. 1) and was associated with an 87% decline in expression of its protein counterpart (Fig. 2). The latter decrease is larger than that obtained for human pulmonary arterial smooth muscle, in which TRPC4 protein expression was suppressed by 50% (16). The decline in TRPC4 gene expression is specific for the chosen primer design, as shown by the fact that, with the irrelevant noncoding negative control (siCONTROL) pair, TRPC4 knockdown was undetectable. In our TRPC4 knockdown cells, as indicated in Fig. 3, the CCE response following emptying of ICS was blunted. The remaining 24% of the control response to CCE could be due either to incomplete TRPC4 siRNA knockdown or to influx through TRPC4-independent pathways. Therefore, EGF-induced CCE is largely dependent upon stimulation of pathways composed of TRPC4.
Delineation of the contribution of specific influx pathways regulated by TRPC expression has been hindered by the lack of specific inhibitors. Despite reported multiple effects, the inhibitory effects of 2-APB or divalent metals (such as Ni2+ at high concentration) have been used to document plasma membrane SOC activity (46–48). Specifically, 2-APB can have a number of different effects, as mentioned in the Introduction, whereas Ni2+ inhibits L- and T-type Ca2+ channel activities at low concentrations (in the μm range) (49–52). Nevertheless, we are justified in using Ni2+ at a high concentration as a probe for TRPC4-induced CCE because there appears to be no discernible voltage-gated L-type Ca2+ channel activity in RCEC (53). Fig. 4 indicates that a portion of the plasma membrane Ca2+ influx associated with CCE was Ni2+-sensitive, suggesting that a component of such influx is mediated by SOC activation. The remaining Ni2+-insensitive influx may occur through other mechanisms, e.g. receptor-operated calcium channels or other voltage-dependent Ca2+ subtype channels. Some or all of the influx pathways may be composed of other TRPC isoforms, i.e. TRPC1, TRPC3, TRPC6, and TRPC7, whose gene expression we also detected in HCEC. In other tissues, such proteins are components of influx pathways that are stimulated by increases in phospholipase C and diacylglycerol levels, which occur during exposure to EGF (44, 54). In addition, other signaling mediators of TRPC activation include protein kinase C and activation of the GTP-binding protein-coupled receptor orexin A (55–57). We have preliminary data supporting such a notion because, in HCEC, orexin A induced large increases in Ca2+ entry (data not shown).
To definitively identify and characterize SOC activity, we used the whole cell patch-clamp technique (58). This configuration could provide clearer results than the single-channel mode. The whole cell mode is desirable because currents are measured over the entire plasma membrane surface area (59). The criteria recently described by Nilius (59) were used to establish whether or not the recordings shown in Figs. 5–7 are reflective of SOC activity. The results shown in Fig. 5C indicate that, under these conditions, at all voltages less than −40 mV, Ca2+ addition to the bath increased the current amplitude provided that such measurements were done subsequent to depletion of ICS Ca2+ content with 10 μm CPA. Such increases are reflective of SOC activity.
A crucial criterion for establishing that TRPC4 expression is required for SOC control is to demonstrate that knockdown of TRPC4 expression eliminates the Ca2+-induced increases in current densities in cells exposed to CPA. Indeed, the results in Fig. 6 (A and B) clearly indicate that such an effect was observed following TRPC4 knockdown. Such declines in Ca2+ add-back and the elimination of ISOC clearly establish that TRPC4 protein expression is essential for SOC function.
We characterized the association between EGF receptor-induced Ca2+ transients and their dependence on TRPC4-linked SOC activity. The results shown in Fig. 6 reveal that EGF (20 ng/ml) induced increases in Ca2+-originated inward currents. Such increases were eliminated in cells transfected with TRPC4 siRNA3, suggesting that TRPC4 expression is needed for EGF-induced activation of SOC activity. This dependence is similar to that described in human glomerular mesangial cells, except that SOC activity is induced by an IP3-independent mechanism (31, 60). It is noteworthy to contrast this type of EGF receptor regulation of Ca2+ signaling with that occurring in corneal endothelial cells. Unlike the mitogenic responses induced by EGF in HCEC, RCEC, and human mesangial cells, in corneal endothelial cells, EGF instead suppresses L-type calcium currents induced by exposure to hydrogen peroxide and protects them against cell death (61). The different responses among various tissues suggest that EGF receptor activation is linked to different mechanisms of regulation of calcium homeostasis. This complexity is indicated by the fact that knockdown of TRPC4 expression by 86% only decreased the mitogenic response to EGF by 62% (Fig. 8). This dissociation between decreases in TRPC4 protein and proliferation suggests that there are other plasma membrane influx pathways besides those composed of TRPC4 activated by EGF. On the other hand, ATP-induced TRPC4 overexpression maximally increases human pulmonary artery muscle cell proliferation by 40% (42). The involvement of other plasma membrane influx pathways is tenable because, as shown in Fig. 3, EGF induced a transient in transfected cells that was ~25% of the value measured in non-transfected cells. Such pathways may be formed by TRP isoforms in homomeric or heteromeric configurations because RT analysis revealed the expression of TRPC1, TRPC3, TRPC4, TRPC6, and TRPC7.
In summary, there is convincing new evidence that ICS depletion in HCEC elicits SOC activity during Ca2+ add-back. Such activation is dependent upon TRPC4 protein expression because its knockdown attenuates the Ca2+ add-back effect and eliminates SOC activation. Stimulation of this activity through an IP3-dependent pathway has physiological relevance because the mitogenic response to EGF is partially dependent on TRPC4 protein expression. Therefore, TRPC4 protein expression is required for EGF to be a maximally effective growth factor.
Acknowledgments
We thank Miao Cui, Ines Eichhorn, and Yvonne Giesecke for technical assistance; Dr. Qiang Xie for assistance with Western blotting; Fan Zhang for assistance with calcium measurement; and Dr. Kathy Pokorny for assistance in manuscript preparation.
Footnotes
This work was supported by National Institutes of Health Grants EY04795, EY08834, EY12953, and EY15282 and German Research Foundation Grant Pl 150/11-1. The costs of publication of this article were defrayed in part by the payment of page charges. This article must therefore be hereby marked “advertisement” in accordance with 18 U.S.C. Section 1734 solely to indicate this fact.
The abbreviations used are: EGF, epidermal growth factor; CCE, capacitative calcium entry; ICS, intracellular calcium store(s); IP3, inositol 1,4,5-trisphosphate; SOC, store-operated channel(s); TRP, transient receptor potential; TRPC, TRP canonical subfamily; RCEC, rabbit corneal epithelial cells; 2-APB, 2-aminoethoxydiphenyl borate; HCEC, human corneal epithelial cells; RT, reverse transcription; siRNA, small interfering RNA; CPA, cyclopiazonic acid; pF, picofarad(s); DIDS, 4,4′-diisothiocyanostilbene-2,2′-disulfonic acid.
REFERENCES
- 1.Klyce SD. Investig. Ophthalmol. Vis. Sci. 1977;16:968–973. [PubMed] [Google Scholar]
- 2.Lu L, Reinach PS, Kao WW. Exp. Biol. Med. 2001;226:653–664. doi: 10.1177/153537020222600711. [DOI] [PubMed] [Google Scholar]
- 3.Yang H, Sun X, Wang Z, Ning G, Zhang F, Kong J, Lu L, Reinach PS. J. Membr. Biol. 2003;194:47–58. doi: 10.1007/s00232-003-2025-9. [DOI] [PubMed] [Google Scholar]
- 4.Putney JW, Jr., Bird GS. Cell. 1993;75:199–201. doi: 10.1016/0092-8674(93)80061-i. [DOI] [PubMed] [Google Scholar]
- 5.Clapham DE. Cell. 1995;80:259–268. doi: 10.1016/0092-8674(95)90408-5. [DOI] [PubMed] [Google Scholar]
- 6.Tsien RW, Tsien RY. Annu. Rev. Cell Biol. 1990;6:715–760. doi: 10.1146/annurev.cb.06.110190.003435. [DOI] [PubMed] [Google Scholar]
- 7.Putney JW, Jr., Bird GS. Endocr. Rev. 1993;14:610–631. doi: 10.1210/edrv-14-5-610. [DOI] [PubMed] [Google Scholar]
- 8.Putney JW., Jr Cell Calcium. 1986;7:1–12. doi: 10.1016/0143-4160(86)90026-6. [DOI] [PubMed] [Google Scholar]
- 9.Irvine RF. FEBS Lett. 1990;263:5–9. doi: 10.1016/0014-5793(90)80692-c. [DOI] [PubMed] [Google Scholar]
- 10.Berridge MJ. Biochem. J. 1995;312:1–11. doi: 10.1042/bj3120001. [DOI] [PMC free article] [PubMed] [Google Scholar]
- 11.Randriamampita C, Tsien RY. Nature. 1993;364:809–814. doi: 10.1038/364809a0. [DOI] [PubMed] [Google Scholar]
- 12.Csutora P, Su Z, Kim HY, Bugrim A, Cunningham KW, Nuccitelli R, Keizer JE, Hanley MR, Blalock JE, Marchase RB. Proc. Natl. Acad. Sci. U. S. A. 1999;96:121–126. doi: 10.1073/pnas.96.1.121. [DOI] [PMC free article] [PubMed] [Google Scholar]
- 13.Harteneck C. Cell Calcium. 2003;33:303–310. doi: 10.1016/s0143-4160(03)00043-5. [DOI] [PubMed] [Google Scholar]
- 14.Montell C. Sci. STKE. 2001;2001:RE1. doi: 10.1126/stke.2001.90.re1. [DOI] [PubMed] [Google Scholar]
- 15.Landsberg JW, Yuan JX. News Physiol. Sci. 2004;19:44–50. doi: 10.1152/nips.01457.2003. [DOI] [PubMed] [Google Scholar]
- 16.Zhang S, Remillard CV, Fantozzi I, Yuan JX. Am. J. Physiol. 2004;287:C1192–C1201. doi: 10.1152/ajpcell.00158.2004. [DOI] [PubMed] [Google Scholar]
- 17.Gregory RB, Rychkov G, Barritt GJ. Biochem. J. 2001;354:285–290. doi: 10.1042/0264-6021:3540285. [DOI] [PMC free article] [PubMed] [Google Scholar]
- 18.Ma HT, Patterson RL, van Rossum DB, Birnbaumer L, Mikoshiba K, Gill DL. Science. 2000;287:1647–1651. doi: 10.1126/science.287.5458.1647. [DOI] [PubMed] [Google Scholar]
- 19.van Rossum DB, Patterson RL, Ma HT, Gill DL. J. Biol. Chem. 2000;275:28562–28568. doi: 10.1074/jbc.M003147200. [DOI] [PubMed] [Google Scholar]
- 20.Rychkov GY, Litjens T, Roberts ML, Barritt GJ. Cell Calcium. 2005;37:183–191. doi: 10.1016/j.ceca.2004.09.001. [DOI] [PubMed] [Google Scholar]
- 21.Harks EG, Camina JP, Peters PH, Ypey DL, Scheenen WJ, van Zoelen EJ, Theuvenet AP. FASEB J. 2003;17:941–943. doi: 10.1096/fj.02-0786fje. [DOI] [PubMed] [Google Scholar]
- 22.Chung MK, Lee H, Mizuno A, Suzuki M, Caterina MJ. J. Neurosci. 2004;24:5177–5182. doi: 10.1523/JNEUROSCI.0934-04.2004. [DOI] [PMC free article] [PubMed] [Google Scholar]
- 23.Delmas P, Wanaverbecq N, Abogadie FC, Mistry M, Brown DA. Neuron. 2002;34:209–220. doi: 10.1016/s0896-6273(02)00641-4. [DOI] [PubMed] [Google Scholar]
- 24.Trebak M, Bird GS, McKay RR, Putney JW., Jr J. Biol. Chem. 2002;277:21617–21623. doi: 10.1074/jbc.M202549200. [DOI] [PubMed] [Google Scholar]
- 25.Lee YM, Kim BJ, Kim HJ, Yang DK, Zhu MH, Lee KP, So I, Kim KW. Am. J. Physiol. 2003;284:G604–G616. doi: 10.1152/ajpgi.00069.2002. [DOI] [PubMed] [Google Scholar]
- 26.Xu SZ, Zeng F, Boulay G, Grimm C, Harteneck C, Beech DJ. Br. J. Pharmacol. 2005;145:405–414. doi: 10.1038/sj.bjp.0706197. [DOI] [PMC free article] [PubMed] [Google Scholar]
- 27.Voets T, Prenen J, Fleig A, Vennekens R, Watanabe H, Hoenderop JG, Bindels RJ, Droogmans G, Penner R, Nilius B. J. Biol. Chem. 2001;276:47767–47770. doi: 10.1074/jbc.C100607200. [DOI] [PubMed] [Google Scholar]
- 28.Schindl R, Kahr H, Graz I, Groschner K, Romanin C. J. Biol. Chem. 2002;277:26950–26958. doi: 10.1074/jbc.M203700200. [DOI] [PubMed] [Google Scholar]
- 29.Hu HZ, Gu Q, Wang C, Colton CK, Tang J, Kinoshita-Kawada M, Lee LY, Wood JD, Zhu MX. J. Biol. Chem. 2004;279:35741–35748. doi: 10.1074/jbc.M404164200. [DOI] [PubMed] [Google Scholar]
- 30.Li WP, Tsiokas L, Sansom SC, Ma R. J. Biol. Chem. 2004;279:4570–4577. doi: 10.1074/jbc.M304334200. [DOI] [PubMed] [Google Scholar]
- 31.Wang X, Pluznick JL, Wei P, Padanilam BJ, Sansom SC. Am. J. Physiol. 2004;287:C357–C364. doi: 10.1152/ajpcell.00068.2004. [DOI] [PubMed] [Google Scholar]
- 32.Araki-Sasaki K, Ohashi Y, Sasabe T, Hayashi K, Watanabe H, Tano Y, Handa H. Investig. Ophthalmol. Vis. Sci. 1995;36:614–621. [PubMed] [Google Scholar]
- 33.Yang H, Wang Z, Miyamoto Y, Reinach PS. J. Membr. Biol. 2001;183:93–101. doi: 10.1007/s00232-001-0057-6. [DOI] [PubMed] [Google Scholar]
- 34.Grynkiewicz G, Poenie M, Tsien RY. J. Biol. Chem. 1985;260:3440–3450. [PubMed] [Google Scholar]
- 35.Sun XC, Cui M, Bonanno JA. BMC Physiology. 2004 doi: 10.1186/1472-6793-4-8. http://www.biomed-central.com/1472-6793/4/8. [DOI] [PMC free article] [PubMed] [Google Scholar]
- 36.Sun XC, Bonanno JA. Exp. Eye Res. 2003;77:287–295. doi: 10.1016/s0014-4835(03)00150-7. [DOI] [PMC free article] [PubMed] [Google Scholar]
- 37.Tang Y, Tang J, Chen Z, Trost C, Flockerzi V, Li M, Ramesh V, Zhu MX. J. Biol. Chem. 2000;275:37559–37564. doi: 10.1074/jbc.M006635200. [DOI] [PubMed] [Google Scholar]
- 38.Barry PH. J. Neurosci. Methods. 1994;51:107–116. doi: 10.1016/0165-0270(94)90031-0. [DOI] [PubMed] [Google Scholar]
- 39.Golovina VA, Platoshyn O, Bailey CL, Wang J, Limsuwan A, Sweeney M, Rubin LJ, Yuan JX. Am. J. Physiol. 2001;280:H746–H755. doi: 10.1152/ajpheart.2001.280.2.H746. [DOI] [PubMed] [Google Scholar]
- 40.Skryma R, Mariot P, Bourhis XL, Coppenolle FV, Shuba Y, Vanden Abeele F, Legrand G, Humez S, Boilly B, Prevarskaya N. J. Physiol. (Lond.) 2000;527:71–83. doi: 10.1111/j.1469-7793.2000.00071.x. [DOI] [PMC free article] [PubMed] [Google Scholar]
- 41.Zweifach A, Lewis RS. J. Gen. Physiol. 1996;107:597–610. doi: 10.1085/jgp.107.5.597. [DOI] [PMC free article] [PubMed] [Google Scholar]
- 42.Sweeney M, Yu Y, Platoshyn O, Zhang S, McDaniel SS, Yuan JX. Am. J. Physiol. 2002;283:L144–L155. doi: 10.1152/ajplung.00412.2001. [DOI] [PubMed] [Google Scholar]
- 43.Spassova MA, Soboloff J, He LP, Hewavitharana T, Xu W, Venkatachalam K, van Rossum DB, Patterson RL, Gill DL. Biochim. Biophys. Acta. 2004;1742:9–20. doi: 10.1016/j.bbamcr.2004.09.001. [DOI] [PubMed] [Google Scholar]
- 44.Montell C. Sci. STKE. 2005;2005:RE3. doi: 10.1126/stke.2722005re3. [DOI] [PubMed] [Google Scholar]
- 45.Yu Y, Sweeney M, Zhang S, Platoshyn O, Landsberg J, Rothman A, Yuan JX. Am. J. Physiol. 2003;284:C316–C330. doi: 10.1152/ajpcell.00125.2002. [DOI] [PubMed] [Google Scholar]
- 46.Padar S, Bose DD, Livesey JC, Thomas DW. Biochem. Pharmacol. 2005;69:1177–1186. doi: 10.1016/j.bcp.2005.01.011. [DOI] [PubMed] [Google Scholar]
- 47.McDaniel SS, Platoshyn O, Wang J, Yu Y, Sweeney M, Krick S, Rubin LJ, Yuan JX. Am. J. Physiol. 2001;280:L870–L880. doi: 10.1152/ajplung.2001.280.5.L870. [DOI] [PubMed] [Google Scholar]
- 48.Ng LC, Gurney AM. Circ. Res. 2001;89:923–929. doi: 10.1161/hh2201.100315. [DOI] [PubMed] [Google Scholar]
- 49.Sui GP, Wu C, Fry CH. J. Urol. 2001;165:621–626. doi: 10.1097/00005392-200102000-00084. [DOI] [PubMed] [Google Scholar]
- 50.Bradley JE, Anderson UA, Woolsey SM, Thornbury KD, McHale NG, Hollywood MA. Am. J. Physiol. 2004;286:C1078–C1088. doi: 10.1152/ajpcell.00463.2003. [DOI] [PubMed] [Google Scholar]
- 51.Hobai IA, Hancox JC, Levi AJ. Am. J. Physiol. 2000;279:H692–H701. doi: 10.1152/ajpheart.2000.279.2.H692. [DOI] [PubMed] [Google Scholar]
- 52.Petkov GV, Fusi F, Saponara S, Gagov HS, Sgaragli GP, Boev KK. Acta Physiol. Scand. 2001;173:257–265. doi: 10.1046/j.1365-201X.2001.00907.x. [DOI] [PubMed] [Google Scholar]
- 53.Rich A, Rae JL. J. Membr. Biol. 1995;144:177–184. doi: 10.1007/BF00232803. [DOI] [PubMed] [Google Scholar]
- 54.Islam M, Akhtar RA. Exp. Eye Res. 2000;70:261–269. doi: 10.1006/exer.1999.0783. [DOI] [PubMed] [Google Scholar]
- 55.Larsson KP, Peltonen HM, Bart G, Louhivuori LM, Penttonen A, Antikainen M, Kukkonen JP, Akerman KE. J. Biol. Chem. 2005;280:1771–1781. doi: 10.1074/jbc.M406073200. [DOI] [PubMed] [Google Scholar]
- 56.Venkatachalam K, Zheng F, Gill DL. Novartis Found. Symp. 2004;258:172–185. discussion 185–178, 263–176. [PubMed] [Google Scholar]
- 57.Zitt C, Obukhov AG, Strubing C, Zobel A, Kalkbrenner F, Luckhoff A, Schultz G. J. Cell Biol. 1997;138:1333–1341. doi: 10.1083/jcb.138.6.1333. [DOI] [PMC free article] [PubMed] [Google Scholar]
- 58.Hamill OP, Marty A, Neher E, Sakmann B, Sigworth FJ. Pfluegers Arch. 1981;391:85–100. doi: 10.1007/BF00656997. [DOI] [PubMed] [Google Scholar]
- 59.Nilius B. Sci. STKE. 2004;2004:PE36. doi: 10.1126/stke.2432004pe36. [DOI] [PubMed] [Google Scholar]
- 60.Ma R, Sansom SC. J. Am. Soc. Nephrol. 2001;12:47–53. doi: 10.1681/ASN.V12147. [DOI] [PubMed] [Google Scholar]
- 61.Mergler S, Pleyer U, Reinach P, Bednarz J, Dannowski H, Engelmann K, Hart-mann C, Yousif T. Exp. Eye Res. 2005;80:285–293. doi: 10.1016/j.exer.2004.09.012. [DOI] [PubMed] [Google Scholar]