

Abstract
Quantitative estimates of cerebral metabolic rate of oxygen utilization using magnetic resonance imaging can have profound implications for the understanding of brain metabolic activity as well as the investigation of cerebrovascular disease. In this study, five normal volunteers were studied. All images were acquired on a Siemens 1.5 T scanner (Siemens Medical Systems Inc, Erlangen, Germany). Cerebral blood flow (CBF) was obtained in vivo with a dynamic imaging approach and the acquired images were post-processed with the singular value decomposition method (SVD). In addition, a multi-echo gradient echo/spin echo sequence was employed to provide MR estimates of oxygen extraction fraction (MR_OEF) in vivo. Subsequently, an absolute measure of MR cerebral metabolic rate of oxygen utilization (MR_CMRO2) was obtained in all subjects by taking the product of CBF and MR_OEF. A mean MR_CMRO2 of 28.94 ± 3.26 ml/min/100 g and 12.57 ± 3.11 ml/min/100 g was obtained for gray matter and white matter, respectively, suggesting that the gray matter utilizes more oxygen than white matter under normal physiological conditions. These results yield a gray matter to white matter CMRO2 ratio of 2.37 ± 0.37, which is comparable to the reported values in the literature. More studies are needed to further improve on the accuracy as well as shortening the required data acquisition time so that the proposed approaches can be utilized in a routine clinical setting.
Keywords: BOLD, cerebral metabolic rate of oxygen utilization
INTRODUCTION
When brain tissue is under an ischemic insult resulting from a reduction of cerebral blood flow (CBF), an increase in oxygen extraction fraction (OEF) normally occurs to maintain normal neuronal function. Despite the compromised CBF, the ischemic tissues can potentially remain viable for a long period of time as long as OEF does not reach its maximum available level. Conversely, when the maximum OEF is reached, the inability to maintain normal neuronal function can trigger a cascade of cellular events, which could eventually lead to cell death. Therefore, while CBF is a good indicator for oxygen delivery, CBF by itself does not precisely determine tissue viability. It has been suggested that the balance between oxygen delivery and oxygen demand can more accurately depict tissue viability under ischemic insults.1 Therefore, the ability to obtain quantitative estimates of cerebral metabolic rate of oxygen utilization (CMRO2), which is usually defined as the product of cerebral blood flow, oxygen extraction fraction and arterial oxygen content, can be of critical importance for the investigation of cerebrovascular disorders.
To date, positron emission tomography (PET) has been the method of choice for obtaining in vivo measurements of CMRO2. With a quantitative estimate of CBF and OEF, an absolute measure of CMRO2 can be obtained in vivo.2 However, PET requires radioactive isotopes, is invasive, is physician-intensive, and has certain risks. Furthermore, the required onsite cyclotron for obtaining quantitative measures of CMRO2 has limited its accessibility to major medical centers. Therefore, there is an increasing need to develop a non-invasive imaging method that is able to provide similar physiological parameters as those available via PET in a ubiquitous imaging modality such as magnetic resonance (MR) imaging.
In light of recent advances in MR imaging, it is now possible to not only obtain anatomical information but also to provide physiological parameters with MRI. Specifically, many investigators have demonstrated that changes of blood oxygen saturation cause alterations of T2* and/or T2 in tissue and thus MR signal intensity.3,4 This phenomenon, blood oxygen level dependent (BOLD) contrast, has been widely utilized for the investigation of brain activation during an external sensory and/or cognitive input.5,6 Intriguing results have been reported, demonstrating its ability to reveal how the brain works. Nevertheless, the extent of signal changes in BOLD contrast is multi-factorial and affected by many physiological parameters such as CBF, cerebral blood volume (CBV), hematocrit, etc. Therefore, approaches to provide a quantitative estimate of blood oxygen saturation in vivo are highly desirable. With a signal model proposed by Yablonskiy and Haacke7 characterizing signal dephasing induced by the presence of deoxyhemoglobin, we have recently demonstrated that quantitative estimates of cerebral blood oxygen saturation can be obtained in vivo,8 which in turn can provide a measure of OEF with MRI (MR_OEF). However, an absolute measure of CMRO2 using MR is still lacking. In this paper, we will demonstrate that CBF and OEF measurements can be obtained with a dynamic approach and through the BOLD effects, respectively, which in turn yield an absolute measurement of CMRO2 (MR_CMRO2) in normal volunteers.
MATERIALS AND METHODS
Imaging protocols
Five normal healthy subjects were recruited for this study and written informed consent was obtained from all subjects. All images were acquired on a 1.5 T Vision whole body scanner (Siemens Medical Inc., Erlangen, Germany) with a maximum gradient strength of 25 mT/m and a ramp time of 0.6 ms. A standard circularly polarized head coil was used as the transmit/receive coil. A system shimming was carefully employed prior to the imaging experiments. A two-dimensional multi-echo gradient echo/spin echo sequence (Fig. 1) was used to acquire images, which were subsequently used to extract R2, R2′, cerebral venous blood volume (λ) and MR_OEF.8 In total, 21 echoes with TEs ranging from 62.6 to 161.8 ms were acquired. All acquired echoes were odd echoes so that signal from flowing spins such as blood could be minimized. The echo spacing between two adjacent echoes was 4.96 ms. The spin echo occurred at the eleventh echo with TE = 112.2 ms and 10 gradient echoes were acquired symmetrically on each side of the spin echo. The imaging parameters were as follows: TR = 1 s; field-of-view (FOV) = 160 × 256 mm2; a matrix size of 80 × 128 resulting in an inplane resolution of 2 × 2 mm2; slice thickness (TH) = 8 mm; three slices with a gap of 4 mm; and eight acquisitions to improve the signal-to-noise ratio. The total data acquisition time was 10 min and 40 s. In addition, a two-dimensional single-shot gradient echo echo-planar imaging (EPI) sequence was used to obtain CBF and CBV maps. The imaging parameters were as follows: TR = 2 s; TE = 54 ms; TH = 6 mm; in-plane resolution = 1.8 × 1.1 mm2; and FA = 60°. This sequence was repeated 40 times while the subjects were lying still inside the MR scanner. Contrast agent (0.1 mmol/kg, Gd-DTPA) was administered intravenously at the completion of the fifth scan.
Figure 1.

Sequence diagram of the multi-echo gradient echo/spin echo sequence. GSS, GPE, and GRO represent the slice select, phase encoding and frequency encoding, respectively. In addition, ADC indicates where images are acquired
MR_OEF estimates
In order to obtain quantitative estimates of MR_OEF, images acquired by the multi-echo gradient echo/spin echo sequence were employed. The images were first collapsed to a matrix size of 64 × 64 prior to any data processing in order to improve signal-to-noise. Detailed descriptions as to how an absolute measure of cerebral venous blood oxygen saturation can be obtained have been given elsewhere.8 Only a short description is given below.
With the theoretical model proposed by Yablonskiy and Haacke7 to characterize MR signal dephasing phenomena in the static dephasing regime, a relationship between R2′ and fractional cerebral venous blood oxygen saturation (CBOS) is given as follows:7
| (1) |
where γ is the gyromagnetic ratio, which is equal to 2.68 × 10⁸ rad/s/T; Hct is the fractional hematocrit; B0 is the static magnetic field strength; and Δχ0 is the susceptibility difference between fully oxygenated and fully deoxygenated blood which has been measured to be 0.18 ppm per unit Hct.9 In addition, R2′ ( , where and R2 = 1/T2) is the relaxation rate, which is commonly employed to characterize the effects of local susceptibilities and λ is the venous blood volume fraction. Both R2′ and λ can be estimated from the images acquired by the multi-echo gradient echo/spin echo sequence (please see Ref. 8 for details). In order to obtain cerebral blood oxygen saturation, Hct in eqn (1) was replaced by cerebral Hct (cHct). This was done by assuming that the ratio between small vessel to large vessel Hct is 0.85. Finally, assuming the arterial blood is fully oxygenated, the cerebral oxygen extraction fraction (MR_OEF) can then be calculated as
| (2) |
Measurements of cerebral hemodynamics and correction of large vessel effects
The images acquired by the two-dimensional single-shot EPI sequence were first converted to the ΔR2* maps. Subsequently, an arterial input function was chosen from the M1 section of the middle cerebral artery for each subject. A least squares exponential fitting was employed to minimize the secondary circulation. Finally, singular value decomposition (SVD) deconvolution as proposed by Ostergaard et al.10,11 was employed to obtain estimates of cerebral hemodynamics including CBF, CBV, and mean transit time.
In our study, a gradient echo EPI sequence was utilized to obtain quantitative estimates of CBF. The increased sensitivity to large vessels with a gradient echo EPI sequence may lead to an overestimation of CBF when compared to a spin echo EPI sequence.12,13 Therefore, it is of critical importance to minimize the effects of large vessels in MR-measured CBF prior to the final calculation of MR_CMRO2. A simple thresholding method utilizing CBV maps was employed to minimize the effects of large vessels in the CBF maps. A normalized CBV histogram was first obtained from all five volunteers. As shown in Fig. 2, the majority of CBV is less than 10%. Thus, a Gaussian curve fit was applied to the histogram within this range. A CBV threshold of 6.8% was then chosen based on the full width half maximum (FWHM). Subsequently, for pixels that had CBV values greater than the experimentally derived CBV threshold, the corresponding pixels in the CBF maps were set to zero. A closing operation, in which only nonzero neighboring pixels were averaged to yield the replacing value, was carried out to remove the holes caused by the thresholding processes. In addition, a low-pass filter was employed for CBF maps to achieve the same spatial resolution as that in MR_OEF maps. Finally, a co-registration process between MR_OEF and CBF was performed and MR_CMRO2 maps were then obtained as:
| (3) |
Figure 2.

The CBV histogram from all five volunteers (solid line), and the fitted Gaussian curve (dashed line). Note that only CBV ranging from 0 to 20% are shown in this figure. The frequency of CBV above 20% is negligible
A region-of-interest (ROI) analysis was performed to obtain regional measurements of MR_CMRO2. Four ROIs, one in the cortical gray matter and one in the subcortical white matter regions of each hemisphere, were defined.
RESULTS
Plate 1 demonstrates the effects of large vessels in both CBV and CBF maps. Prominent CBV (>7%) is observed at the cortical sulci, which coincides with the elevated CBF prior to the application of CBV threshold. In contrast, substantial reductions in both CBV as well as CBF are observed, particularly at the cortical sulci when the experimentally defined CBV threshold is employed, minimizing the effects of large vessels on both the CBF and CBV maps. Quantitative estimates of CBF for all subjects are summarized in Table 1. The group mean and inter-subject variability of CBF are 67.51 ± 10.53 ml/min/100 g and 33.89 ± 5.11 ml/min/100 g for the gray matter and white matter, respectively, in good agreement with those reported in the literature.14
Table 1.
ROI analysis of CBF (ml/100 g/min) on five volunteers
| ROI GM | ROI WM | |
|---|---|---|
| 1 | 75.9 ± 12.6 | 37.0 ± 8.6 |
| 2 | 73.0 ± 15.1 | 38.4 ± 10.9 |
| 3 | 72.4 ± 12.1 | 34.0 ± 10.4 |
| 4 | 49.7 ± 9.9 | 25.3 ± 9.4 |
| 5 | 66.7 ± 13.4 | 33.90 ± 12.2 |
| Mean/SD | 67.5 ± 10.5 | 33.90 ± 5.1 |
Representative examples of MR estimated CBF, MR_OEF, and MR_CMRO2 are shown in Plate 2. A rather uniform OEF, on the order of 40%, across both hemispheres is observed, suggesting that the brain extracts a similar amount of oxygen in both gray and white matter. In contrast, a clear demarcation between gray and white matter in the MR_CMRO2 map is observed, with gray matter exhibiting higher CMRO2 values than those in white matter.
Finally, regional measurements of MR_OEF and MR_CMRO2 are summarized in Tables 2 and 3 for all subjects, respectively. The group mean and inter-subject variability of MR_OEF is 39.9 ± 2.7% for the whole brain. ROI GML and ROI GMR represent MR_CMRO2 measurements obtained from ROIs defined in the gray matter while ROI WML and ROI WMR summarize MR_CMRO2 measurements of the white matter in both the left and right hemispheres, respectively. Notice the MR_CMRO2 is symmetric for both hemispheres in all subjects. The group mean and inter-subject variability of MR_CMRO2 are 28.9 ± 3.3 ml/min/100 g and 12.6 ± 3.1 ml/min/100 g for gray matter and white matter, respectively, yielding a gray matter to white matter CMRO2 ratio (GMcmro2/WMcmro2) of 2.37 ± 0.37. The group mean and inter-subject variability of MR_CMRO2 for the whole brain is 20.8 ± 3.2 ml/min/100 g.
Table 2.
ROI analysis of OEF (%) on five volunteers
| Whole brain | |
|---|---|
| 1 | 44.2 ± 5.0 |
| 2 | 40.2 ± 11.6 |
| 3 | 37.2 ± 5.7 |
| 4 | 39.5 ± 11.5 |
| 5 | 38.4 ± 7.6 |
| Mean/SD | 39.9 ± 2.7 |
Table 3.
ROI analysis of CMRO2 on five volunteers
| ROI GML | ROI GMR | ROI WML | ROI WMR | |
|---|---|---|---|---|
| 1 | 32.2 ± 5.5 | 32.1 ± 7.1 | 16.9 ± 5.9 | 19.0 ± 3.8 |
| 2 | 30.2 ± 7.7 | 30.1 ± 9.7 | 16.3 ± 4.2 | 17.1 ± 5.4 |
| 3 | 26.1 ± 5.5 | 27.3 ± 6.1 | 11.0 ± 4.3 | 13.4 ± 3.6 |
| 4 | 23.0 ± 7.3 | 22.0 ± 7.2 | 8.3 ± 4.1 | 9.7 ± 3.7 |
| 5 | 27.3 ± 5.6 | 26.3 ± 5.2 | 11.5 ± 5.2 | 11.9 ± 4.3 |
| Mean/SD | 27.8 ± 3.6 | 27.5 ± 3.9 | 12.8 ± 3.7 | 14.2 ± 3.8 |
DISCUSSION
In order to obtain quantitative estimates of CMRO2, two physiological parameters, namely CBF and OEF, are required. With a dynamic imaging approach and post-processed using the SVD method as proposed by Ostergaard et al., quantitative estimates of CBF are obtained in normal volunteers. The group mean and inter-subject variability of CBF are 67.5 ± 10.5 ml/min/100 g and 33.9 ± 5.1 ml/min/100 g in the gray matter and white matter, respectively, in excellent agreement with the reported values in the literature.14 In addition, a multi-echo gradient echo/spin echo sequence is employed to obtain absolute measures of MR_OEF. Assuming that the arterial blood is fully saturated, a reasonable assumption for the normal healthy subjects or patients without pulmonary diseases, our results suggest that cerebral venous blood oxygen saturation is on the order of 60%. This finding is in excellent agreement with our previously reported results8 in normal volunteers, demonstrating the consistency of the proposed approach for obtaining MR_OEF. After obtaining both physiological parameters independently, an absolute measure of MR_CMRO2 can be obtained by multiplying the CBF with MR_OEF.
As shown in Plate 2, the MR_CMRO2 map reveals a clear contrast between gray matter and white matter with gray matter having a higher CMRO2 value than that of white matter. A GMcmro2/WMcmro2 ratio of 2.37 ± 0.37 is obtained from our study. With PET and an oxygen-15 steady-state inhalation technique, Lammertsma et al.14 measured CMRO2 and OEF in normal subjects and brain tumour and stroke patients. They reported a GMcmro2/WMcmro2 ratio of 1.97 in normal subjects, which is slightly lower than that obtained from our studies. When examining their results closely, our results exhibit a higher CBF, particularly in the gray matter (67.5 ± 10.5 ml/min/100 g in our study vs 59 ± 8 ml/min/100 g in Lammertsma et al.’s PET study), leading to a higher CMRO2 in gray matter and hence the elevated GMcmro2/WMcmro2 ratio. The observed higher CBF based on MR studies is perhaps not surprising. With the improved spatial resolution, the partial volume effects are likely to be minimized in MR images. Therefore, a higher CBF value is commonly seen with MR approaches when compared to that obtained using PET. Nevertheless, the GMcmro2/WMcmro2 ratio obtained from our studies still compares favorably with that reported in the literature.
Since a quantitative estimate of MR_CMRO2 is obtained with the proposed approach, it is necessary to assess the accuracy of the MR measured CMRO2 with that reported in the literature. One of the major discrepancies between MR measured CMRO2 and that obtained via PET is the effects of arterial oxygen content. MR_CRMO2 is computed by simply taking the product of CBF and OEF vs the product of CBF, OEF and arterial oxygen content (CaO2) as normally been done in PET. Therefore, in order to compare our experimental results to those obtained from other modalities, such as PET, CaO2 is needed. Under normal physiological conditions, CaO2 ranges between 16 and 20 ml O2/100 ml blood. Therefore, the MR measured CMRO2 ranges between 4.4 and 5.5 ml/100 g/min for gray matter and 2.16–2.70 for white matter with the normal CaO2, respectively. With PET and normal volunteers, Ishii et al. demonstrated that the normal regional CMRO2 ranged between 3.40 and 4.36 ml/100 g/min at different cortical areas.15 In addition, with a global assessment of CMRO2 using PET, Leblanc reported that the whole brain CMRO2 ranged between 3.29–3.45 ml/100 g/min,16 vs our whole brain CMRO2 range, 3.29–4.12 ml/100 g/min. Clearly, our estimates of CMRO2 are slightly higher than that obtained by PET. There are two potential explanations for the observed higher MR_CMRO2. First, as mentioned previously, the MR measured CBF appears to be higher than that obtained via PET, presumably due to the improved spatial resolution and thus minimizing partial volume effects. As a result, a higher CMRO2 is anticipated with the MR approach. Second, while a threshold approach based on a CBV histogram is employed to minimize the effects of large vessels in the estimates of CBF, some residual large vessel effects may still be present. Under normal physiological conditions, CBV is known to be within 3–5% and 2–3% for gray and white matter, respectively. However, the partial volume effect from large vessels causes an elevated CBV in some cortical areas, seen as the tail on the right side of CBV histogram in Fig. 2. The CBV distribution in gray matter and white matter can each be represented by a Gaussian curve. Ideally, by excluding the CBV in the region which has large vessel effect, the distribution of CBV for the whole brain can be approximated by the sum of two Gaussian curves from gray and white matter. Since the mean of CBV from gray and white matter are comparable and partial volume effect exists between the two tissues, a single Gaussian curve can be utilized to approximate the CBV distribution for the whole brain. This Gaussian curve is expected to have a mean roughly at 3.3% and a standard deviation of 1.5–2.0% based on the normal physiological range of CBV. Therefore, the upper limit of CBV without large vessel effect for the whole brain can be roughly calculated as mean +3 standard deviations, which yields a range of 8–10%. In this study, a Gaussian curve fit was performed on the CBV histogram ranging from 0 to 10% in an attempt to minimize the effects of large vessels. The mean and standard deviation of the fitted Gaussian curve are 3.28 and 3.01%, respectively. Therefore, a CBV threshold of 6.8% is then determined based on the FWHM of the fitted Gaussian curve. As shown in Plate 1, the application of the CBV threshold successfully removes some of the large vessels in different cortical areas. Nevertheless, similar to other thresholding based approaches in general, the predefined CBV threshold can work to some extent but might not be able to remove all the large vessel effects, causing a potential elevation in the measures of CBF. Alternatively, a SE EPI sequence, which has been suggested as having minimal effects from large vessels,12,13 can be employed to obtain estimates of CBF. However, the compromised signal-to-noise ratio in the estimates of CBF with SE EPI sequences has prevented us from utilizing this approach. Although more studies will be needed to further investigate the effects of large vessels in the estimates of MR_CMRO2, our preliminary results demonstrate that quantitative measures of MR_CMRO2 can be obtained in vivo and results are within the physiological range as reported via PET.
The approach for obtaining quantitative estimates of MR_OEF using a multi-echo gradient echo/spin echo deserves further discussion. We have previously demonstrated that a quantitative estimate of cerebral blood oxygen saturation can be obtained with this approach.8 In eight healthy volunteers, a mean cerebral blood oxygen saturation of 58.7 ± 1.8% was obtained, indicating a MR_OEF of 41.3%. Consistent with our previously reported results, a mean MR_OEF of 39.9 ± 2.7% was obtained from all subjects. While these results are in good agreement with the results reported using different modalities such as PET, several potential confounding factors inherent in the estimates of MR_OEF can impose errors on the estimates of MR_CMRO2. Discussions as to how different confounding factors might affect the accuracy of MR_OEF estimates have been addressed in great detail in Ref. 8, only a brief discussion is given below for each potential confounding factor. First, the signal model proposed by Yablonskiy and Haacke assumes that there are no diffusion effects as well as no signal contributions from the blood.7 Given the normal ranges of CBV as well as the field strength employed in our study, these two assumptions are likely to be reasonable and should not impose substantial errors in the estimates of in vivo MR_CMRO2.
Second, in order to quantify cerebral blood oxygen saturation, a prior knowledge of Hct is required when both R2′ and λ are known [eqn (1)]. However, a direct measurement of Hct from each volunteer is not done owing to the fact that the Hct has been known to be stable in humans. Hct in large vessel ranges between 0.4 and 0.45 depending on the genders.17 Therefore, a constant Hct of 0.42 is assumed in this study for all volunteers. However, in order to estimate cerebral blood oxygen saturation via eqn (1), large vessel Hct needs to be converted to the small vessel Hct. A wide range of the ratio of small vessel ‘cerebral Hct’ (cHct) to large vessel Hct (cHct/Hct = 0.62–0.92) has been reported by different investigators in various species including humans.18–22 Despite the discrepancies in the reported cHct/Hct ratios, PET has employed a general consensus of cHct/Hct = 0.85.23 In our study, we adapted this cHct/Hct ratio from PET study in the estimate of CBOS/OEF. Since a constant Hct is used in our study, errors may have occurred due to the potential variation in Hct between subjects as well as the uncertainty in cHct/Hct ratio. However, the errors induced by the former case can be easily overcome with a direct measurement of Hct from each subject. On the other hand, the errors induced by the latter factor are likely to be small under normal physiological conditions. How to obtain cHct/Hct accurately is beyond the scope of this study.
Third, we have previously demonstrated that the accuracy of MR_OEF is on the order of 9% based on the imaging parameters, the field strength, and the postprocessing schemes employed. The sources of error are likely to play a similar role in the estimates of MR_CMRO2. Nevertheless, with recently available high field scanners such as 3 T systems, the improved signal-to-noise ratio as well as sensitivity in detecting deoxyhemglobin induced signal alterations should further improve the accuracy of the proposed methods.
CONCLUSION
Although it has been demonstrated that CMRO2 can be obtained with MR, it requires the utilization of either 13C or 17O magnetic resonance spectroscopy (MRS).24–27 In addition to the fact that radioactive isotopes are needed, the inability to provide spatially resolved information as commonly associated with MRS has hampered the clinical utilities of these approaches. We have demonstrated that quantitative estimates of CMRO2 can be obtained in normal subjects based on BOLD contrast. While some confounding factors remain, our results are in excellent agreement with those reported in the literature via PET. With the detailed anatomical information available in MRI and the widely accessible MR scanners, the ability to quantitatively estimate CMRO2 in vivo is likely to shed light on our understanding of the pathophysiological aspects of cerebrovascular disease.
Plate 1.

Representative CBV [Fig. 2(a)] and CBF [Fig. 2(c)] maps before and after removing the large vessel effect [Fig. 2(b) and (d)]. The color bars represent absolute CBV in percent and CBF in ml/100 g/min
Plate 2.
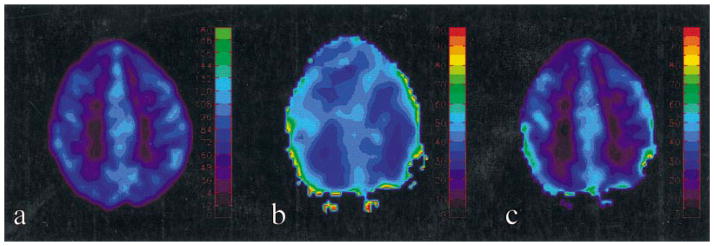
CBF [Fig. 3(a)], OEF [Fig. 3(b)] and CMRO2 [Fig. 3(c)] maps from one subject are shown. The color bars represent the CBF in ml/100 g/min in (a), MR_OEF in percent in (b), and MR_CMRO2 in ml/100 g/min in (c), respectively
Acknowledgments
Contract/grant sponsor: NIH; contract grant number: NS37312.
This work was supported in part by a NIH grant NS37312.
Abbreviations used
- BOLD
blood oxygenation level-dependent
- CaO2
arterial oxygen content
- CBOS
cerebral blood oxygen saturation
- CBF
cerebral blood flow
- CMRO2
cerebral metabolic rate of oxygen
- FWHM
full width half maximum
- MR_OEF
MR measured oxygen extraction fraction
- MR_CMRO2
MR measured cerebral metabolic rate of oxygen
- MRS
magnetic resonance spectroscopy
- OEF
oxygen extraction fraction
- PET
positron emission tomography
- SVD
singular value decomposition
References
- 1.Powers WJ, Grubb RL, Jr, Darriet D, Raichle ME. Cerebral blood flow and cerebral metabolic rate of oxygen requirements for cerebral function and viability in humans. J Cereb Blood Flow Metab. 1985;5:600–608. doi: 10.1038/jcbfm.1985.89. [DOI] [PubMed] [Google Scholar]
- 2.Frackowiak RSJ, Lenzi G, Jones T, Heather JD. Quantitative measurement of regional cerebral blood flow and oxygen metabolism in man using 15O and positron emission tomography: theory, procedure, and normal values. J Comput Assist Tomogr. 1980;4(6):727–736. doi: 10.1097/00004728-198012000-00001. [DOI] [PubMed] [Google Scholar]
- 3.Ogawa S, Menon RS, Tank DW, Kim SG, Markle H, Ellermann JM, Ugurbil K. Functional brain mapping by blood oxygenation level-dependent contrast magnetic resonance imaging. Biophys J. 1993;64:803–812. doi: 10.1016/S0006-3495(93)81441-3. [DOI] [PMC free article] [PubMed] [Google Scholar]
- 4.Thulborn KR, Waterton JC, Matthews PM, Radda GK. Oxygenation dependence of the transverse relaxation time of water protons in whole blood at high field. Biochim Biophys Acta. 1982;714:265–270. doi: 10.1016/0304-4165(82)90333-6. [DOI] [PubMed] [Google Scholar]
- 5.Belliveau JW, Kennedy DN, McKinstry RC. Functional mapping of human visual cortex by magnetic resonance imaging. Science. 1991;254:716–719. doi: 10.1126/science.1948051. [DOI] [PubMed] [Google Scholar]
- 6.Kwong KK, Belliveau JW, Chesler DA, Goldberg IE, Weisskoff RM, Poncelet BP, Kennedy DN, Hoppel BE, Cohen MS, Turner R, Cheng HM, Brady TJ, Rosen BR. Dynamic magnetic resonance imaging of human brain activity during primary sensory stimulation. Proc Natl Acad Sci USA. 1992;89:5675–5679. doi: 10.1073/pnas.89.12.5675. [DOI] [PMC free article] [PubMed] [Google Scholar]
- 7.Yablonskiy DA, Haacke EM. Theory of NMR signal behavior in magnetically inhomogeneous tissues: the static dephasing regime. Magn Reson Med. 1994;32:749–763. doi: 10.1002/mrm.1910320610. [DOI] [PubMed] [Google Scholar]
- 8.An H, Lin W. Quantitative measurements of cerebral blood oxygen saturation using magnetic resonance imaging. J Cereb Blood Flow Metab. 2000;20:1225–1336. doi: 10.1097/00004647-200008000-00008. [DOI] [PMC free article] [PubMed] [Google Scholar]
- 9.Weisskoff RM, Kiihne S. MRI susceptometry: Image-based measurement of absolute susceptibility of MR contrast agents and human blood. Magn Reson Med. 1992;24:375–383. doi: 10.1002/mrm.1910240219. [DOI] [PubMed] [Google Scholar]
- 10.Ostergaard L, Weisskoff RM, Chesler DA, Gyldensted C, Rosen BR. High resolution measurement of cerebral blood flow using intravascular tracer bolus passages. Part I: mathematical approach and statistical analysis. Magn Reson Med. 1996;36:715–725. doi: 10.1002/mrm.1910360510. [DOI] [PubMed] [Google Scholar]
- 11.Ostergaard L, Sorensen AG, Kwong KK, Weisskoff RM, Gyldensted C, Rosen BR. High resolution measurement of cerebral blood flow using intravascular tracer bolus passages. Part II: experimental comparison and preliminary results. Magn Reson Med. 1996;36:726–736. doi: 10.1002/mrm.1910360511. [DOI] [PubMed] [Google Scholar]
- 12.Kennan RP, Zhong J, Gore JC. Intravascular susceptibility contrast mechanism in tissues. Magn Reson Med. 1994;31:9–21. doi: 10.1002/mrm.1910310103. [DOI] [PubMed] [Google Scholar]
- 13.Boxerman JL, Hamberg LM, Rosen BR, Weiskoff RM. MR contrast due to intravascular magnetic susceptibility perturbations. Magn Reson Med. 1995;34:555–566. doi: 10.1002/mrm.1910340412. [DOI] [PubMed] [Google Scholar]
- 14.Lammertsma AA, Wise RJS, Heather JD, Gibbs JM, Leenders KL, Frackowiak SJ, Rhodes CG, Jones T. Correction for the presence of intravascular oxygen-15 in the steady-state technique for measuring regional oxygen extraction ratio in the brain: 2. Results in normal subjects and brain tumor and stroke patients. J Cereb Blood Flow Metab. 1983;3:425–431. doi: 10.1038/jcbfm.1983.68. [DOI] [PubMed] [Google Scholar]
- 15.Ishii K, Sasaki M, Kitagaki H, Sakamoto S, Yamaji S, Maeda K. Regional difference in cerebral blood flow and oxidative metabolism in human cortex. J Nucl Med. 1996;37(7):1086–1088. [PubMed] [Google Scholar]
- 16.Leblanc R. Physiologic studies of cerebral ischemia. Clin Neurosurg. 1991;37:289–311. [PubMed] [Google Scholar]
- 17.Braunwald E, Isselbacher KJ, Petersdorf RG, Wilson JD, Martin JB, Fauci AS. Harrison’s Principles of Internal Medicine. McGraw-Hill; New York: 1987. [Google Scholar]
- 18.Cremer JE, Seville MP. Regional brain blood flow, blood volume, and haematocrit values in the adult rat. J Cereb Blood Flow Metab. 1983;3:254–256. doi: 10.1038/jcbfm.1983.35. [DOI] [PubMed] [Google Scholar]
- 19.Everett NB, Simmons B, Lasher EP. Distribution of blood (Fe59) and plasma (I131) volumes of rats determined by liquid nitrogen freezing. Circul Res. 1956;4:419–424. doi: 10.1161/01.res.4.4.419. [DOI] [PubMed] [Google Scholar]
- 20.Levin VA, Ausman JL. Relationship of peripheral venous hematocrit to brain hematocrit. J Appl Physiol. 1969;26:433–437. doi: 10.1152/jappl.1969.26.4.433. [DOI] [PubMed] [Google Scholar]
- 21.Larsen OA, Lassen N. Cerebral hematocrit in normal man. J Appl Physiol. 1964;19:571–574. doi: 10.1152/jappl.1964.19.4.571. [DOI] [PubMed] [Google Scholar]
- 22.Oldendrof WH, Kitano M, Shimizu S, Oldendorf S. Hematocrit of the human cranial blood pool. Circul Res. 1965;17:532–539. doi: 10.1161/01.res.17.6.532. [DOI] [PubMed] [Google Scholar]
- 23.Eichling JO, Raichle ME, Grubb RL, Larson KB, Ter-Pogossian MM. In vivo determiniation of cerebral blood volume with radioactive oxygen-15 in the monkey. Circul Res. 1975;37:707–714. doi: 10.1161/01.res.37.6.707. [DOI] [PubMed] [Google Scholar]
- 24.Fiat D, Kang S. Determination of the rate of cerebral oxygen consumption and regional cerebral blood flow by non-invasive 17O in vivo NMR spectroscopy and magnetic resonance imaging: Part 1. Theory and data analysis methods. Neurol Res. 1992;14(4):303–311. doi: 10.1080/01616412.1992.11740074. [DOI] [PubMed] [Google Scholar]
- 25.Fiat D, Kang S. Determination of the rate of cerebral oxygen consumption and regional cerebral blood flow by nin-invasive 17O in vivo NMR spectroscopy and magnetic resonance imaging: Part 2. Determination of CMRO2 for the rat by 17O NMR, and CMRO2, rCBF and the partition coefficient for the cat by 17O MRI. Neurol Res. 1992;15(1):7–22. doi: 10.1080/01616412.1993.11740100. [DOI] [PubMed] [Google Scholar]
- 26.Hyder F, Kennan RP, Kida I, Mason G, Behar KL, Rothman D. Dependence of oxygen delivery on blood flow in rat brain: a 7 tesla nuclear magnetic resonance study. J Cereb Blood Flow Metab. 2000;20(3):485–498. doi: 10.1097/00004647-200003000-00007. [DOI] [PubMed] [Google Scholar]
- 27.Kida I, Kennan RP, Rothman D, Behar KL, Hyder F. High-resolution CMRO2 mapping in rat cortex: a multiparametic approach to calibration of BOLD image contrast at 7 tesla. J Cerebral Blood Flow Metab. 2000;20(5):847–860. doi: 10.1097/00004647-200005000-00012. [DOI] [PubMed] [Google Scholar]