

Abstract
Inflammatory bowel disease (IBD) patients display elevated levels of intraluminal nitric oxide (NO). NO can react with other molecules to form toxic compounds, which has led to the idea that NO may be an important mediator of IBD. However, the cellular source of NO and how its production is regulated in the intestine are unclear. In this study we aimed to determine if intestinal myofibroblasts produce NO in response to the IBD-associated cytokines IL-1β, TNFα, and IFNγ. Intestinal myofibroblasts were isolated from mice and found to express inducible nitric oxide synthase (iNOS) mRNA, but not endothelial NOS or neuronal NOS. Individual treatment of myofibroblasts with IL-1β, TNFα, or IFNγ had no effect on NO production, but stimulation with combinations of these cytokines synergistically increased iNOS mRNA and protein expression. Treatment with TNFα or IFNγ increased cell surface expression of IFNγRI or TNFRII, respectively, suggesting that these cytokines act in concert to prime NO production by myofibroblasts. Impairment of NF-κB activity with a small molecule inhibitor was sufficient to prevent increased expression of IFNγRI or TNFRII, and inhibition of Akt, JAK/STAT, or NF-κB blocked nearly all NO production induced by combinatorial cytokine treatment. These data indicate that intestinal myofibroblasts require stimulation by multiple cytokines to produce NO and that these cytokines act through a novel pathway involving reciprocal cytokine receptor regulation and signaling by Akt, JAK/STAT, and NF-κB.
Intestinal myofibroblasts (IMF) participate in a variety of biological processes, including wound healing, inflammation, and tumorigenesis (Powell et al., 1999; Pucilowska et al., 2000). These cells are situated in the lamina propria adjacent to intestinal epithelia and smooth muscle cells, and form a syncytium that extends throughout the gastrointestinal tract (Joyce et al., 1987). IMF cultured in vitro secrete large amounts of extracellular matrix and elevated numbers of IMF are found within and around intestinal strictures (McKaig et al., 2002, 2003), suggesting they participate in the development of intestinal fibrosis. They also produce a number of factors important for the development and resolution of inflammation that include IL-1, IL-6, IL-8, IL-10, IL-33, MCP-1, TNFα, and PGE2 (Pang et al., 1994; Shao et al., 2006; Kobori et al., 2010). IMF regulation of fibrosis and cytokine production, and their close proximity to several other intestinal cell types, indicates these cells play an essential role in inflammatory bowel disease (IBD).
Nitric oxide (NO) is a highly reactive gas that is reported to have both protective and inflammatory properties in the intestine. Nitric oxide synthases (NOSs) produce NO from L-arginine, NADPH and oxygen, and three isoforms have been identified (Knowles and Moncada, 1994). Endothelial NOS (eNOS) or neuronal NOS (nNOS) are constitutively expressed by some cell types, while inducible NOS (iNOS) is expressed after exposure to cytokines and microbial products. NO consumption by guanylate cyclase in the formation of cGMP has been suggested to mediate intestinal homeostasis (Kolios et al., 2004). Reduction of NO bioavailability with the NO-scavenging compound NG-nitro-L-arginine methyl ester (L-NAME) results in decreased levels of cGMP, and this reduction correlates with increased interepithelial junctions, decreased mucous production, and a leaky mucosal barrier (Brown et al., 1993; Alican and Kubes, 1996). Other studies suggest a pro-inflammatory role for NO in murine models of colitis. Inhibition of NO with L-NAME attenuates disease in the TNBS colitis model (Miller et al., 1993), and genetic deletion of eNOS, nNOS, or iNOS decreases disease susceptibility in the DSS and TNBS models (Zingarelli et al., 1999; Beck et al., 2004). While NO clearly modulates disease in experimental colitis models in mice, many of these results are conflicting and a precise role for NO in murine colitis has yet to emerge.
In humans a strong correlation exists between NOS activity and IBD. Elevated NO levels in the colons of IBD patients have been reported by several groups and citrulline, a bi-product of NOS reactions, is more abundant in rectal biopsy samples from patients with active ulcerative colitis (Boughton-Smith et al., 1993; Middleton et al., 1993; Lundberg et al., 1994). Moreover, expression of iNOS is substantially increased in intestinal samples of IBD patients compared to samples from healthy donors (Singer et al., 1996; Kolios et al., 1998). Staining of intestinal samples from IBD patients with iNOS-specific antibodies has shown that iNOS is expressed by epithelial cells, but punctate staining of non-epithelial cells is also observed (Kolios et al., 1998; Ljung et al., 2006). Monocytes in patients with active IBD and crypt-associated macrophages also express elevated levels of iNOS and NO (Dijkstra et al., 2002; Chin et al., 2008). Furthermore, cytokines associated with autoimmune diseases and also found in the intestines of IBD patients (e.g., IL-1β, TNFα, and IFNγ), are reported to stimulate iNOS expression in intestinal epithelial cells and macrophages (Kolios et al., 1995; Fonseca et al., 2003). While a strong link exists between iNOS expression in intestinal epithelial cells and cells of monocyte/macrophage lineage during intestinal inflammation, it is unclear if additional cell types, such as IMF, also contribute to NO production in the pathogenesis of IBD.
The aim of this study was to determine if IMF produce NO after exposure to IBD-associated cytokines, such as IL-1β, TNFα, and IFNγ. We found that IMF express iNOS, but not eNOS or nNOS, and that iNOS expression is dramatically increased after stimulation with combinations of IL-1β, TNFα, and IFNγ. NO production was undetectable in un-stimulated IMF or in IMF stimulated with single treatments of IL-1β, TNFα, or IFNγ. However, when IL-1β, TNFα, or IFNγ were administered as combinations, we observed a substantial production of NO that was similar to amounts made by activated macrophages. We also found that synergistic effects seen with combinatorial cytokine treatments results from regulation of reciprocal receptor expression and a signaling pathway involving Akt, JAK/STAT, and NF-κB.
Materials and Methods
Intestinal myofibroblast isolation and culture
Primary intestinal myofibroblasts (IMF) were isolated from the small intestines of 3–4 week old C57BL/6 mice as previously described with slight modification (Fruchtman et al., 2005; Theiss et al., 2005). IMF were isolated from 3- to 4-week-old mice because this is the age where we obtained the greatest number of viable cells per isolation. Mice were housed within an environmentally controlled specific pathogen-free animal facility at the University of California, San Francisco and all experiments were approved by the Institutional Animal Care and Use Committee of the University of California, San Francisco. Briefly, intestines were collected, flushed with HBSS (with Ca2+ and Mg2+, without phenol red, UCSF Cell Culture Facility, San Francisco, CA), minced into 1 mm segments, and digested with 4 U/ml Dispase (Worthington Biochemicals, Lakewood, NJ) and 300 U/ml collagenase I (Worthington Biochemicals) in HBSS on a rotary shaker (60–80 rpm) at room temperature for 25 min. Digested tissue was pipetted up and down, placed on ice for 3 min, and centrifuged at 800–1000 rpm for 10 min. The supernatant was aspirated and the tissue pellet was washed once with culture media before being plated into culture flasks. Cells were cultured in DMEM (UCSF Cell Culture Facility, San Francisco, CA) supplemented with 10% heat inactivated Certified Fetal Bovine Serum (Invitrogen, Grand Island, NY) and 1× penicillin/streptomycin (UCSF Cell Culture Facility) in a 37°C humidified 5% CO2 incubator and washed with fresh media twice a week. These culture conditions allow IMF to proliferate while other intestinal cell types perish during extended culture. By passage 3, isolated cells were highly enriched for IMFs as demonstrated by immunohistochemical staining for the IMF markers smooth muscle actin, desmin, and vimentin. Enriched IMF were routinely at least 84% positive for smooth muscle actin, 71% positive for desmin, and 99% positive for vimentin and used for experiments at passage 3–5. The Raw 264.7 murine macrophage cell line was obtained from ATCC (TIB-71) and cultured under identical conditions.
Cytokine stimulation and treatment with small molecule inhibitors
IMF were seeded in 10- or 15-cm dishes (Corning, Tewksbury, MA) and cultured to 80–90% confluence, or seeded in Black Clear Bottom, TC surface, 96-well plates (BD Falcon, San Jose, CA) at 8,000–10,000 cells per well. Passaged cells were placed in complete DMEM and allowed to recover for 20–24 h in a 37°C humidified 5% CO2 incubator before experiments. For cytokine and inhibitor treatments, culture medium was replaced with fresh medium that consisted of DMEM supplemented with 5% heat-inactivated Certified Fetal Bovine Serum, 0.5× penicillin/streptomycin, and one or more of the following: IL-1α, IL-1β, TNFα, IFNγ (all from R&D Systems, Minneapolis, MN), lipopolysaccharide (LPS; Sigma), IKK Inhibitor X, AG 490, and WHI-P154 (all from Calbiochem, San Diego, CA).
RNA Isolation and RT-PCR
RNA was isolated from cultured cells or mouse brain tissue using an RNeasy Mini Kit according to the manufacturer’s instructions (Qiagen, Valencia, CA). RT-PCR was conducted on a GeneAmp PCR System 9700 (Foster City, CA) with an OneStep RT-PCR Kit (Qiagen). Primers were designed with Primer3 software (developed by HHMI and NIH) using mRNA sequences obtained from GenBank. The primer sequences were as follows: mouse nNOS, forward, 5′-ACC AGC TCT TCC CTC TAG CC-3′, reverse, 5′-ATG GGT ACT TCC AGC ACC AG-3′; mouse iNOS, forward, 5′-CCT TGT TCA GCT ACG CCT TC-3′, reverse, 5′-GGC TGG ACT TTT CAC TCT GC-3′; mouse eNOS, forward, 5′-TCT TCG TTC AGC CAT CAC AG-3′, reverse, 5′-CAC AGG GAT GAG GTT GTC CT-3′, and GAPDH, forward, 5′-CGA CAA GGG AGC TAA AAC CA-3′, reverse, 5′-GCC TTG CAG AAA CTT TGG AG-3′. One step RT-PCR was performed with the following conditions: Reverse transcription for 30 min at 50°C; Initial PCR activation for 15 min at 95°C; 3-stepcycling for 45 sec at 94°C, 1 min at 59°C for eNOS and iNOS, at 55°C nNOS and GAPDH, and 1 min at 72°C for a total of 35 cycles; final extension for 10 min at 72°C. DNA from RT-PCR reactions was separated on a 1.5% agarose (Sigma, St. Louis, MO) gel containing ethidium bromide and images of gels exposed to UV light were acquired.
Western blot
To measure expression of iNOS and phosphorylation of signal transduction proteins, cells were plated in 10-cm dishes. The culture medium was replaced with fresh serum-free DMEM for measurement of signal transduction proteins or with DMEM supplemented with 5% heat-inactivated Certified Fetal Bovine Serum, 0.5× penicillin/streptomycin for measurement of iNOS protein expression. Cells were then treated with the indicated cytokine and inhibitor conditions. Cells were then placed in a lysis buffer containing 1× RIPA buffer with 1× protease inhibitor cocktail and 1× phosphatase inhibitors (Pierce, Rockford, IL), and snap-frozen on dry-ice. Cell lysates were melted on ice and re-frozen on dry-ice three times to ensure complete lysis. Lysates were centrifuged at 15,400g for 15 min at 4°C and the supernatant was collected. Samples (15 μg/lane) were separated by 4–20% Ready Gel Tris–HCl gel (Bio-Rad, Hercules, CA), transferred to an Immerse PVDF membrane (Bio-Rad), and blocked for 30 min in Tris-buffered saline plus 0.1% Tween 20 (TBST) containing 1.5% skim milk. Membranes were incubated for overnight at 4°C with antibodies to iNOS (BD Pharmingen, San Jose, CA), β-actin (Abcam, Cambridge, MA), p-NF-κB p65 (Ser536), NF-κB p65 (Cell Signaling, Danvers, MA), p-Akt (Ser473), Akt (Cell Signaling), p-STAT1 (Tyr701), and STAT1 (Santa Cruz Biotechnology, Santa Cruz, CA). After washing with TBST, membranes were incubated with a peroxidase-conjugated secondary antibody (anti-rabbit IgG, HRP-linked; Cell Signaling) overnight at 4°C, washed again, and developed with ECL Plus reagent (Pierce).
Flow cytometry
Cells were washed with PBS and then stained with PE-conjugated rat anti-mouse IL-1R (CD121a, BD Biosciences, San Jose, CA), hamster anti-mouse TNFRI (CD120a, BD Biosciences), PE-conjugated goat anti-hamster IgG (H + L, CalTag, Burlingame, CA), biotinylated hamster anti-mouse TNFRII (CD120b, BD Biosciences), or biotinylated hamster anti-mouse IFNγ RI (CD 119, BD Biosciences). Streptavidin-PE (eBioscience, San Diego, CA) was used to detect cells labeled with α-TNFRII and α-IFNγRI, and a PE conjugated hamster IgG antibody (BD Biosciences) was used as an isotype control. Flow cytometry data analysis was performed with Flowjo software (Treestar, Ashland, OR) and mean fluorescence intensity (MFI) of the staining was used to measure expression of the receptors. MFI values were corrected for non-specific labeling by subtracting the MFI of cells stained with secondary antibodies alone or with isotope control antibodies. The relative fold increase of MFI was calculated by dividing the MFI of myofibroblasts treated with cytokines or cytokine-inhibitor combinations by the MFI of myofibroblasts treated with medium alone.
Measurement of NOS activity
IMFs and Raw 246.7 cells were cultured as described above in black 96-well plates and nitric oxide synthase (NOS) activity was assayed with the Fluorimetric Cell-Associate Nitric Oxide Synthase Detection System (Sigma) according to the manufacturer’s instructions. Relative fluorescence units (RFU) was measured with a fluorimeter (Synergy HT, Bio-Tek Instruments, Winooski, VT) set to an excitation wavelength of 485 nm and an emission wavelength of 528 nm. Relative fold increase in RFU was used to represent changes in NOS activity between different conditions and was calculated by dividing the RFU of treated cells by the RFU of non-treated cells.
Statistical analysis
To determine the statistical significance of differences between groups, GraphPad Prism (GraphPad Software) was used to perform a 2-tailed Student’s t-test or one-way analysis of variance (ANOVA). Differences with a P-value of less than 0.05 were considered statistically significant.
Results
IMF produce NO by iNOS after combinatorial cytokine stimulation
To determine if primary mouse intestinal myofibroblasts (IMFs) express enzymes that synthesize NO, we analyzed these cells for expression of the three known NOS genes (Knowles and Moncada, 1994). RT-PCR with primary mouse IMFs revealed the presence of inducible NOS (iNOS) mRNA, but minimal to undetectable amounts of endothelial NOS (eNOS) or neuronal NOS (nNOS; Fig. 1A). We next determined if iNOS in these cells was regulated by pro-inflammatory cytokines implicated in IBD. Interestingly, individual treatment with IL-1β, TNFα, or IFNγ had little effect on iNOS expression in IMF, but combinations of IL-1β and IFNγ or TNFα and IFNγ considerably increased iNOS mRNA expression (Fig. 1A). We then used the above cytokines and IL-1α to examine whether iNOS protein expression was regulated in a similar fashion. Individual stimulation with IL-1α, IL-1β, TNFα, or IFNγ had little effect on iNOS protein levels, but combinations of IL-1α, IL-1β, and TNFα with IFNγ potently stimulated expression of iNOS (Fig. 1B). Our laboratory previously reported that C-type natriuretic peptide (CNP) induces IMF relaxation through cGMP-associated reductions in MLC phosphorylation (Chitapanarux et al., 2004). However, no change in iNOS expression in IMF was observed after CNP treatment (Fig. 1B). Together these data suggest that cytokines implicated in IBD synergize to trigger expression of iNOS in IMFs.
Fig. 1.

Treatment with combinations of cytokines stimulates the expression of iNOS and synthesis of NO by IMF. A: RT-PCR performed on RNA isolated from IMF treated alone or with combinations of 5 ng/ml of IL-1β, 10 ng/ml of TNFα or100 ng/ml of IFNγ for 16 h. Reactions were performed with primers specific for eNOS, nNOS, iNOS, and GAPDH and separated by gel electrophoresis. RNA isolated from murine brain and reactions with no RNA input (H2O) were included as controls. B: Western blots with antibodies specific to iNOS or β-actin using IMF treated alone or with combinations of 5 ng/ml IL-1α, 5 ng/ml IL-1β, 10 ng/ml TNFα, 100 ng/ml IFNγ, or 2 μM CNP for 24 h. C,D: Fluorescence measurements of IMF loaded with 4,5-diaminofluorescein after treatment with 0, 10, or 100 ng/ml IFNγ and increasing doses of TNFα (C) or with 0, 1, or 10 ng/ml TNFα and increasing doses of IFNγ (D) for 24 h. Data are presented as the fold increase of relative fluorescence units (RFU) above baseline RFU values.
To determine if combinatorial cytokine stimulation of iNOS expression results in enhanced NO production in IMF, we measured NO production with a fluorimetric cell-associated NOS assay. This assay measures the conversion of the non-fluorescent compound 4,5-diaminofluorescein to triazolofluorescein, a fluorescent compound generated in the presence of NO (Kojima et al., 1998). IMF loaded with 4,5-diaminofluorescein had minimal changes in fluorescence after treatment with TNFα or IFNγ, but combinations of TNFα and IFNγ dose-dependently stimulated a 6- to 10-fold increase in fluorescence (Fig. 1C,D). This result indicates that combinations of TNFα and IFNγ synergize to induce production of NO through expression of iNOS in primary IMFs.
IBD cytokines induce reciprocal receptor expression in IMF
We postulated that IMFs were sensitized by one cytokine to respond to another cytokine by increasing the number of the corresponding receptors at the cell surface. Surface expression of receptors for IL-1, TNF-α, and IFNγ was measured in response to treatment with IL-1α, IL-1β, TNFα, or IFNγ. Primary IMF expressed relatively low levels of IL-1R and TNFRI, but higher levels of TNFRII and IFNγRI (Fig. 2A). Treatment with TNFα, but not IL-1α or IL-1β, significantly increased expression of IFNγRI on the surface of IMF (Fig. 2B). Likewise, treatment with IFNγ, but not IL-1α or IL-1β, significantly increased TNFRII (Fig. 2C). This result suggests that regulation of iNOS and NO production by combinatorial cytokine treatment occurs from distinct signaling events triggered by each cytokine, which primes IMFs to respond to additional cytokines.
Fig. 2.

Stimulation with TNFα or IFNγ sensitizes IMF to produce NO by increasing expression of IFNγRI or TNFRII. A: Measurement of TNFRI, TNFRII, IL-1R, and IFNγRI expression by flow cytometry on the surface of IMF. Gray and black lines indicate staining controls with secondary antibody alone and isotype control antibodies, except for IL-1R where the secondary alone condition was omitted because a fluorophore-conjugated antibody was used. B: Measurement of IFNγRI expression by flow cytometry on the surface of IMF before (dashed red line) and after (solid red line) treatment for 24 h with 5 ng/ml IL-1α, 5 ng/ml IL-1β, or 10 ng/ml TNFα. Histogram plots show number of cells positively labeled on Y-axis and fluorescence intensity of staining on X-axis. IFNγRI antibody was omitted to control for non-specific labeling from samples before (dashed blue line) and after (solid blue line) treatment. ***P ≤ 0.001. Results are reported as mean ± S.D. C: Measurement of TNFRII expression by flow cytometry on the surface of IMF before (dashed red line) and after (solid red line) treatment for 24 h with 5 ng/ml IL-1α, 5 ng/ml IL-1β, or 100 ng/ml IFNγ.*P ≤ 0.05. D: Western blots with antibodies specific to iNOS or β-actin using IMF treated alone, in combination, or sequentially with 5 ng/ml IL-1β, 10 ng/ml TNFα, 100 ng/ml IFNγ. For sequential cytokine treatment, cells were stimulated for 20 h with one cytokine, washed with PBS, and the media replaced with a different cytokine for 24 h. E: Fluorescence measurements of IMF loaded with 4,5-diaminofluorescein after treatment alone, in combination, or sequentially with the indicated cytokines as in (D).
We investigated the signaling mechanism responsible for iNOS regulation by sequentially treating IMF with IL-1β, TNFα, or IFNγ and measuring iNOS expression and NO production. Individual treatment with IL-1β, TNFα, or IFNγ for 24 h had minimal effects on iNOS expression (Fig. 2D). However, sequential treatment with IL-1β, TNFα, or IFNγ for 20 h, followed by removal of the cytokine and subsequent treatment for 24 h with IL-1β, TNFα, or IFNγ resulted in a similar synergistic regulation of iNOS as seen with combinatorial treatment (Fig. 2D). We observed multiple bands on the iNOS Western blot and we believe these to be iNOS splice variants as previously reported (Bloch et al., 1995; Xu et al., 1995). We also compared the effects of sequential and combinatorial cytokine treatment on NO production by IMF. Treatment of IMF with IL-1β, TNFα, or IFNγ for 20 h, followed by removal of the cytokine and subsequent treatment for 24 h with IL-1β, TNFα, or IFNγ resulted in synergistic regulation of NO production (Fig. 2E). Taken together, these data suggest that TNFα and IFNγ prime IMF to synthesize iNOS and produce NO in a synergistic fashion by stimulating expression of IFNγRI and TNFRII.
NO production by IMF is mediated through Akt, JAK/STAT, and NF-κB signaling
To determine how iNOS expression is regulated in IMF after combinatorial treatment with TNFα, or IFNγ, respectively, we examined signaling cascades that are typically associated with these cytokines. Stimulation with TNFα for 15 min had no detectable effect on phosphorylation of Akt, NF-κB, and STAT1 (Fig. 3A). However, treatment with IFNγ for 15 min induced phosphorylation of Akt, NF-κB, and STAT1 (Fig. 3A). Combinatorial treatment with TNFα and IFNγ for 15 min further increased phosphorylation of NF-κB and STAT1, but had no effect on phosphorylation of Akt (Fig. 3A). Phosphorylation of NF-κB and STAT1 was maximally enhanced after pretreatment of IMF with TNFα for 20 h followed by 15 min of stimulation with IFNγ (Fig. 3A). We employed small molecule inhibitors to determine the signaling proteins downstream of TNFα or IFNγ stimulation. Addition of IFNγ for 15 min after 20 h of pretreatment with TNFα and AG490, a protein tyrosine kinase inhibitor with selectivity for members of the Janus-associated kinase (JAK) family, prevented phosphorylation of NF-κB and significantly reduced phosphorylation of Akt and STAT1 (Fig. 3A). IKK inhibitor X, an inhibitor of NF-κB phosphorylation, and WHI-P154, a specific JAK3 inhibitor, also reduced phosphorylation of NF-κB, Akt, and STAT1, but were less potent than AG490 under similar conditions. Pretreatment with IFNγ for 20 h and treatment with TNFα for 15 min also induced phosphorylation of NF-κB, Akt, and STAT1. However, this condition resulted in less phosphorylation of NF-κB, Akt, and STAT1 when compared to treatment with TNFα for 20 h and treatment with IFNγ for 15 min. The inclusion of AG490 during IFNγ pretreatment for 20 h impaired phosphorylation of NF-κB, Akt, and STAT1 after TNFα stimulation, but inclusion of IKK inhibitor X or WHI-P154 only blocked phosphorylation of STAT1 (Fig. 3A). Stimulation with IL-1β for 20 h and treatment with TNFα or IFNγ for 15 min both increased phosphorylation of Akt and NF-κB, but only IFNγ provoked phosphorylation of STAT1. These data suggest that Akt, JAK/STAT, and NF-κB drive the synthesis of iNOS and production of NO by IMF in response to TNFα and IFNγ.
Fig. 3.

Combinatorial cytokine stimulation of IMF induces iNOS expression and NO production through a signaling pathway that requires activation of Akt,STAT1, and NF-κB. A: Western blots with antibodies specific to phosphorylated Ser473 on Akt, total Akt, phosphorylated Ser536 on p65NF-κB, total NF-κB, phosphorylated Tyr701 on STAT1, and total STAT1 using IMF treated for 20 h with50 μMAG490, 15 μM IKK inhibitor X, or 50 μMWHI-P154 and stimulated for 15 min alone or in combination with 10 ng/ml TNFα and 100 ng/ml IFNγ. B: Western blots with antibodies specific to iNOS or β-actin using IMF treated with the indicated inhibitors and cytokines for 20 h. C,D: Fluorescence measurements of IMF loaded with 4,5-diaminofluorescein after treatment with the indicated inhibitors and cytokines for 20 h, followed by washing and stimulation with 5 ng/ml IL-1β (C and D), 100 ng/ml IFNγ (C) or 10 ng/ml TNFα (D) for 24 h.
Inhibitors of Akt, JAK/STAT, and NF-κB signaling were also used to examine the role of this pathway on iNOS expression and NO production by IMF in response to TNFα and IFNγ. AG490, IKK inhibitor X, and WHI-P154 all reduced iNOS expression, but with varying degrees of potency, in response to IL-1β and IFNγ or TNFα and IFNγ combinatorial treatment (Fig. 3B). While these inhibitors had varying effects on iNOS expression, they prevented nearly all NO produced upon TNFα and IFNγ sequential stimulation (Fig. 3C,D). These data indicate that Akt, JAK/STAT, and NF-κB potently control NO production by IMF in response to TNFα and IFNγ.
We determined if small molecule inhibitors of Akt, JAK/STAT, and NF-κB signaling in IMF were directly regulating expression of iNOS or were working through an indirect pathway by preventing induction of IFNγRI and TNFRII expression. IMF were stimulated with TNFα or IFNγ in the presence of IKK inhibitor X or AG490. As previously shown in an earlier experiment from this study (Fig. 2A), IFNγRI expression on IMF was increased upon treatment with TNFα, and TNFRII expression was increased upon treatment with IFNγ (Fig. 4A,B). IMF treated with TNFα or IFNγ and IKK inhibitor X, but not AG490, significantly blocked expression of IFNγRI and TNFRII, respectively (Fig. 4A,B). These data suggest that increased expression of IFNγRI and TNFRII upon stimulation with TNFα or IFNγ is regulated by NF-κB. Furthermore, these data indicate that distinct signaling pathways are engaged after single or combinatorial treatment with TNFα or IFNγ.
Fig. 4.
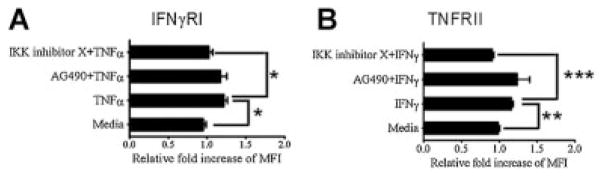
Increased expression of IFNγRI or TNFRII on IMF after sensitization with TNFα or IFNγ, respectively, is regulated by NF-κB. Flow cytometry measurements of IFNγRI (A) or TNFRII (B) expression on the surface of IMF before and after treatment for 24 h with 10 ng/ml TNFα (A) or 100 ng/ml IFNγ (B) and 50 μM AG490 or 15 μM IKK inhibitor X. Data are expressed as the relative fold increase of mean fluorescence intensity (MFI) in IMF after treatment of cells with TNFα or IFNγ. One-way ANOVA analysis was used to determine significant differences between the means of multiple groups, and a post compression test (Tukey’s multiple comparison test) was used to confirm where differences occurred between groups. *P ≤ 0.05; **P ≤ 0.01, and ***P ≤ 0.001. Columns are mean±SD.
To determine if a similar signaling pathway regulates NO production in other cell types, we examined Raw 264.7 cells, a well-characterized murine macrophage cell line that has been used extensively for studying the regulation of iNOS (Walker et al., 1997; Ricote et al., 1998). Untreated Raw 264.7 cells expressed high levels of phosphorylated NF-κB and phosphorylated STAT1 when compared to untreated IMF (Fig. 5A). Phosphorylation of NF-κB and STAT1 in Raw 264.7 cells was further increased by treatment with LPS or IFNγ, but TNFα had no effect (Fig. 5A). In contrast, IMF required treatment with a combination of IFNγ and IL-1β to generate comparable levels of phosphorylated STAT1, but NF-κB phosphorylation never reached similar levels as Raw 264.7 cells at any condition tested (Fig. 5A). Phosphorylated Akt was undetectable in Raw 264.7 cells, even after stimulation with TNFα, IFNγ, or LPS (Fig. 5B). Similar to IMF, stimulation of Raw 264.7 cells with IFNγ alone induced expression of iNOS that was further potentiated with combinatorial treatment with IFNγ and TNFα (Fig. 5C). AG490 inhibited stimulation of iNOS expression with IFNγ treatment alone, but had a negligible effect when IFNγ and TNFα were administered in combination. Also, in contrast to iNOS regulation in IMF, IKK inhibitor X had no effect on stimulation of iNOS expression by IFNγ and TNFα (Fig. 5C). Finally, we performed a side-by-side comparison of NO production in IMF and Raw 264.7 cells after treatment with cytokines and JAK/STAT or NF-κB inhibitors. Counter to iNOS regulation in IMF, individual treatment with IFNγ was sufficient to induce production of NO in Raw 264.7 cells (Fig. 5E). This induction of NO synthesis was partially inhibited with AG490, but not nearly as dramatic as the near-complete inhibition with AG490 seen in IMFs after IFNγ and IL-1β or TNFα combinatorial treatment (Fig. 5E). Also in contrast to NO regulation in IMF, IKK inhibitor X did not block NO production by Raw 264.7 cells in response to IFNγ or LPS (Fig. 5E). These data indicate that regulation of iNOS and NO production in Raw 264.7 cells is primarily mediated by signaling pathways distinct from those in IMF.
Fig. 5.

NO production mediated by increased iNOS expression in IMF is regulated through a pathway distinct from macrophages. A: Western blots with antibodies specific to phosphorylated Ser536 on p65 NF-κB, total NF-κB, phosphorylated Tyr701 on STAT1, and total STAT1 using IMF and Raw 264.7 murine macrophages stimulated for 15 min with 100 ng/ml LPS, 5 ng/ml IL-1β, 100 ng/ml IFNγ, or 10 ng/ml TNFα. B: Western blots with antibodies specific to phosphorylated Ser473 on Akt or total Akt using IMF and Raw 264.7 cells stimulated for 20 h with 100 ng/ml LPS or the indicated cytokines as above. C: Western blots with antibodies specific to iNOS or β-actin using IMF and Raw 264.7 cells treated with the indicated inhibitors and cytokines for 20 h. Fluorescence measurements of IMF (D) and Raw 264.7 cells (E) loaded with 4,5-diaminofluorescein after treatment with the indicated inhibitors and cytokines for 24 h.
Discussion
Excessive intestinal NO production is thought to contribute to the pathogenesis of IBD, but the cellular sources of NO and regulation of NO synthesis in the intestine is unclear. In this study we show that production of NO is undetectable in primary IMF cultured under basal conditions and dramatically increased upon combinatorial cytokine stimulation. Individual treatment with IFNγ, TNFα, or IL-1β resulted in modest effects on iNOS expression and undetectable changes in NO production, whereas combinations of IFNγ and TNFα or IL-1β at the same doses triggered a large increase in iNOS expression and production of NO. These findings suggest IMF may promote intestinal inflammation through production of NO when other inflammation-associated cytokines are present.
Based on the data reported here, we propose a model for regulation of iNOS expression and NO production by IMF (Fig. 6). We found that IMF responded to stimulation with IFNγ or TNFα by increasing the expression of TNFRII or IFNγRI, respectively, through a signaling pathway mediated by NF-κB (Fig. 6A). Thus, our data suggests a mechanism of iNOS regulation in IMF where stimulation with one cytokine induces the expression of a receptor for a second cytokine, thereby sensitizing the cell to respond when the second cytokine is detected. We have also identified a signaling pathway in IMF that triggers iNOS expression after cell sensitization. While TNFα-sensitized IMF responded to IFNγ by expressing iNOS through pathways involving both JAK-mediated phosphorylation of STAT1 at Tyrosine701 and Akt phosphorylation at Serine473, NF-κB p65 phosphorylation at Serine536, IFNγ-sensitized IMF responded to TNFα by expressing iNOS through Akt phosphorylation at Serine473 and NF-κB p65 phosphorylation at Serine536 (Fig. 6B). Treatment with small molecule inhibitors of JAK family members or NF-κB reduced iNOS expression and completely blocked NO production after stimulation with IFNγ or TNFα, which suggests that this pathway is required for NO production by IMF. These findings are in line with a previous report showing that iNOS expression in STAT1-deficient mouse embryonic fibroblasts is not induced upon treatment with IFNγ in combination with LPS, TNF-α or IL-1 (Samardzic et al., 2001).
Fig. 6.
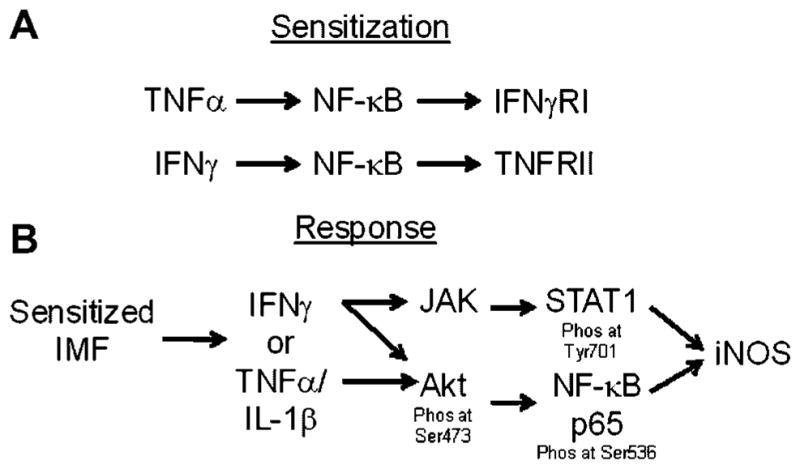
Model of combinatorial cytokine regulation of iNOS expression in IMF. Stimulation of IMF with TNFα increases expression of IFNγRI and thereby sensitizes the cell to respond to IFNγ (A). Subsequent exposure to IFNγ triggers activation of JAK/STAT and Akt/NF-κB pathways that lead to increased expression of iNOS (B). Alternatively, stimulation of IMF with IFNγ increases the expression of TNFRII and thereby sensitizes the cell to respond to TNFα (A). Subsequent exposure to TNFα alone or in combination with IL-1α/β triggers activation of an Akt/NF-κB pathway that leads to increased expression of iNOS (B).
Additional lines of evidence from this study support our model of sensitization and response to inflammatory cytokines in the regulation of NO production by IMF. We observed that stimulation with IFNγ, TNFα, or IL-1β for 20 h, followed by removal of the cytokine and stimulation with a different cytokine (i.e., IFNγ or TNFα) for 24 h resulted in nearly the same increase in iNOS expression and NO production as simultaneous administration of cytokines. Secondary stimulation with IL-1β elicited a similar, but less potent, stimulation of iNOS expression and NO synthesis. While pretreatment with IL-1β did not significantly enhance expression of TNFRII or IFNγRI, it did sensitize IMF to response to IFNγ. This result suggests that IL-1β sensitizes IMF to respond to IFNγ through modulation of IFNγ intracellular signaling pathways. Together these findings suggest that primary exposure of IMF to IFNγ, TNFα, or IL-1β induces transcriptional changes independently of the other cytokines.
We also saw that AG490 was able to inhibit iNOS expression and block NO production without affecting expression of TNFRII or IFNγRI, suggesting that the sensitization and responses phases are regulated through distinct signaling pathways. However, NF-κB inhibition prevented both increased expression of TNFRII or IFNγRI and blocked iNOS expression and NO production. Since NF-κB is activated by a variety of stimuli in addition to cytokines, including oxidized LDL, free radicals, UV radiation and microbial antigens, it is not entirely surprising that different signaling pathways would converge on this transcription factor (Piette et al., 1997; Ballard, 2001). We speculate that NF-κB may partner with different co-activators for the sensitization and response phases of NO synthesis in IMF, but this question remains for future work.
This study identifies IMF as producers of NO and sheds light on a signaling pathway that results in iNOS expression. Intestinal barrier function is known to be regulated by IFNγ-mediated stimulation of TNFRII expression in epithelial cells (Wang et al., 2006). However, to the best of our knowledge, the present study is the first to describe a requirement for combinations of cytokines in the expression of iNOS and NO production in a cell type of the myofibroblast lineage. Since multiple intestinal cell types express NOS isoforms, either constitutively or in response to inflammatory stimuli, we believe that future work should focus on delineating the relative contribution of NO production by intestinal cells in homeostatic and disease states. Further characterization of the pathways controlling NO production by IMF and other intestinal cell types may reveal new targets for the treatment of IBDs.
Acknowledgments
H.F. Yee Jr. was supported by National Institute of Diabetes and Digestive and Kidney Diseases (NIDDK) R01 DK61532 and the William and Mary Ann Rice Memorial Distinguished Professorship. This work was also supported by the Hefni Technical Training Foundation and the Cell and Tissue Biology Core Facility of the University of California San Francisco Liver Center (NIDDK P30 DK026743). We are grateful to Dr. Andrew Melton for outstanding editorial assistance.
Footnotes
Author contributions: J.W. designed the study, generated experimental data, performed analyses and wrote the manuscript. T.C., Y.C., and R.K.S contributed to the study concept and design. H.F.Y. oversaw the design and interpretation of all studies described and oversaw writing of the manuscript.
Conflict of interest: The authors declare that no conflict of interest exists.
Literature Cited
- Alican I, Kubes P. A critical role for nitric oxide in intestinal barrier function and dysfunction. Am J Physiol. 1996;270:G225–G237. doi: 10.1152/ajpgi.1996.270.2.G225. [DOI] [PubMed] [Google Scholar]
- Ballard DW. Molecular mechanisms in lymphocyte activation and growth. Immunol Res. 2001;23:157–166. doi: 10.1385/IR:23:2-3:157. [DOI] [PubMed] [Google Scholar]
- Beck PL, Xavier R, Wong J, Ezedi I, Mashimo H, Mizoguchi A, Mizoguchi E, Bhan AK, Podolsky DK. Paradoxical roles of different nitric oxide synthase isoforms in colonic injury. Am J Physiol Gastrointest Liver Physiol. 2004;286:G137–G147. doi: 10.1152/ajpgi.00309.2003. [DOI] [PubMed] [Google Scholar]
- Bloch KD, Wolfram JR, Brown DM, Roberts JD, Jr, Zapol DG, Lepore JJ, Filippov G, Thomas JE, Jacob HJ, Bloch DB. Three members of the nitric oxide synthase II gene family (NOS2A, NOS2B, and NOS2C) colocalize to human chromosome 17. Genomics. 1995;27:526–530. doi: 10.1006/geno.1995.1086. [DOI] [PubMed] [Google Scholar]
- Boughton-Smith NK, Evans SM, Hawkey CJ, Cole AT, Balsitis M, Whittle BJ, Moncada S. Nitric oxide synthase activity in ulcerative colitis and Crohn’s disease. Lancet. 1993;342:338–340. doi: 10.1016/0140-6736(93)91476-3. [DOI] [PubMed] [Google Scholar]
- Brown JF, Keates AC, Hanson PJ, Whittle BJ. Nitric oxide generators and cGMP stimulate mucus secretion by rat gastric mucosal cells. Am J Physiol. 1993;265:G418–G422. doi: 10.1152/ajpgi.1993.265.3.G418. [DOI] [PubMed] [Google Scholar]
- Chin MP, Schauer DB, Deen WM. Prediction of nitric oxide concentrations in colonic crypts during inflammation. Nitric Oxide. 2008;19:266–275. doi: 10.1016/j.niox.2008.04.025. [DOI] [PubMed] [Google Scholar]
- Chitapanarux T, Chen SL, Lee H, Melton AC, Yee HF., Jr C-type natriuretic peptide induces human colonic myofibroblast relaxation. Am J Physiol Gastrointest Liver Physiol. 2004;286:G31–G36. doi: 10.1152/ajpgi.00325.2003. [DOI] [PubMed] [Google Scholar]
- Dijkstra G, Zandvoort AJ, Kobold AC, de Jager-Krikken A, Heeringa P, van Goor H, van Dullemen HM, Tervaert JW, van de Loosdrecht A, Moshage H, Jansen PL. Increased expression of inducible nitric oxide synthase in circulating monocytes from patients with active inflammatory bowel disease. Scand J Gastroenterol. 2002;37:546–554. doi: 10.1080/00365520252903099. [DOI] [PubMed] [Google Scholar]
- Fonseca SG, Romao PR, Figueiredo F, Morais RH, Lima HC, Ferreira SH, Cunha FQ. TNF-alpha mediates the induction of nitric oxide synthase in macrophages but not in neutrophils in experimental cutaneous leishmaniasis. Eur J Immunol. 2003;33:2297–2306. doi: 10.1002/eji.200320335. [DOI] [PubMed] [Google Scholar]
- Fruchtman S, Simmons JG, Michaylira CZ, Miller ME, Greenhalgh CJ, Ney DM, Lund PK. Suppressor of cytokine signaling-2 modulates the fibrogenic actions of GH and IGF-I in intestinal mesenchymal cells. Am J Physiol Gastrointest Liver Physiol. 2005;289:G342–G350. doi: 10.1152/ajpgi.00413.2004. [DOI] [PubMed] [Google Scholar]
- Joyce NC, Haire MF, Palade GE. Morphologic and biochemical evidence for a contractile cell network within the rat intestinal mucosa. Gastroenterology. 1987;92:68–81. doi: 10.1016/0016-5085(87)90841-9. [DOI] [PubMed] [Google Scholar]
- Knowles RG, Moncada S. Nitric oxide synthases in mammals. Biochem J. 1994;298:249–258. doi: 10.1042/bj2980249. [DOI] [PMC free article] [PubMed] [Google Scholar]
- Kobori A, Yagi Y, Imaeda H, Ban H, Bamba S, Tsujikawa T, Saito Y, Fujiyama Y, Andoh A. Interleukin-33 expression is specifically enhanced in inflamed mucosa of ulcerative colitis. J Gastroenterol. 2010;45:999–1007. doi: 10.1007/s00535-010-0245-1. [DOI] [PubMed] [Google Scholar]
- Kojima H, Sakurai K, Kikuchi K, Kawahara S, Kirino Y, Nagoshi H, Hirata Y, Nagano T. Development of a fluorescent indicator for nitric oxide based on the fluorescein chromophore. Chem Pharm Bull (Tokyo) 1998;46:373–375. doi: 10.1248/cpb.46.373. [DOI] [PubMed] [Google Scholar]
- Kolios G, Brown Z, Robson RL, Robertson DA, Westwick J. Inducible nitric oxide synthase activity and expression in a human colonic epithelial cell line, HT-29. Br J Pharmacol. 1995;116:2866–2872. doi: 10.1111/j.1476-5381.1995.tb15938.x. [DOI] [PMC free article] [PubMed] [Google Scholar]
- Kolios G, Rooney N, Murphy CT, Robertson DA, Westwick J. Expression of inducible nitric oxide synthase activity in human colon epithelial cells: Modulation by T lymphocyte derived cytokines. Gut. 1998;43:56–63. doi: 10.1136/gut.43.1.56. [DOI] [PMC free article] [PubMed] [Google Scholar]
- Kolios G, Valatas V, Ward SG. Nitric oxide in inflammatory bowel disease: A universal messenger in an unsolved puzzle. Immunology. 2004;113:427–437. doi: 10.1111/j.1365-2567.2004.01984.x. [DOI] [PMC free article] [PubMed] [Google Scholar]
- Ljung T, Lundberg S, Varsanyi M, Johansson C, Schmidt PT, Herulf M, Lundberg JO, Hellstrom PM. Rectal nitric oxide as biomarker in the treatment of inflammatory bowel disease: Responders versus nonresponders. World J Gastroenterol. 2006;12:3386–3392. doi: 10.3748/wjg.v12.i21.3386. [DOI] [PMC free article] [PubMed] [Google Scholar]
- Lundberg JO, Hellstrom PM, Lundberg JM, Alving K. Greatly increased luminal nitric oxide in ulcerative colitis. Lancet. 1994;344:1673–1674. doi: 10.1016/s0140-6736(94)90460-x. [DOI] [PubMed] [Google Scholar]
- McKaig BC, Hughes K, Tighe PJ, Mahida YR. Differential expression of TGF-beta isoforms by normal and inflammatory bowel disease intestinal myofibroblasts. Am J Physiol Cell Physiol. 2002;282:C172–C182. doi: 10.1152/ajpcell.00048.2001. [DOI] [PubMed] [Google Scholar]
- McKaig BC, McWilliams D, Watson SA, Mahida YR. Expression and regulation of tissue inhibitor of metalloproteinase-1 and matrix metalloproteinases by intestinal myofibroblasts in inflammatory bowel disease. Am J Pathol. 2003;162:1355–1360. doi: 10.1016/S0002-9440(10)63931-4. [DOI] [PMC free article] [PubMed] [Google Scholar]
- Middleton SJ, Shorthouse M, Hunter JO. Increased nitric oxide synthesis in ulcerative colitis. Lancet. 1993;341:465–466. doi: 10.1016/0140-6736(93)90211-x. [DOI] [PubMed] [Google Scholar]
- Miller MJ, Sadowska-Krowicka H, Chotinaruemol S, Kakkis JL, Clark DA. Amelioration of chronic ileitis by nitric oxide synthase inhibition. J Pharmacol Exp Ther. 1993;264:11–16. [PubMed] [Google Scholar]
- Pang G, Couch L, Batey R, Clancy R, Cripps A. GM-CSF, IL-1 alpha, IL-1 beta, IL-6, IL-8, IL-10, ICAM-1 and VCAM-1 gene expression and cytokine production in human duodenal fibroblasts stimulated with lipopolysaccharide, IL-1 alpha and TNF-alpha. Clin Exp Immunol. 1994;96:437–443. doi: 10.1111/j.1365-2249.1994.tb06048.x. [DOI] [PMC free article] [PubMed] [Google Scholar]
- Piette J, Piret B, Bonizzi G, Schoonbroodt S, Merville MP, Legrand-Poels S, Bours V. Multiple redox regulation in NF-kappaB transcription factor activation. Biol Chem. 1997;378:1237–1245. [PubMed] [Google Scholar]
- Powell DW, Mifflin RC, Valentich JD, Crowe SE, Saada JI, West AB. Myofibroblasts. II. Intestinal subepithelial myofibroblasts. Am J Physiol. 1999;277:C183–C201. doi: 10.1152/ajpcell.1999.277.2.C183. [DOI] [PubMed] [Google Scholar]
- Pucilowska JB, Williams KL, Lund PK. Fibrogenesis. IV. Fibrosis and inflammatory bowel disease: Cellular mediators and animal models. Am J Physiol Gastrointest Liver Physiol. 2000;279:G653–G659. doi: 10.1152/ajpgi.2000.279.4.G653. [DOI] [PubMed] [Google Scholar]
- Ricote M, Li AC, Willson TM, Kelly CJ, Glass CK. The peroxisome proliferator-activated receptor-gamma is a negative regulator of macrophage activation. Nature. 1998;391:79–82. doi: 10.1038/34178. [DOI] [PubMed] [Google Scholar]
- Samardzic T, Jankovic V, Stosic-Grujicic S, Trajkovic V. STAT1 is required for iNOS activation, but not IL-6 production in murine fibroblasts. Cytokine. 2001;13:179–182. doi: 10.1006/cyto.2000.0785. [DOI] [PubMed] [Google Scholar]
- Shao J, Sheng GG, Mifflin RC, Powell DW, Sheng H. Roles of myofibroblasts in prostaglandin E2-stimulated intestinal epithelial proliferation and angiogenesis. Cancer Res. 2006;66:846–855. doi: 10.1158/0008-5472.CAN-05-2606. [DOI] [PubMed] [Google Scholar]
- Singer II, Kawka DW, Scott S, Weidner JR, Mumford RA, Riehl TE, Stenson WF. Expression of inducible nitric oxide synthase and nitrotyrosine in colonic epithelium in inflammatory bowel disease. Gastroenterology. 1996;111:871–885. doi: 10.1016/s0016-5085(96)70055-0. [DOI] [PubMed] [Google Scholar]
- Theiss AL, Simmons JG, Jobin C, Lund PK. Tumor necrosis factor (TNF) alpha increases collagen accumulation and proliferation in intestinal myofibroblasts via TNF receptor 2. J Biol Chem. 2005;280:36099–36109. doi: 10.1074/jbc.M505291200. [DOI] [PubMed] [Google Scholar]
- Walker G, Pfeilschifter J, Kunz D. Mechanisms of suppression of inducible nitric-oxide synthase (iNOS) expression in interferon (IFN)-gamma-stimulated RAW 264.7 cells by dexamethasone. Evidence for glucocorticoid-induced degradation of iNOS protein by calpain as a key step in post-transcriptional regulation. J Biol Chem. 1997;272:16679–16687. doi: 10.1074/jbc.272.26.16679. [DOI] [PubMed] [Google Scholar]
- Wang F, Schwarz BT, Graham WV, Wang Y, Su L, Clayburgh DR, Abraham C, Turner JR. IFN-gamma-induced TNFR2 expression is required for TNF-dependent intestinal epithelial barrier dysfunction. Gastroenterology. 2006;131:1153–1163. doi: 10.1053/j.gastro.2006.08.022. [DOI] [PMC free article] [PubMed] [Google Scholar]
- Xu W, Charles IG, Liu L, Koni PA, Moncada S, Emson P. Molecular genetic analysis of the duplication of human inducible nitric oxide synthase (NOS2) sequences. Biochem Biophys Res Commun. 1995;212:466–472. doi: 10.1006/bbrc.1995.1993. [DOI] [PubMed] [Google Scholar]
- Zingarelli B, Szabo C, Salzman AL. Reduced oxidative and nitrosative damage in murine experimental colitis in the absence of inducible nitric oxide synthase. Gut. 1999;45:199–209. doi: 10.1136/gut.45.2.199. [DOI] [PMC free article] [PubMed] [Google Scholar]