

Abstract
Assessing family- and species-level variation in physiological responses to global change across geologic time is critical for understanding factors that underlie changes in species distributions and community composition. Here, we used stable carbon isotopes, leaf nitrogen content and stomatal measurements to assess changes in leaf-level physiology in a mixed conifer community that underwent significant changes in composition since the last glacial maximum (LGM) (21 kyr BP). Our results indicate that most plant taxa decreased stomatal conductance and/or maximum photosynthetic capacity in response to changing conditions since the LGM. However, plant families and species differed in the timing and magnitude of these physiological responses, and responses were more similar within families than within co-occurring species assemblages. This suggests that adaptation at the level of leaf physiology may not be the main determinant of shifts in community composition, and that plant evolutionary history may drive physiological adaptation to global change over recent geologic time.
Keywords: Atmospheric [CO2], climate change, last glacial maximum, leaf nitrogen content, maximum photosynthetic capacity, packrat middens, stomatal conductance, stomatal index
INTRODUCTION
Changes in atmospheric CO2 concentration (ca), climate and nutrient availability have likely impacted plant physiology since the last glacial maximum (LGM, ~21 kyr BP). However, even within C3 plant assemblages, taxonomic groups may have varied in their responses to these changes. Such variation may have played a critical role in driving temporal shifts in plant species distributions and community composition. Evaluating the relationship between plant community dynamics and physiological responses to global change since the LGM requires analysis of co-occurring plant taxa at a single site through time. Ancient plant specimens preserved within packrat middens are invaluable in this context since they allow for comparisons between co-occurring plant lineages that exhibit different ecological, physiological and life-history traits. Here, we used modern plants and ancient plants preserved within packrat middens from the Snake Range, NV (Fig. 1) to investigate the physiological responses of a mixed montane conifer community that underwent known shifts in composition since the LGM (Wells 1983). In doing so, we provide new insights into fundamental mechanisms that underlie species-, family-and community-level responses to long-term global change.
Figure 1.

Modern (white circles) and midden (black circles) specimens were collected from the Snake Range, NV. Inset shows the location of the Snake Range within the Great Basin Desert (shaded area). Most herbaria specimens were collected from the Snake Range or other locations within the Great Basin Desert (Table S2).
During the LGM, ca was among the lowest levels that occurred during the evolution of vascular plants, reaching minimal values of 180 p.p.m. (IPCC 2007). Prior to the Industrial Revolution, ca rose to 270 p.p.m. and has continued to rise to 400 p.p.m. in modern times due to fossil fuel emissions (IPCC 2007); this is a level that has not occurred in the atmosphere for possibly 15 million years (Tripati et al. 2009). Studies with modern plants grown under glacial and modern conditions indicate that glacial ca negatively impacts leaf-level physiology leading to reductions in growth, survival and reproductive output (reviewed in Gerhart & Ward 2010). Studies of actual glacial plants further support these conclusions, indicating that ca likely affected leaf-level physiology since the LGM (Van de Water et al. 1994; Beerling 2005; Ward et al. 2005; Gerhart et al. 2012).
Two physiological mechanisms may have alleviated the negative effects of low ca on leaf-level physiology and growth during the LGM. The first strategy involves stomatal regulation of CO2 diffusion into leaves. More specifically, when CO2 availability is limiting, increased stomatal conductance (gs) via reduced stomatal sensitivity to vapour pressure deficit (Maherali et al. 2003), increased pore size and/or increased stomatal index (SI) or density (Franks & Beeling 2009) may have enhanced CO2 diffusion into leaves (Fig. 2). In support of this idea, elevated gs has been observed for a wide variety of modern plants grown under low ca (reviewed in Gerhart & Ward 2010). Isotopic and morphological evidence from some ancient plants also indicates that gs was likely higher under low ca (Beerling 2005; Franks & Beeling 2009; Gagen et al. 2011; Gerhart et al. 2012).
Figure 2.

Two components of leaf function, stomatal conductance (gs) and maximum photosynthetic capacity (Amax), influence the concentration of CO2 inside the leaf (ci) and plant responses to global change. First, gs controls the influx of CO2 into the leaf intercellular space, but also the efflux of H2O from the leaf mesophyll. As stomata open, gs and ci increase, but the water use efficiency of photosynthesis decreases for a given Amax. We hypothesised that plants decreased gs in part by reducing stomatal index and/or pore size in response to rising ca and decreasing water availability since the LGM. Second, Amax is directly proportional to leaf N content (DeLucia & Schlesinger 1991), and we hypothesised that decreasing N availability since the LGM reduced leaf N content, resulting in lower Amax. Solid lines show the flux of CO2 and H2O. Dashed lines show indirect effects of global change on leaf traits.
The second physiological strategy for enhancing carbon (C) gain at low ca involves maximising leaf photosynthetic capacity. Higher maximum photosynthetic capacity (Amax, Fig. 2) may have increased net photosynthetic rates and growth under limiting CO2 availability (Sage & Coleman 2001; Smith et al. 2012). There is empirical evidence for photosynthetic acclimation to low ca via increased Amax in modern plants (Crous et al. 2010; Smith et al. 2012; Ripley et al. 2013), and previous work with ancient Juniperus suggests that Amax may have been elevated during the LGM (Gerhart et al. 2012). Despite evidence for both increased gs and Amax under low ca in some ancient plants as well as modern plants grown under glacial conditions, these types of responses have not been assessed in a mixed, intact plant community as far back as the LGM.
The net benefit of high gs and Amax for leaf-level physiology and growth would have been affected by the relative strength of water and nutrient limitations as well as ca. In particular, maintaining high gs under low ca during the LGM could have increased the risk of xylem embolism due to greater water loss through stomata (Quirk et al. 2013). Consequently, variation in water limitation as well as drought tolerance likely impacted the ability of plants to respond to low ca via changes in gs. In the Snake Range, palaeoclimate models indicate that conditions were wetter during the LGM compared to today (Braconnot et al. 2007). Higher water availability may have provided the ideal conditions under which glacial plants could have increased gs to overcome C limitations imposed by low ca. This strategy may have allowed certain plant species to survive and even expand their range under glacial conditions. In contrast, decreases in water availability from glacial to modern times may have constrained gs and contributed to shifts in community composition by favouring more drought-tolerant species.
Increased Amax under low ca could have enhanced C gain without negatively impacting drought tolerance. However, increased Amax would have required greater investment in the production of Rubisco (Ribulose-1,5-bisphosphate carboxylase oxygenase). Given that Rubisco accounts for as much as 30% of total leaf nitrogen (N), increasing Rubisco content would have greatly increased plant demand for N (Sage & Coleman 2001; Ripley et al. 2013). Thus, the strength of N limitation and the ability of plants to compete for N likely impacted the degree to which plants could increase Amax under low ca. Recent evidence from stable N isotopes indicates that global N availability decreased from ~15 to 7 kyr BP, after which N availability remained relatively constant (McLauchlan et al. 2013). Assuming that this trend continued back to the LGM, higher N availability in the past may have provided the ideal conditions under which glacial plants could have increased Amax to compensate for low ca. In contrast, decreased N availability over more recent geologic history may have strengthened the trade-off between C gain and N demand, and potentially contributed to shifts in plant community composition by favouring species that were more competitive or efficient in their use of N.
Absolute values for gs and Amax cannot be measured directly in ancient samples. In this study, we present a conceptual model for inferring the likelihood of changes in gs and Amax since the LGM using leaf stable carbon isotope ratios (δ13C), which reflect processes that influence CO2 supply and demand (Ehleringer & Cerling 1995), coupled with measures of stomatal characteristics and leaf %N. By measuring these leaf traits in a mixed, intact plant community spanning glacial through modern times we assessed (1) the potential for higher gs and Amax in ancient plants that grew under low as ca increased for many generations, (2) variation among plant families and species in the magnitude and timing of leaf-level responses to global change, and (3) potential links between leaf-level physiology, species distributions and community composition. We hypothesised that gs and Amax decreased in response to rising ca combined with decreasing water and N availability since the LGM (Fig. 2). However, because plant species differ in drought tolerance and/or their ability to compete for nutrients (Saurer et al. 2004; Waterhouse et al. 2004; Shuxia et al. 2006; Liu et al. 2007; Crous et al. 2010), we also hypothesised that taxa would differ in their ability to alter gs and Amax as ca increased, and that these physiological differences would correspond with temporal shifts in species distributions and community composition.
The results of our study provide strong evidence that some ancient plants increased gs and Amax under low ca, and that plant families and species differed in the relative magnitude and timing of leaf-level responses to changing conditions since the LGM. Our results also suggest that leaf-level physiology contributed to the dominance of Pinus longaeva during the LGM. More broadly, however, it appears that changes in leaf-level physiology per se did not drive shifts in overall community composition from glacial to modern times. Instead, similar responses within plant families (i.e. within evolutionary lineages in the Snake Range) indicate that evolutionary history is an important determinant of physiological adaptation to global change.
METHODS
Site description and sample collection
The Snake Range, NV is located in the central Great Basin, U.S. (Fig. 1). Mean annual temperature in this region has risen from ~2.5°C during the LGM (Braconnot et al. 2007) to 8.6°C in modern times (NOAA 2011). Simultaneously, mean annual precipitation has decreased from ~511 mm year−1 during the LGM (Braconnot et al. 2007) to 353 mm year−1 during modern times (NOAA 2011). Over this time period, ca has risen from ~180 p.p.m. during the LGM to ~400 p.p.m. today (IPCC 2007).
We sampled leaves from seven conifer species representing the dominant woodland community at mid-to-high elevations in the Snake Range, including five Pinaceae species: Abies concolor (ABCO), Pinus flexilis (PIFL), Pinus longaeva (PILO), Pinus monophylla (PIMO) and Pinus ponderosa (PIPO); and two Cupressaceae species: Juniperus communis (JUCO) and Juniperus osteosperma (JUOS). In addition, we sampled leaves from representatives of three other plant families, Asteraceae (ASTER, primarily Artemesia and Chyrsothamnus spp.), Ephedraceae (EPHED, Ephedra sp.) and Poaceae (POA, likely Oryzopsis, Pseudoroegneria and Stipa spp.). Previous surveys of plant specimens preserved in Snake Range middens indicate that vast stands of PILO dominated much of this region during the LGM, while PIFL and JUCO became more abundant during the glacial–interglacial transition (Wells 1983). Other species, including ABCO, PIMO, PIPO and JUOS were not well represented in the Snake Range until the Holocene (Wells 1983).
We examined leaf samples from five time periods: (1) the LGM (radiocarbon age 21–31 kyr BP), (2) the glacial– interglacial transition (11–12 kyr BP), (3) the mid-Holocene (4.3–4.7 kyr BP), (4) the historic contemporary period (13– 76 year BP) and (5) the modern period (present day). Glacial, Transition and Holocene samples were extracted from packrat middens in the Philip Wells Memorial Packrat Midden Collection (curated by Ward). All midden samples used in this study were previously extracted from a thin layer of the midden as described in Wells (1983). Samples were then cleaned to remove any remaining amberat (crystallised packrat urine), dust, or pollen (see Supporting Information). Visual inspection of a subset of leaves under high magnification showed that our cleaning protocol successfully removed contaminants from the leaf surface. Additional tests further showed that prior exposure to packrat urine did not alter leaf δ13C or leaf %N (see Supporting Information). Midden samples were radiocarbon dated at the University of California, Irvine KECK-CCAMS facility (Irvine, CA) and the Woods Hole NOSAMS facility (Woods Hole, MA; see Table S2 for the average age of each midden). For comparison, historic samples were obtained from herbaria. These samples originated primarily from the Snake Range, although some were collected from nearby locations in the Western U.S. (Table S2). Finally, modern samples were collected from living plants in the Snake Range in the fall of 2011 (Fig. 2).
Isotopic model of leaf physiology
We used a modelling approach that combines multiple lines of evidence to infer changes in gs and Amax since the LGM (Table 1a). Specifically, we used leaf δ13C values to calculate several physiological parameters: (1) ci, the concentration of CO2 in the leaf intercellular space, (2) the slope of the relationship between ci and ca, which reflects the relative rate of change in each variable since the LGM, (3) the ci/ca ratio, which reflects the balance between leaf-level processes influencing CO2 supply and demand at a given ca and (4) ca – ci, which reflects the gradient for CO2 movement into the leaf (Farguhar et al. 1982; Ehleringer & Cerling 1995; McCarroll et al. 2009). In combination, patterns in the slope of ci vs. ca, ci/ca, and ca – ci can be used to infer changes in gs and Amax since the LGM (see Table S1 and Fig. S1 for a hypothetical illustration of this model). It has been suggested that simultaneous changes in both gs and Amax are necessary to preserve the balance between stomatal and non-stomatal limitations on leaf-level physiology with rising ca (Ehleringer & Cerling 1995; Beerling 1996; Beerling & Rundgren 2000; Gerhart et al. 2012). Disproportionate decreases in gs and Amax would differentially affect the rate of change in ci as well as the magnitude and direction of changes in ci/ca and ca – ci. For example, if gs decreased more than Amax since the LGM as predicted based on increasing ca combined with decreasing water availability, then ci would increase slower than ca (Table 1, Hypothesis 2). However, if Amax decreased more than gs since the LGM as predicted based on increasing ca combined with decreasing N availability, then ci would increase faster than ca (Table 1, Hypothesis 3). Alternatively, if changes in gs perfectly offset simultaneous changes in Amax, or if neither parameter changed over time, then ci would increase proportionally to ca (Table 1, Hypothesis 1). Observations of stomatal characteristics and leaf %N can provide mechanistic support for potential changes (or lack thereof) in gs and Amax.
Table 1.
Hypothesised (a) and observed (b–d) responses to global change since the LGM. Observed changes in the slope of ci vs. ca, ci/ca, ca – ci, leaf %N, stomatal index and stomatal pore size are shown for each plant family (b), the dominant Transition species (c) and the dominant Holocene species (d). Results for each taxon were interpreted based on the hypothesised responses (a).
| Slope of ci vs. ca | ci/ca | ca – ci | Leaf %N | Stomatal index and pore size* | Interpretation | |
|---|---|---|---|---|---|---|
| (a) Hypothesised responses | ||||||
| Hypothesis 1a | 1 | Increased | Constant | Constant | Constant | No change in gs or Amax |
| Hypothesis 1b | 1 | Increased | Constant | Decreased | Decreased | gs and Amax decreased equally |
| Hypothesis 2 | <1 | Increased† | Increased | Constant | Decreased | gs decreased more than Amax |
| Hypothesis 3 | >1 | Increased | Decreased | Decreased | Constant | Amax decreased more than gs |
| (b) Plant families | ||||||
| Asteraceae | >1 | Increased | Decreased | – | – | Amax decreased more than gs |
| Poaceae | <1 | Constant† | Increased | – | – | gs decreased more than Amax |
| Cupressaceae | <1 | Increased | Increased | – | – | gs decreased more than Amax |
| Ephedraceae | 1 | Increased | Constant | – | – | No change or gs and Amax decreased equally |
| Pinaceae | 1 | Increased | Constant | – | – | No change or gs and Amax decreased equally |
| (c) Dominant transition species | ||||||
| Juniperus communis | 1 | Increased | Constant | Constant | – | No change in gs or Amax |
| Pinus flexilis | <1 | Increased | Increased | Decreased | – | gs decreased more than Amax |
| Pinus longaeva | 1 | Increased | Constant | Decreased | Constant | gs and Amax decreased equally |
| (d) Dominant Holocene species | ||||||
| Abies concolor | 1 | Increased | Decreased | Decreased | – | Amax decreased slightly more than gs |
| Juniperus osteosperma | 1 | Increased | Constant | Constant | Constant | No change in gs or Amax |
| Pinus monophylla | 1 | Increased | Constant | Decreased | – | gs and Amax decreased equally |
| Pinus ponderosa | 1 | Increased | Constant | Decreased | – | gs and Amax decreased equally |
A recent study suggests that small, dense pores might be most beneficial under low ca (Franks & Beeling 2009). In this case, increased pore size combined with decreased SI from glacial to modern times would support the hypothesis that gs decreased over time (Hypothesis 1b or 2).
Sample analysis
Isotopic analyses were conducted on 2–3.5 mg of crushed leaf tissue at the University of Kansas Keck Paleoenvironmental and Environmental Stable Isotope Laboratory (Lawrence, KS). We calculated ci, ci/ca, and ca – ci from leaf δ13C measurements and published ca records (Petit et al. 1999; EPICA 2004) using the methods of Gerhart et al. (2012) (see Supporting Information for detailed methods and ca values). Mass-based leaf %N was analysed in conjunction with δ13C for the seven dominant conifer species.
SI and pore size were measured on the most common glacial (PILO) and Holocene species (JUOS) due to sample availability and the time-intensive nature of these measurements. Leaves were imaged using a scanning electron microscope or epifluorescence light microscope (see Supporting Information). Images were then analysed in ImageJ to determine SI (number of stomata per epidermal cell) and pore size (μm2).
Data analysis
We analysed a total of 131 leaf samples (Table S2). For each time period, sample sizes per plant family and species ranged from 2 to 23 and 2 to 7, respectively, depending on sample availability in the herbaria and packrat midden collections (Table S3).
Data were analysed in R (Version 2.15.3, The R Foundation for Statistical Computing, Vienna, Austria) using three statistical approaches (see Tables S3–S6 for full statistical results). First, to assess the rate of change in ci relative to ca since the LGM, we used linear regression to determine the slope, 95% confidence intervals and R2 of the relationship between ci and ca for each plant family and species. Second, for each taxonomic group we used separate one-way analysis of variance (ANOVAS) to assess temporal changes in ci/ca, ca – ci, %N, SI and pore size (N and stomatal data were assessed at the species level). Third, we used two-way ANOVAS to compare temporal changes in ci/ca, ca – ci, and %N among co-occurring conifer species using time period, species and their interaction as independent variables. We excluded herbaria samples from the N analyses because some of these samples were collected from locations outside the Snake Range, and spatial variation in N availability could obscure temporal patterns in leaf %N. For the two-way ANOVAS we grouped the species according to those that were dominant during the Transition (JUCO, PIFL, PILO) and those that were dominant during the Holocene (ABCO, JUOS, PIMO, PIPO). Grouping taxa in this manner provided insight into whether co-occurring taxa exhibited similar responses to global change, and whether leaf-level physiology may have contributed to shifts in community composition since the LGM.
RESULTS
Our results indicate that gs and Amax decreased since the LGM, although the timing and magnitude of these physiological responses varied among plant families and species. Below we describe variation in physiological responses among the five plant families, species that were dominant during the Transition and species that were dominant during the Holocene. In general, physiology was more similar within plant families regardless of when species were dominant.
Variation among plant families
Patterns in the slope of ci vs. ca, ci/ca, and ca – ci indicate that relative changes in gs and Amax differed among plant families (Table 1b). First, ci increased faster than ca since the LGM for Asteraceae (slope 95% CI = 1.10–1.32), but slower than ca for Cupressaceae (slope 95% CI = 0.65–0.94) and Poaceae (slope 95% CI = 0.59–0.90, Fig. 3a). For both Ephedraceae and Pinaceae, ci increased proportionally to rising ca since the LGM (slope not different from 1, Fig. 3a). Second, ci/ca increased for Asteraceae, Cupressaceae, Ephedraceae and Pinaceae (P < 0.05 in all cases, Fig. 3b), but the magnitude of these increases varied across time within each family. For Pinaceae, the largest change in ci/ca occurred following the Transition time period, while for Asteraceae, Cupressaceae and Ephedraceae, the change in ci/ca was greatest following the Holocene time period. In contrast to the other plant families, ci/ca was relatively constant over time for Poaceae (P > 0.5, Fig. 3b). Third, the direction and timing of changes in ca – ci differed among families (Fig. 3c). Specifically, ca – ci increased since the LGM for Poaceae and Cupressaceae (P < 0.05 for both), but decreased for Asteraceae (P < 0.0001). For Asteraceae, the decrease in ca – ci did not occur until after the Holocene time period. Finally, ca – ci remained relatively constant over time for Ephedraceae and Pinaceae (P > 0.4 for both).
Figure 3.

Plant families and species differed in the slope of ci vs. ca as well as the magnitude and timing of changes in ci/ca and ca – ci. Panels show mean (− SE) ci, ci/ca, and ca – ci for the five plant families (a–c), dominant Transition species (d–f) and dominant Holocene species (g–i). Data are plotted against the mean ca for each time period (LGM, last glacial maximum; T, glacial–interglacial transition; MH, mid-Holocene; H, historic and M, modern). The red dashed lines in panels a, d and g represent a slope = 1. Species abbreviations are as follows: Juniperus communis (JUCO), Pinus flexilis (PIFL), Pinus longaeva (PILO), Abies concolor (ABCO), Juniperus osteosperma (JUOS), Pinus monophylla (PIMO) and Pinus ponderosa (PIPO).
The combination of changes in ci vs. ca, ci/ca and ca – ci since the LGM indicate that Amax decreased more than gs in Asteraceae, gs decreased more than Amax in Poaceae and Cupressaceae, and either there was no change in leaf-level physiology or gs and Amax decreased equally in Ephedraceae and Pinaceae (Table 1b). For the Pinaceae, species-level responses (see below) support the hypothesis that changes in gs offset changes in Amax.
Variation among the dominant Transition species
Patterns in the slope of ci vs. ca, ci/ca and ca – ci indicate that leaf-level responses to global change varied among the dominant Transition species. First, ci increased slower than ca since the Transition in PIFL (slope 95% CI = 0.55–0.97, Fig. 3d). In contrast, ci increased proportionally to ca in JUCO and PILO (slope not different from 1, Fig. 3d). Second, ci/ca increased since the Transition in PIFL, PILO and JUCO; however, the timing of these increases differed among species (time × species, P < 0.05, Fig. 3e). For PILO, which was the only conifer species represented in the glacial samples, ci/ca remained constant from the Glacial to the Transition, and then increased steadily from the Transition to the Modern. In contrast, ci/ca increased from the Transition to the Historic for JUCO and PIFL, but then remained constant from the Historic to the Modern. Third, temporal patterns in ca – ci also varied among species (time × species, P < 0.01, Fig. 3f). Specifically, ca – ci increased significantly since the Transition for PIFL (P < 0.05), but remained constant for JUCO (P > 0.1). In contrast to both PIFL and JUCO, ca – ci first increased and then decreased for PILO resulting in no net difference in ca – ci between Glacial and Modern trees (P > 0.4).
Temporal patterns in leaf %N varied among the dominant Transition species (time × species, P < 0.001, Fig. 4a), further indicating that these taxa differed in their leaf-level responses to global change. In particular, leaf %N decreased significantly since the LGM in PILO (P < 0.01). In contrast, leaf % N did not change over time in JUCO (P > 0.3), and only marginally decreased since the Transition in PIFL (P = 0.08).
Figure 4.
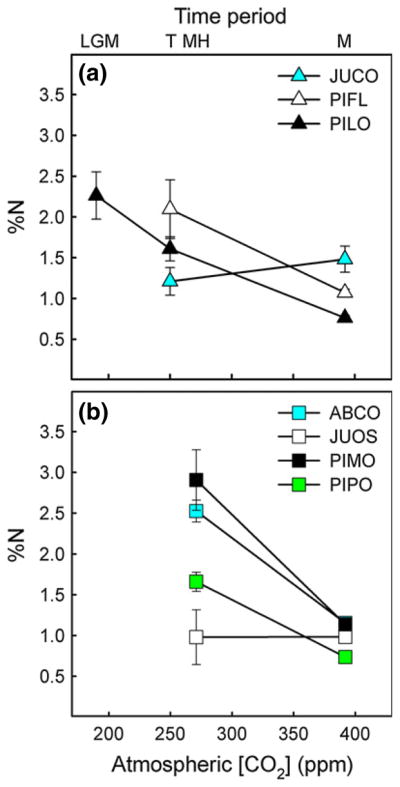
The dominant Transition (a) and Holocene (b) species differed in the degree to which leaf %N (mean − SE) changed over time. Data are plotted against the mean ca for each time period. Time period and species abbreviations are as described for Figure 3.
The combination of temporal patterns in ci vs. ca, ci/ca, ca – ci and %N indicates that neither gs nor Amax changed over time in JUCO, but that gs decreased more than Amax since the Transition in PIFL. For PILO, isotopic and %N results indicate that both gs and Amax decreased since the LGM (Table 1c); however, neither SI nor pore size changed significantly in this species over time (P > 0.1, Fig 5).
Figure 5.

Mean (− SE) stomatal index (a) and pore size (b) did not change over time for Juniperus osteosperma or Pinus longaeva. Data are plotted against the mean ca for each time period. Time period abbreviations are as described for Figure 3.
Variation among the dominant Holocene species
Patterns in the slope of ci vs. ca, ci/ca and ca – ci indicate that leaf-level responses to global change varied among the dominant Holocene species. First, although ci increased proportionally to rising ca since the Holocene in all four species (slope not different from 1, Fig. 3g), the rate of this change was slightly faster in ABCO. Second, ci/ca increased since the Holocene in ABCO, JUOS, PIMO and PIPO (P < 0.05 in all cases); however, the magnitude of these changes varied significantly among species (time × species, P < 0.01, Fig. 3h). In particular, compared to the other three species, ABCO exhibited a greater increase in ci/ca from Historic to Modern times. Third, temporal patterns in ca – ci varied substantially among species (time × species, P < 0.01, Fig. 3i). Specifically, from Holocene to Modern times, ca – ci decreased significantly in ABCO (P < 0.05), but only marginally in PIPO (P = 0.07). In contrast, ca – ci exhibited no change since the Holocene in JUOS and PIMO (P > 0.1 for both).
Temporal patterns in leaf %N varied among the dominant Holocene species (time × species, P < 0.001, Fig. 4b), further indicating that these taxa differed in their leaf-level responses to global change. In particular, leaf %N decreased significantly since the Holocene in ABCO, PIMO and PIPO (P < 0.01 in all cases). In contrast, leaf %N did not change over time in JUOS (P > 0.9).
The combination of changes in ci vs. ca, ci/ca, ca – ci and %N since the Holocene indicates that gs and Amax decreased equally in PIMO and PIPO, Amax decreased more than gs in ABCO, and neither gs nor Amax changed in JUOS (Table 1d). For JUOS, the lack of a significant change in SI and pore size (P > 0.1, Fig. 5) further indicates that gs did not decrease over time.
DISCUSSION
Comparisons of leaf-level physiology across co-occurring taxa within intact communities will improve our understanding of physiological responses to global change, and provide insights into changes in physiology that may underlie shifts in species distributions and community composition across geologic time. Until now, analyses of physiological responses in glacial plants have been limited to one or a small number of species per study and site (e.g. Van de Water et al. 1994; Beerling & Rundgren 2000; Ward et al. 2005; Gerhart et al. 2012). Here, we sampled leaves from a mixed, intact plant community in the Snake Range over a ~30 kyr time scale. Using stable carbon isotopes, leaf %N and stomatal characteristics, we inferred temporal shifts in leaf-level physiology, and compared those responses to well-documented shifts in species distributions and community composition since the LGM (Wells 1983). Our results provide new insights into several key aspects of plant and community responses to global change over recent geologic history. We show that (1) gs and/or Amax decreased with changing conditions since the LGM in most of the sampled plant taxa, (2) leaf-level physiology combined with unique life-history traits likely influenced the distribution of PILO, (3) changes in measured physiological traits were not associated with shifts in community composition since the LGM and (4) evolutionary history of plant lineages is an important determinant of physiological adaptation to global change.
In most cases, we found evidence that gs and/or Amax decreased with global change since the LGM (Table 1); however, the magnitude of these changes often varied across time within a family or species. For example, isotopic data for the Pinaceae were consistent with a larger decrease in gs from the LGM to the Transition, while patterns from the Transition to the Holocene suggest a larger decrease in Amax (Fig. 3a–c; Table 1a). A similar pattern of temporal variation in physiological responses was observed in the Asteraceae. These temporal patterns indicate that gs and Amax may differ in the degree or rate at which they respond to global change (Anderson et al. 2001; Andreu-Hayles et al. 2011), and that shifts in the relative strength of carbon vs. water or nutrient limitations through geologic history can strongly influence leaf-level physiology (Gerhart et al. 2012).
In this study, we found evidence that leaf-level physiology combined with unique life-history traits may have influenced the distribution and abundance of PILO in the Snake Range. Similar to the other Pinaceae species, gs and Amax likely decreased in PILO since the LGM. However, in contrast to the other species, PILO shifted from a near monoculture during the LGM to small relict populations today (Wells 1983). We suggest that differences in several key life-history traits allowed PILO to take greater advantage of high gs and Amax during the LGM, and potentially contributed to the shift in this species’ distribution over time. Specifically, low-temperature tolerance (Kral 1993) combined with high gs and Amax may have allowed PILO to become the dominant species during the LGM when both temperature and ca were low. The extreme longevity of PILO leaves (up to 45 year, Ewers & Schmid 1981) also likely offset the greater investment in leaf N content needed to maintain high Amax by allowing these plants to increase carbohydrate production per unit of N over longer periods of time. Furthermore, the moderate drought tolerance of PILO (Kral 1993) may have allowed this species to maintain the higher rates of gs necessary to benefit from increased Amax during the LGM. Interestingly, the lack of temporal changes in SI and pore size for PILO supports the hypothesis that reduced sensitivity to vapour pressure deficit caused higher gs under low ca (Arneth et al. 2002; Maherali et al. 2003). During more recent time periods, rising ca combined with higher temperatures and greater water limitation likely reduced the time frame in which PILO could take advantage of high Amax. In addition, studies show low levels of ectomycorrhizal inoculum in modern PILO forests (Bidartondo et al. 2001). Since ectomycorrhizal fungi (EMF) increase N uptake (Hobbie & Hobbie 2006), low fungal colonisation of PILO roots could reduce the ability of this species to compete for N in a more diverse community. Taken together, the results of these studies suggest that a unique combination of physiological, ecological and life-history traits impacted PILO’s distribution and response to global change in the Snake Range.
Although we found evidence of linkages between physiology and shifts in PILO’s distribution, temporal changes in leaf-level physiology were not strongly associated with well-documented shifts in overall community composition following the Transition period (Wells 1983). It is possible that other physiological traits beyond the scope of individual leaves, such as whole-plant resource allocation patterns, may have contributed to community shifts. Extreme climate events (e.g. fires, droughts) that are difficult to reconstruct over geologic time may have also played a role in determining community composition.
Interestingly, leaf-level responses were most similar within a family, regardless of when a particular species was dominant. For example, JUCO, PIFL and PILO were codominant during the Transition period while ABCO, JUOS, PIMO and PIPO became more abundant during the Holocene (Wells 1983). If leaf-level physiology contributed to this shift in composition, then patterns in gs and Amax should differ between the dominant Transition and Holocene taxa. Instead, Pinaceae species were generally more responsive to global change than co-occurring Cupressaceae species. This suggests that evolutionary history may be an important driver of family-level adaptation to long-term changes in resource availability in the Snake Range.
The differences between Pinaceae and Cupressaceae taxa were the most striking example of taxonomic variation in leaf-level physiology. These two families, though both conifers, diverged over 200 Ma (Rai et al. 2008; Mao et al. 2012), and modern species exhibit different physiological, ecological and life-history traits. The comparison of these taxa greatly extends the temporal range of studies describing variation in family-and species-level responses to global change (Waterhouse et al. 2004; Shuxia et al. 2006; Liu et al. 2007; Crous et al. 2010). For the Pinaceae, reductions in leaf %N combined with results inferred from isotopic data support the hypothesis that both gs and Amax decreased since the LGM. These results are also consistent with the general hypothesis that changes in both leaf parameters are likely required to maintain the balance between stomatal and non-stomatal controls on photosynthesis (Ehleringer & Cerling 1995). In sharp contrast, results for the Cupressaceae suggest that these taxa were unresponsive to changing conditions since the LGM. Although, at the family level, isotopic results for Cupressaceae were consistent with a slight decrease in gs over time, individual results for JUCO and JUOS suggest that neither gs nor Amax changed in response to shifting resource availability. Since JUOS increased in abundance in the Snake Range after the Holocene, overall lower gs for JUOS compared to JUCO could explain the family-level results. These data differ from studies of other ancient Juniperus species in southern California (La Brea tar pits) where isotopic results suggest that Juniperus was more responsive to global change since the LGM (Gerhart et al. 2012). A greater change in water limitation over time for plants at that site compared to the Snake Range may have contributed to the differences between these studies.
Interestingly, temporal patterns in leaf %N differed greatly between Pinaceae and Cupressaceae families in our study. Associations with mycorrhizal fungi could have contributed to these patterns since EMF typically colonise Pinaceae species, whereas arbuscular mycorrhizal fungi (AMF) typically colonise Juniperus species (Wang & Qiu 2006; EMF can colonise JUCO in some systems). Since EMF increase N uptake (Hobbie & Hobbie 2006) more so than AMF (Leigh et al. 2009), these fungal symbionts may have allowed their Pinaceae hosts to better compete for N, which as suggested by our results, could have enhanced their ability to respond to global change by altering Amax (Table 1).
In conclusion, our assessment of leaf-level physiology in an ancient plant community provides novel insights into physiological responses to global change since the LGM. Through analyses of modern and ancient plant specimens preserved in packrat middens, we show that a combination of unique life-history traits and leaf-level physiology likely influenced the distribution of PILO since the LGM. However, our results indicate that changes in leaf-level physiology cannot fully explain major shifts in community composition. Instead, for the Snake Range, we show that evolutionary history at the level of plant family underlies variation in leaf-level responses to global change since the LGM.
Supplementary Material
Acknowledgments
We thank the late Professor Philip Wells for his lifelong efforts to form and maintain the packrat midden collection, and Anke Wells for donating that extensive collection to the University of Kansas. We also thank the R. L. McGregor and University of Nevada-Reno Herbaria for providing historic samples, and Melissa Buzzard (Bureau of Land Management, NV) and Gary Reese (Logan Simpson Design, Inc., Tempe, AZ) for collecting modern leaf samples. Modern samples were collected under permits issued by the U.S. National Park Service – Great Basin National Park and the U.S. National Forest Service – Humboldt Toiyabe National Forest. Finally, we thank Charley Lewis for assistance with early method development, Greg Kane for assistance with isotopic analyses, John Southon for assistance with radiocarbon dating and three anonymous referees for comments on a previous draft of this manuscript. Funding for this work was provided by NIH IRACDA Postdoctoral Fellowships awarded to J. S. M. and K. M. B., and a NSF Career Award to J. K. W.
Footnotes
AUTHORSHIP
K. M. B., J. S. M. and J. K. W. designed the study; all authors participated in conducting the research; K. M. B., J. S. M. and J. K. W. drafted the manuscript, and all authors contributed substantially to revisions.
Additional Supporting Information may be downloaded via the online version of this article at Wiley Online Library (www.ecologyletters.com).
References
- Anderson LJ, Maherali H, Johnson HB, Polley HW, Jackson RB. Gas exchange and photosynthetic acclimation over subambient to elevated CO2 in a C3-C4 grassland. Global Change Biol. 2001;7:693–707. [Google Scholar]
- Andreu-Hayles L, Planells O, Gutierrez E, Muntan E, Helle G, Anchukaitis KJ, et al. Long tree-ring chronologies reveal 20th century increases in water-use efficiency but no enhancement of tree growth at five Iberian pine forests. Global Change Biol. 2011;17:2095–2112. [Google Scholar]
- Arneth A, Lloyd J, Santruckova H, Bird M, Grigoryev S, Kalaschnikov YN, et al. Response of central Siberian Scots pine to soil water deficit and long-term trends in atmospheric CO2 concentration. Global Biogeochem Cycles. 2002;16:5-1–15-13. doi: 10.1029/2000GB001374. [DOI] [Google Scholar]
- Beerling DJ. Ecophysiological responses of woody plants to past CO2 concentrations. Tree Physiol. 1996;16:389–396. doi: 10.1093/treephys/16.4.389. [DOI] [PubMed] [Google Scholar]
- Beerling DJ. Evolutionary responses of land plants to atmospheric CO2. In: Ehleringer JR, Cerling TE, Dearing MD, editors. A History of Atmospheric CO2 and its Effects on Plants, Animals, and Ecosystems. Springer; New York: 2005. pp. 114–132. [Google Scholar]
- Beerling DJ, Rundgren M. Leaf metabolic and morphological responses of dwarf willow (Salix herbacea) in the sub-arctic to the past 9000 years of global environmental change. New Phytol. 2000;145:257–269. [Google Scholar]
- Bidartondo MI, Baar J, Bruns TD. Low ectomycorrhizal inoculum potential and diversity from soils in and near ancient forests of bristlecone pine (Pinus longaeva) Can J Bot. 2001;79:293–299. [Google Scholar]
- Braconnot P, Otto-Bliesner B, Harrison S, Joussaume S, Peterchmitt JY, Abe-Ouchi A, et al. Results of PMIP2 coupled simulations of the Mid-Holocene and last glacial maximum - Part 1: experiments and large-scale features. Clim Past. 2007;3:261–277. [Google Scholar]
- Crous KY, Reich PB, Hunter MD, Ellsworth DS. Maintenance of leaf N controls the photosynthetic CO2 response of grassland species exposed to 9 years of free-air CO2 enrichment. Global Change Biol. 2010;16:2076–2088. [Google Scholar]
- DeLucia EH, Schlesinger WH. Resource-use efficiency and drought tolerance in Great Basin and Sierran plants. Ecology. 1991;72:51–58. [Google Scholar]
- Ehleringer JR, Cerling TE. Atmospheric CO2 and the ratio of intercellular to ambient CO2 concentrations in plants. Tree Physiol. 1995;15:105–111. doi: 10.1093/treephys/15.2.105. [DOI] [PubMed] [Google Scholar]
- EPICA. Eight glacial cycles from an Antarctic ice core. Nature. 2004;429:623–628. doi: 10.1038/nature02599. [DOI] [PubMed] [Google Scholar]
- Ewers FW, Schmid R. Longevity of needle fascicles of Pinus longaeva (bristlecone pine) and other North American pines. Oecologia. 1981;5:107–115. doi: 10.1007/BF00344660. [DOI] [PubMed] [Google Scholar]
- Farguhar GD, O’Leary MH, Berry JA. On the relationship between carbon isotope discrimination and the intercellular carbon dioxide concentration in leaves. Funct Plant Biol. 1982;9:121–137. [Google Scholar]
- Franks PJ, Beeling DJ. Maximum leaf conductance driven by CO2 effects on stomatal size and density over geologic time. Proc Natl Acad Sci USA. 2009;106:10343–10347. doi: 10.1073/pnas.0904209106. [DOI] [PMC free article] [PubMed] [Google Scholar]
- Gagen M, Finsinger W, Wagner-Cremer F, McCarroll D, Loader NJ, Robertson I, et al. Evidence of changing intrinsic water-use efficiency under rising atmospheric CO2 concentrations in Boreal Fennoscandia from subfossil leaves and tree ring delta 13C ratios. Global Change Biol. 2011;17:1064–1072. [Google Scholar]
- Gerhart LM, Ward JK. Plant responses to low [CO2] of the past. New Phytol. 2010;188:674–695. doi: 10.1111/j.1469-8137.2010.03441.x. [DOI] [PubMed] [Google Scholar]
- Gerhart LM, Harris JM, Nippert JB, Sandquist DR, Ward JK. Glacial tress from the La Brea tar pits show physiological constraints of low CO2. New Phytol. 2012;194:63–69. doi: 10.1111/j.1469-8137.2011.04025.x. [DOI] [PubMed] [Google Scholar]
- Hobbie JE, Hobbie EA. N-15 in symbiotic fungi and plants estimates nitrogen and carbon flux rates in Arctic tundra. Ecology. 2006;87:816–822. doi: 10.1890/0012-9658(2006)87[816:nisfap]2.0.co;2. [DOI] [PubMed] [Google Scholar]
- IPCC. Climate change 2007: the physical science basis. In: Solomon S, Qin D, Manning M, Chen Z, Marquis M, Averyt KB, et al., editors. Contribution of Working Group I to the IPCC Fourth Assessment Report of the Intergovernmental Panel on Climate Change. Cambridge University Press; New York: 2007. [Google Scholar]
- Kral R. FoNAE Committee, editor. Flora of North America North of Mexico. Vol. 2. Oxford University Press; New York: 1993. Pinus; pp. 352–399. [Google Scholar]
- Leigh J, Hodge A, Fitter AH. Arbuscular mycorrhizal fungi can transfer substantial amounts of nitrogen to their host plant from organic material. New Phytol. 2009;181:199–207. doi: 10.1111/j.1469-8137.2008.02630.x. [DOI] [PubMed] [Google Scholar]
- Liu XH, Shao XM, Liang EY, Zhao LJ, Chen T, Qin D, et al. Species-dependent responses of juniper and spruce to increasing CO2 concentration and to climate in semi-arid and arid areas of northwestern China. Plant Ecol. 2007;193:195–209. [Google Scholar]
- Maherali H, Johnson HB, Jackson RB. Stomatal sensitivity to vapour pressure difference over a subambient to elevated CO2 gradient in a C3/C4 grassland. Plant, Cell Environ. 2003;26:1297–1306. [Google Scholar]
- Mao K, Milne RI, Zhang L, Peng Y, Liu J, Thomas P, et al. Distribution of living Cupressaceae reflects the breakup of Pangea. Proc Natl Acad Sci USA. 2012;109:7793–7798. doi: 10.1073/pnas.1114319109. [DOI] [PMC free article] [PubMed] [Google Scholar]
- McCarroll D, Gagen MH, Loader NJ, Robertson I, Anchukaitis KJ, Los S, et al. Correction of tree ring stable isotope chronologies for changes in carbon dioxide content of the atmosphere. Geochim et Cosmochim Acta. 2009;73:1539–1547. [Google Scholar]
- McLauchlan KK, Williams JJ, Craine JM, Jeffers ES. Changes in global nitrogen cycling during the Holocene epoch. Nature. 2013;495:352–355. doi: 10.1038/nature11916. [DOI] [PubMed] [Google Scholar]
- NOAA. [Last accessed 7 November 2011.];NOAA’s 1981–2010 Climate Normals, Station USC00263340. 2011 Available at: http://www1.ncdc.noaa.gov/pub/data/normals/1981-2010/
- Petit JR, Jouzel J, Raynaud D, Barkov NI, Barnola JM, Basile I, et al. Climate and atmospheric history of the past 420,000 years from the Vostok ice core, Antarctica. Nature. 1999;399:429–436. [Google Scholar]
- Quirk J, McDowell N, Leake JR, Hudson PJ, Beerling DJ. Increased susceptibilty to drought-induced mortality in Sequoia sempervirens (Cupressaceae) trees under Cenozoic atmospheric carbon dioxide starvation. Am J Bot. 2013;100:582–591. doi: 10.3732/ajb.1200435. [DOI] [PubMed] [Google Scholar]
- Rai HS, Reeves PA, Peakall R, Olmstead RG, Graham SW. Inference of higher-order conifer relationships from a multi-locus plastid data set. Botany. 2008;86:658–669. [Google Scholar]
- Ripley B, Cunniff J, Osborne C. Photosynthetic acclimation and resource use by the C3 and C4 subspecies of Alloteropsis semialata in low CO2 atmospheres. Global Change Biol. 2013;19:900–910. doi: 10.1111/gcb.12091. [DOI] [PubMed] [Google Scholar]
- Sage RF, Coleman JR. Effects of low atmospheric CO2 on plants: More than a thing of the past. Trends Plant Sci. 2001;6:18–24. doi: 10.1016/s1360-1385(00)01813-6. [DOI] [PubMed] [Google Scholar]
- Saurer M, Siegwolf RTW, Schweingruber FH. Carbon isotope discrimination indicates improving water-use efficiency of trees in northern Eurasia over the last 100 years. Global Change Biol. 2004;10:2109–2120. [Google Scholar]
- Shuxia Z, Zhouping S, Quingwu X. The δ13C changes in four plant species of the Loess Plateau over the last 70 years. Acta Physiol Plant. 2006;28:257–262. [Google Scholar]
- Smith RA, Lewis JD, Ghannoum O, Tissue DT. Leaf structural responses to pre-industrial, current and elevated atmospheric CO2 and temperature affect leaf function in Eucalyptus sideroxylon. Funct Plant Biol. 2012;39:285–296. doi: 10.1071/FP11238. [DOI] [PubMed] [Google Scholar]
- Tripati AK, Robers CD, Eagle RA. Coupling of CO2 and Ice Sheet Stability Over Major Climate Transitions of the Last 20 Million Years. Science. 2009;326:1394–1397. doi: 10.1126/science.1178296. [DOI] [PubMed] [Google Scholar]
- Van de Water PK, Leavitt SW, Betancourt JL. Trends in stomatal density and 13C/12C ratios of Pinus flexilis needles during last glacial-interglacial cycle. Science. 1994;264:239–243. doi: 10.1126/science.264.5156.239. [DOI] [PubMed] [Google Scholar]
- Wang B, Qiu YL. Phylogenetic distribution and evolution of mycorrhizas in land plants. Mycorrhiza. 2006;16:299–363. doi: 10.1007/s00572-005-0033-6. [DOI] [PubMed] [Google Scholar]
- Ward JK, Harris JM, Cerling TE, Wiedenhoeft A, Lott MJ, Dearing MD, et al. Carbon starvation in glacial trees recovered from the La Brea tar pits, southern California. Proc Natl Acad Sci USA. 2005;102:690–694. doi: 10.1073/pnas.0408315102. [DOI] [PMC free article] [PubMed] [Google Scholar]
- Waterhouse JS, Switsur VR, Barker AC, Carter AHC, Hemming DL, Loader NJ, et al. Northern European trees show a progressively diminishing response to increasing atmospheric carbon dioxide concentrations. Quat Sci Rev. 2004;23:803–810. [Google Scholar]
- Wells PV. Paleobiogeography of montane islands in the Great Basin since the last glaciopluvial. Ecol Monogr. 1983;53:341–382. [Google Scholar]
Associated Data
This section collects any data citations, data availability statements, or supplementary materials included in this article.